BTC - Accumulation, Manipulation & Distributioncurrent market structure
this btcusdt 1-hour chart illustrates a classic three-phase market structure: accumulation, manipulation, and potential distribution. the price action follows a strong bullish impulse, after which the market enters a sideways range suggesting absorption of previous selling pressure. this kind of behavior is often observed before a continuation of the prevailing trend, but not without intermediate structural games, as seen in the projected manipulation phase.
accumulation phase
the blue highlighted zone marks a consolidation range that serves as an accumulation phase. during this stage, large market participants likely accumulate positions quietly while maintaining the price within a defined range. the tight price action within this zone and relatively small candles are consistent with market absorption, where supply is being matched or outpaced by demand. the repeated rejections of lower prices in this range imply growing buyer interest and strength building beneath the surface.
unfilled fair value gap
beneath the accumulation range lies an unfilled fair value gap (fvg), shown in grey. this price imbalance was left behind during the prior bullish leg and remains a magnet for price action. such gaps often attract price as the market seeks efficiency by mitigating unbalanced areas. the presence of this fvg makes it a likely candidate for a liquidity grab or retest before further bullish continuation.
manipulation setup
the red path outlines a possible short-term manipulation event. this move involves a quick sweep of liquidity beneath the accumulation zone, triggering stop-losses from late long entries and drawing price into the fvg. this is a classic “spring” or “shakeout” scenario designed to trap sellers and create panic, thereby enabling larger players to enter at discounted prices. the manipulation tag here signals a deliberate attempt to create false downside conviction before reversing upward.
re-accumulation and breakout
following the manipulation phase, the green projection shows a sharp reversal and aggressive push upward, initiating a new bullish leg. this move represents re-accumulation, where price quickly exits the range and enters an expansion phase. momentum will likely increase after price breaks back above the original range high, signaling confidence in the trend continuation and drawing in breakout traders. the large green area indicates the expected path toward a new distribution zone.
distribution projection
at the top of the chart, the green box represents a possible future distribution zone. after an extended bullish run, price often enters distribution, where buying interest begins to wane, and larger participants start offloading positions into retail strength. although speculative at this point, its placement reflects the natural progression of a market cycle if the projected bullish move plays out.
market psychology
this chart reflects a clear sequence in market psychology: stealth accumulation, a manufactured dip to create fear (manipulation), followed by a surge fueled by both institutional entries and retail breakout traders. understanding this dynamic helps traders anticipate rather than react, positioning themselves in alignment with likely intent rather than emotional impulses.
summary
the chart outlines a structured bullish scenario with a potential manipulation wick into an unfilled fvg, setting the stage for a continuation higher. if price reacts strongly off the fvg and regains the range, confirmation of bullish intent would be established. this setup emphasizes the importance of understanding liquidity dynamics and price inefficiencies, favoring patient and strategic entries over reactive ones.
BTCUPUSDT trade ideas

Bitcoin - LifeTime Opportunity! Satoshi = AliensThis is probably the last time we see Bitcoin above 94,000 USDT! In the next months we can expect prices below 70k and 60k. Why? It's because of a huge bear market that started in February 2025 with Donald Trump's election.
Crypto technology is not new. It was brought to planet Earth from outside. This technology is already integrated on thousands of different planets in the galaxy. Mostly to convert a human to a cyborg with Elon Musk's AI Neuralink in our brain. AI will insert artificial thoughts to your mind, will tell you what to do, what to eat, who to be friends with, etc... If you don't want this, stop using AI. ( www.youtube.com )
On the 4H chart, Bitcoin is breaking down! The price is now below 2 major trendlines and 1 ascending channel. It seems like the minor uptrend from 74k to 97k definitely ended, and we are going to go only down. From the Elliott wave perspective, this minor uptrend looks corrective rather than impulsive. Even though there are no overlaps between major waves, the minor waves themselves look corrective. We have 3 major supports on the way down that you can use as your profit targets (see the chart).
Write a comment with your altcoin + hit the like button, and I will make an analysis for you in response. Trading is not hard if you have a good coach! It is not a trade setup, as there is no stop-loss or profit target. I share my trades privately. Thank you, and I wish you successful trades!

Mastering Fair Value Gaps (FVG) - How to use them in trading?In this guide, I’ll explain the concept of the Fair Value Gap (FVG), how it forms, and how you can use it to identify high-probability trading opportunities. You'll learn how to spot FVGs on a chart, understand their significance in price action, and apply a simple strategy to trade them effectively.
What will be explained:
- What is a FVG?
- How can a FVG occur?
- What is a bullish FVG?
- What is a bearish FVG?
- How to trade a FVG?
-------------------------------
What is a FVG?
A FVG is a technical concept used by traders to identify inefficiencies in price movement on a chart. The idea behind a fair value gap is that during periods of strong momentum, price can move so quickly that it leaves behind a "gap" where not all buy and sell orders were able to be executed efficiently. This gap creates an imbalance in the market, which price may later revisit in an attempt to rebalance supply and demand.
A fair value gap is typically observed within a sequence of three candles (or bars). The first candle marks the beginning of a strong move. The second candle shows a significant directional push, either bullish or bearish, often with a long body indicating strong momentum. The third candle continues in the direction of the move, opening and closing beyond the range of the first candle. The fair value gap itself is defined by the price range between the high of the first candle and the low of the third candle (in the case of a bullish move), or between the low of the first candle and the high of the third (in a bearish move). This range represents the area of imbalance or inefficiency.
-------------------------------
How can a FVG occur?
There are several factors that can trigger a fair value gap
- Economic news and announcements
- Earnings reports
- Market sentiment
- Supply and demand imbalances
-------------------------------
What is a bullish FVG?
A bullish FVG is a specific type of price imbalance that occurs during a strong upward move in the market. It represents a zone where the price moved so aggressively to the upside that it didn’t spend time trading through a particular range, essentially skipping over it.
This gap usually forms over the course of three candles. First, a bullish candle marks the beginning of upward momentum. The second candle is also bullish and typically has a large body, indicating strong buying pressure. The third candle opens higher and continues moving upward, confirming the strength of the move. The bullish fair value gap is the price range between the high of the first candle and the low of the third candle. This area is considered an imbalance zone because the market moved too quickly for all buyers and sellers to interact at those prices.
-------------------------------
What is a bearish FVG?
A bearish FVG is a price imbalance that forms during a strong downward move in the market. It occurs when price drops so rapidly that it leaves behind a section on the chart where little to no trading activity happened.
This gap is identified using a three-candle formation. The first candle typically closes bearish or neutral, marking the start of the move. The second candle is strongly bearish, with a long body indicating aggressive selling pressure. The third candle opens lower and continues the move down. The bearish fair value gap is the price range between the low of the first candle and the high of the third candle. That range is considered the imbalance zone, where price skipped over potential trade interactions.
-------------------------------
How to trade a FVG?
To trade a FVG effectively, wait for price to retrace back into the gap after it has formed. The ideal entry point is around the 50% fill of the FVG, as this often represents a balanced level where price is likely to react.
During the retracement, it’s helpful to see if the FVG zone aligns with other key technical areas such as support or resistance levels, Fibonacci retracement levels, or dynamic indicators like moving averages. These additional confluences can strengthen the validity of the zone and increase the probability of a successful trade.
Enter the trade at the 50% level of the FVG, and place your stop loss just below the most recent swing low (for a bullish setup) or swing high (for a bearish one). From there, manage the trade according to your risk-to-reward preferences—whether that’s 1:1, 1:2, or a higher ratio depending on your strategy and market conditions.
-------------------------------
Thanks for your support.
- Make sure to follow me so you don't miss out on the next analysis!
- Drop a like and leave a comment!

Bitcoin Breaks Wedge! Correction Coming Before Next Leg? After Trump said in the press conference, " Better go out and buy stocks now ." The SPX500 index started pumping , and as I said in the ideas of the last few days, Bitcoin ( BINANCE:BTCUSDT )'s correlation with this index has increased. Bitcoin also started pumping.
Yesterday's Bitcoin pump succeeded in failing the Ascending Broadening Wedge Pattern , generally, if the reversal pattern fails, it will play a continuation role .
Bitcoin is moving between the Support zone($100,270-$97,700) and the Resistance zone($109,588-$105,865) . The question is whether Bitcoin will touch the Support zone($100,270-$97,700) again and move towards the Resistance zone($109,588-$105,865) or will it continue its upward trend.
In terms of Elliott Wave theory , it seems that Bitcoin has completed microwave 3 of the main wave 5 . We can expect an even Time Correction on Saturday and Sunday when trading volume is low . There is also a possibility that microwave 4 of the main wave 5 in Cumulative Long Liquidation Leverage($101,838-$101,432) will be completed.
One of the reasons I think we should wait for a correction is the USDT.D% ( CRYPTOCAP:USDT.D ) chart, which we used as a guide in previous ideas .
USDT.D% has reached Monthly Support(1) and a Heavy Support zone(4.73%-4.50%) , which I believe is unlikely to be broken within in first attack , and I expect an increase to the Fibonacci lines on the chart.
I expect Bitcoin to start rising again after a correction .
Cumulative Short Liquidation Leverage: $105,114-$104,100
Note: If Bitcoin touches $97,500, we should expect further declines.
Please respect each other's ideas and express them politely if you agree or disagree.
Bitcoin Analyze (BTCUSDT), 2-hour time frame.
Be sure to follow the updated ideas.
Do not forget to put a Stop loss for your positions (For every position you want to open).
Please follow your strategy and updates; this is just my Idea, and I will gladly see your ideas in this post.
Please do not forget the ✅' like'✅ button 🙏😊 & Share it with your friends; thanks, and Trade safe.

TRADINGVIEW IS LOOKING FOR A NEW ENGLISH MODERATOR - IS IT YOU ?Join Our Team: Exciting Opportunity to Become a Moderator for the ENGLISH Language Community at TradingView!
Hello TradingView Enthusiasts,
Are you passionate about trading and the TradingView platform? We are on the lookout for a new moderator to join our ENGLISH Language Community and help elevate the experience for users like you.
As a moderator, your role is pivotal. You'll guide members, ensure adherence to our community standards, and help users maximize their TradingView experience. This is your chance to shine and directly influence the community dynamics while ensuring a friendly and respectful environment.
The General Tasks are:
✅ Replying to user inquiries that might get sent to you.
✅ Welcoming and encouraging new users
✅ Help reward and recognize users through TradingView Coins and Editors Picks.
✅ Keeping the peace in our chat rooms
✅ Helping ensure that the site rules are followed
✅ Help maintain the quality of the site - eg unsuggesting poor ideas and untagging non-educational posts.
✅ Being visible - keep posting your ideas, chat with users, post comments on users' ideas etc
While this is an unpaid volunteer position, the benefits are substantial:
✅ Exclusive Access : Engage directly with our internal team, including the founders.
✅ Influence Development : Provide input on platform enhancements and new functionalities.
✅ Free Plan : Enjoy a free EXPERT ($1,200 USD plan) account along with free data packs and exclusive merchandise.
✅ Boost Your Profile : Gain significant exposure, increase your follower count, and enhance your presence across the site.
✅ Career Opportunities : Many of our moderators have transitioned into full-time roles, using this position as a stepping stone to further their careers within TradingView.
We are looking for a Community Leader. We're looking for someone who:
✅ Has in-depth knowledge of the TradingView platform.
✅ Maintains a strong reputation within the community through high-quality content and helpful interactions.
✅ Engages positively with community members, respects diverse opinions, and upholds our community standards.
✅ Dedicates at least one hour daily to moderating and supporting the community.
✅ Has been an active, respected TradingView member for over six months with minimal rule violations.
✅ Possesses solid general trading knowledge and can communicate effectively in both spoken and written English and of course ENGLISH.
A good indication of this is:
✅ 100 or more posted trade ideas especially including educational ideas
✅ Consistently get likes for your posted ideas (quality over quantity)
✅ 100 or more genuine followers
✅ Interacts in Minds
✅ Interacts in Chatrooms
✅ Regularly responds to comments on their own and others posts
✅ Has created and posted a Script
You don't need to have done all of these things, but it does help you stand out in the crowd and demonstrate you are familiar with multiple areas of our site.
Think this could be you? Learn more about what it means to be a moderator here:
www.tradingview.com
Ready to apply? Please fill out this form in English:
forms.gle/bsdGF1hw64wc3Epq6
🤔 If you have any questions or need further information, feel free to reach out to @zAngus .
We're excited to see who will join our team next and help us continue to provide a world-class trading community experience.
Warm regards,
💖 TradingView Team

Ultimate Guide to Master CISDCISD stands for Consolidation, Inducement, Stop Hunt, Displacement. It’s a simple, repeatable structure that shows how smart money sets up traps in the market to grab liquidity and then make a clean move in the opposite direction.
If you’re serious about trading the ICT style, this is one of the most useful frameworks to learn. It helps you avoid chasing bad breakouts and teaches you to wait for real setups that come after stop hunts and proper market structure shifts.
But there’s one rule that’s non-negotiable — a CISD setup is only valid after a liquidity sweep. If the market hasn’t taken out a clear high or low where stops are sitting, then the rest of the model doesn’t mean anything. No sweep, no trade.
1. Start With the Liquidity Sweep
Everything begins with the liquidity grab. If price hasn’t taken out a high or low where stops are stacked, you should walk away from the setup. Don’t try to front-run a move before smart money has done its job.
The liquidity sweep is what gives the rest of the move power. That’s when price runs through obvious levels, swing highs, swing lows, the Asian range, New York session highs or lows and hits stop losses. Those stops give smart money fuel to enter in the opposite direction.
When you’re watching the market, ask yourself this:
"Who just got stopped out?"
If you can’t answer that, then it’s not a sweep. And if it’s not a sweep, it’s not a CISD.
2. Consolidation — Where Liquidity Builds
This is the first part of the structure. Price starts to move sideways in a tight range, usually during Asian session or during parts of London where volume is low. It can last for hours or even across sessions.
The key here is to understand what’s happening. Traders are placing buys above the highs and sells below the lows. Liquidity is building on both sides. It’s a trap being set. Retail traders are expecting a breakout, but smart money is waiting to use that breakout to their advantage.
Your job in this phase is to identify the range and mark out the highs and lows. That’s where stops will be sitting. You’re not looking to trade during this phase. You’re watching and planning
3. Inducement (sweep)— Fake Break to Trap Traders
After the range is set, price gives a small push out of the range just enough to get people to commit. This is the inducement. It’s the bait.
Let’s say the range high is being tested. Price breaks just above it, traders think it’s a breakout, and they go long. Maybe it holds for a couple of minutes, even gives a small push in their favor. But then it rolls over. That’s the trap. Now those traders are caught, and their stops are sitting below.
Sometimes the inducement comes before the real sweep. Other times, the inducement is the sweep. What matters is that traders have been lured into bad positions and their stops are exposed.
As a trader, your job is not to take the bait. Watch how price reacts to these fake moves. Often, they come with weak volume or are followed by an immediate sharp reversal.
4. Stop Hunt — The Sweep That Validates the Setup
This is where the real move starts to form. Price aggressively runs through the level that holds liquidity, usually below the low or above the high you marked earlier.
This is when smart money takes out the traders who were induced during the fake move. Their stops get hit, and that gives institutions the volume they need to get into the opposite side.
You should be actively watching for a reaction here. Do you see rejection? Does the candle close with a strong wick? Are there signs of absorption or order flow flipping?
This is your validation point. Once price sweeps liquidity and starts to reject the level, that’s your cue to get ready for the next part, the actual shift.
5. Displacement — The Real Move Begins
Once the sweep happens, price doesn’t just drift, it snaps back hard. This is called displacement.
Displacement is a sharp, clean move in the opposite direction of the stop hunt. This is when market structure breaks, momentum shifts, and a fair value gap usually forms.
This is your confirmation that the setup is live. The sweep happened, smart money entered, and now the market is moving with intent.
You don’t want to chase the displacement candle itself. Instead, wait for the retrace. Look for price to come back into the fair value gap or an order block left behind by the impulse. That’s your entry point.
Make sure:
Structure is broken in your direction
The move away is impulsive, not choppy
You’re not forcing an entry on a weak pullback
This is the only part of CISD where you actually take the trade. Everything else is just setup.
How to Manage Risk and Entries
Once you’ve got a valid setup, here’s how to manage it:
Entry: Enter on the CISD or wait for the pullback into the fair value gap or order block. Enter on the reaction or confirmation.
Stop Loss: Place it just past the low or high that got swept. If you’re long, your stop goes below the stop hunt candle. If you’re short, it goes above.
Take Profit: Target the next liquidity level. That could be the other side of the range, a swing high or low, or an inefficiency in price.
You can scale out if price approaches a session high or low, or hold for a full range expansion depending on the session.
Final Thoughts
The CISD model works because it’s built on how the market actually moves, not indicators, not random patterns, but liquidity.
Don’t jump in early. Don’t guess. Wait for the sweep. Wait for the displacement. That’s where the edge is.
Once you get used to watching this play out in real time, you’ll start to see it everywhere. It’s in Forex, crypto, indices, any market that runs on liquidity.
Stick to the rules. Let the model do its job. And remember: no sweep, no setup!
___________________________________
Thanks for your support!
If you found this guide helpful or learned something new, drop a like 👍 and leave a comment, I’d love to hear your thoughts! 🚀
Make sure to follow me for more price action insights, free indicators, and trading strategies. Let’s grow and trade smarter together! 📈

Bitcoin - Bulls vs Bears: 88k or 100k?Bitcoin has broken through the 4H imbalance zone that also acted as an old resistance area. The break came through a clear displacement candle, which showed strong intent from the market. That same move left behind a new gap just under the previous resistance. Although price already retested that area once, it didn’t fully fill the gap, so we could see one more retest to complete the 50% line before the market chooses direction.
Consolidation Structure
The range before the breakout was clean, with multiple rejections from the resistance zone. That zone was front-run several times, then finally broken with conviction. Now, price is hovering just under that broken level, and the new gap created by the displacement candle is still fresh and technically unfilled.
Below current price, there’s a large inefficiency sitting between 88.2k and 90k. This zone stands out because it’s not only a clean 4H imbalance, but it also aligns with the golden pocket retracement from the last major leg up. That type of confluence usually attracts liquidity, especially if price gets rejected from the gap above and starts moving lower.
Bullish/Bearish Scenarios
The bullish scenario would play out if price manages to reclaim the gap zone, pushes back above the resistance cleanly, and treats the gap as support. That would be a classic structure flip, where the previous resistance becomes a new base, and the gap gets inverted into a continuation zone. If we see that, the next upside targets would sit around the 96k to 97k area, where more liquidity is likely resting.
On the other hand, if price moves into the gap and gets rejected again, that confirms sellers are still active at that level. In that case, I’d expect the market to push down and start filling the inefficiencies below. The 88.2k to 90k area becomes the primary draw. It’s packed with confluence from the 4H imbalance and the golden pocket, and it also lines up with previous demand zones. If price reaches into that area, it could trigger a strong reaction and potentially form the next higher low.
Price Target and Expectations
If we see rejection from the current gap, the target shifts to the 88.2k to 90k zone. That’s where I’ll be watching for bullish signs, since it’s the type of level where buyers often step in. A clean reaction there could be the start of a new leg higher. But if the market doesn’t get that low, and instead pushes up through the resistance, then the bullish breakout scenario is active, and we’d be aiming higher toward the 96k range or even the 100k.
Current Stance
Right now, I’m in reactive mode. The trade will depend on what happens at the gap zone. If we get another rejection from it, I’ll look for a move into the golden pocket below. If we reclaim the gap and break resistance, I’ll be looking to enter on confirmation of the flip. No trade from the middle, only once price gives clear direction from either key level.
Conclusion
This is a clean two-scenario setup. Either price fills the remaining gap and flips resistance, triggering the bullish continuation, or we reject from that area again and drop into the 88.2k to 90k range for a deeper liquidity grab. Both are valid, and both offer high-probability trades once price confirms the path.
___________________________________
Thanks for your support!
If you found this idea helpful or learned something new, drop a like 👍 and leave a comment, I’d love to hear your thoughts! 🚀
Make sure to follow me for more price action insights, free indicators, and trading strategies. Let’s grow and trade smarter together! 📈

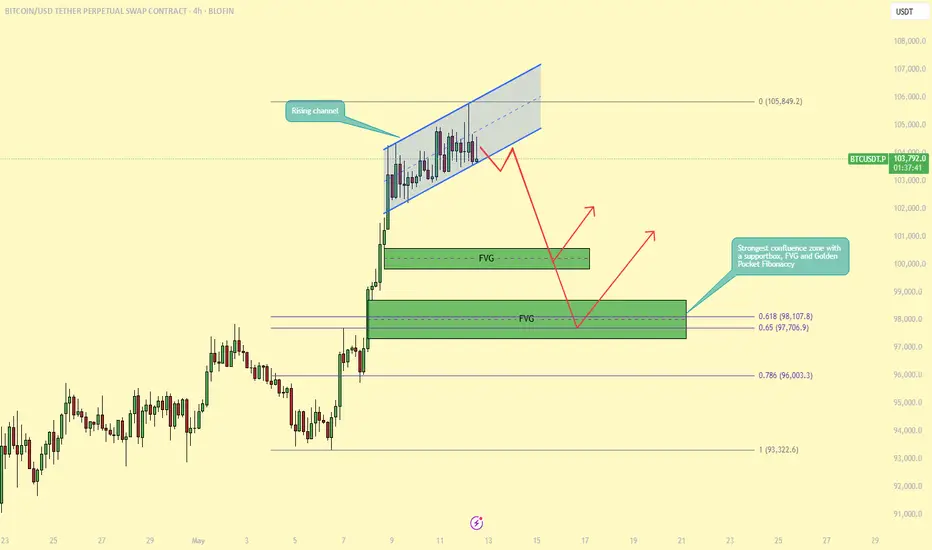
BTC – One last pushmarket context and structure
This BTCUSDT 4-hour chart from BYBIT provides a broader perspective on BTC’s ongoing uptrend, emphasizing the role of fair value gaps in guiding price behavior. After a prolonged period of sideways action and consolidation, BTC initiates a sharp bullish impulse that breaks previous structure and introduces fresh momentum into the market. Each leg higher is followed by a corrective phase, during which multiple fair value gaps (FVGs) are formed. These FVGs serve as structural inefficiencies left by aggressive buying pressure and outline key zones of interest for future price interaction.
fair value gaps and institutional demand
The chart identifies three key FVGs that have influenced BTC’s price action. The lowest FVG, created during the initial breakout below the 89,000 zone, is the origin of this current bullish leg and reflects strong institutional involvement. The mid-level FVG, created as BTC pushed through the 94,000–96,000 region, marks another significant shift in order flow. The most recent FVG, created just prior to the most recent impulse, lies just beneath the 98,000 level and represents a more immediate zone of demand. Price is currently trading above this uppermost FVG, indicating that it may act as a reaccumulation zone if price retraces.
liquidity dynamics and continuation thesis
The projection drawn on the chart suggests a short-term retracement back into the upper FVG before a potential continuation higher. This idea is rooted in the expectation that institutional participants will revisit unfilled orders left within the FVG before driving price upward toward new liquidity pools. The light blue shaded zone indicates the potential target range for this continuation. The market has consistently respected prior FVGs, confirming their role as reliable demand zones and reinforcing the current bullish bias.
price behavior and structural clarity
BTC’s price action on this timeframe is characterized by impulse–correction cycles with clearly defined inefficiencies. Each impulse leaves behind an FVG, which is either fully or partially mitigated during pullbacks. The most recent bullish leg has created an unmitigated FVG directly beneath current price, suggesting that if a retracement occurs, it is likely to interact with this gap before continuing the upward trajectory. This behavioral pattern of clean imbalances followed by targeted mitigation is a strong indicator of organized institutional involvement in the market.
interpretation and tactical insight
The chart outlines a strategic approach to navigating BTC’s current bullish structure. Rather than entering impulsively, the analysis encourages waiting for price to retrace into identified imbalance zones where the probability of sustained movement is higher. Fair value gaps provide a roadmap for understanding where price is likely to react and continue. In this case, if BTC revisits the nearest FVG and holds that level, it sets the stage for continuation toward the 101,000–102,000 zone, in line with the drawn projection. The setup remains aligned with smart money trading methodology, where price is guided by liquidity and imbalance mechanics.

Bitcoin - $100k retest before new ATH?Bitcoin has broken out of its 1-hour ascending channel with a sharp bearish displacement, ending the slow grind higher that had been in place since the 9th of May. That channel served as a controlled environment for accumulation and small trend continuation, but the move we just saw confirms that the phase of balance has shifted into a clear retracement. The displacement candle was strong, clean, and aggressive, closing well outside the lower boundary of the channel and taking out multiple internal lows in the process. This wasn’t a weak break, it showed intent.
From a market structure standpoint, this confirms that short-term control has shifted to the downside. That move also left behind a visible Fair Value Gap just above current price, which is likely to act as a draw in the coming sessions. Unless that FVG gets reclaimed impulsively, this looks like the beginning of a deeper retracement.
Consolidation Structure
Prior to the break, BTC was building liquidity inside a clean ascending channel. The highs kept getting swept by small wicks, which hints at repeated inducement and short-term stop hunts. The final push into the top of the channel marked the last bullish attempt, and price immediately reversed after that sweep. The moment it broke structure with a high-volume bearish candle, the entire channel was invalidated and turned into supply.
We now have a clean CISD framework in play, price consolidated inside a channel, created inducement near the highs, triggered a stop hunt into the upper end of the range, and then dropped with strong displacement. That displacement not only broke structure but also left behind an imbalance that has yet to be filled.
Bullish/Bearish Scenarios
Right now, the short-term bias is bearish. The break of structure is confirmed, the Fair Value Gap is still open, and there is a clear inefficiency left behind. I expect price to revisit that gap and then reject to the downside again. That would complete the FVG retest leg and open the door for a move into deeper zones.
The next key area of interest is around the $100,000 mark, slightly below the current trading range. That level holds both technical and psychological weight. It lines up with a previous breakout zone, an unfilled imbalance, and likely a large pool of resting liquidity from retail long stops and institutional bids. If we reach that zone, I’ll be watching for signs of strength to suggest that this pullback was a liquidity grab before the next leg up.
If we do get that tap into $100K and price responds with bullish displacement from there, the bullish narrative would be back in play. That could easily form the base for a new impulse toward all-time highs. However, if $100K fails to hold and price pushes through without a significant reaction, then we’re dealing with a larger correction, and I’d expect continuation toward lower inefficiencies.
Price Target and Expectations
First, I expect a small leg up to fill the Fair Value Gap inside the broken channel structure. That area will act as the first test, and if price shows rejection there, I’m looking for continuation toward the $100,000 to $99,500 region. That zone aligns with a clean 1H imbalance and marks the origin of the last strong bullish expansion.
If BTC taps into that deeper imbalance and confirms a reversal with clear bullish intent, the stage will be set for a potential breakout into new all-time highs. That’s where I would expect stronger hands to step in and take control. The longer price holds above that $99k zone, the higher the odds we break past the previous high.
But if there’s no reaction and price bleeds through $99K, the bullish structure on the higher timeframes would be compromised, and the move could extend toward the mid-$90K range.
Current Stance
Short-term bearish, waiting for price to retest the FVG inside the previous channel. That will be the first key area where I expect a reaction. If the rejection confirms, I’ll be watching for signs of continuation into $100K.
Not interested in chasing price between levels. I’ll either look to short the FVG retest with confirmation or wait for the deeper tap into the $100K zone to look for a long setup. No trades in the middle, only acting at the extremes where the risk-reward makes sense.
Conclusion
This setup fits cleanly into a classic displacement narrative. Bitcoin broke out of structure with a high-volume move, left behind an FVG, and is now likely preparing for a short retrace before continuing lower. The $100K zone is the main area to watch — that’s where the next high-probability trade opportunity is likely to develop. If bulls defend that zone and we get bullish confirmation, the path to new highs is still intact. But if $99K fails, I’ll be sidelined and looking for the next major level.
The structure is clear, the inefficiencies are visible, and the plan is defined. Now it’s just about waiting for price to do its job.
___________________________________
Thanks for your support!
If you found this idea helpful or learned something new, drop a like 👍 and leave a comment, I’d love to hear your thoughts! 🚀
Make sure to follow me for more price action insights, free indicators, and trading strategies. Let’s grow and trade smarter together! 📈

Bitcoin – Price Hits $100K, Will It Hold or Dive Into Demand?Bitcoin has officially reached the long-anticipated $100,000 mark, sweeping the psychological round number and clearing out a major pool of liquidity sitting just above it. This move came off the back of a sharp and impulsive leg, likely fueled by both spot demand and late-stage FOMO-driven breakout longs. At the same time, short liquidations added fuel to the upside, pushing price rapidly through thin areas on the volume profile. This type of vertical movement typically doesn’t last long without some form of corrective structure, and now that the $100K level has been tagged and liquidity taken, we can reasonably expect a period of cooling off, either through time-based consolidation or a more price-based retracement.
Consolidation Structure
The move up left behind two significant fair value gaps (FVGs) on the 4H chart. The first sits just beneath current price and represents the immediate imbalance created by the impulsive breakout candle. This is the shallowest inefficiency and would be the first area to watch for a potential short-term reaction. The second FVG lies deeper and overlaps perfectly with the 0.618 to 0.65 Fibonacci retracement zone, the golden pocket. This deeper zone is structurally more important, not only because it aligns with the golden pocket ratio but also due to its proximity to the high-volume node clearly visible on the Volume Profile (VRVP). Below this zone, there’s a strong base of support built from the previous consolidation area, making it a prime candidate for a bounce if tested.
Bullish/Bearish Scenarios
Scenario 1: In the bullish continuation case, Bitcoin retraces slightly to fill the shallow FVG just beneath $99K. A clean reaction there, especially if backed by strong volume and low timeframe bullish structure, could lead to a resumption of the trend with a fresh leg upward. This scenario assumes that the current breakout is being respected by the market and that participants are eager to front-run deeper entries. If this plays out, we’d expect a relatively quick reclaim of $100K, potentially building a new higher-low formation before continuing into uncharted territory above $102K.
Scenario 2: The second and more complex scenario involves a deeper retracement toward the lower FVG and golden pocket, between roughly $96.2K and $95.2K. This would constitute a cleaner reset of the recent move and allow the market to shake out weak longs who entered during the euphoric breakout. It also opens the door for a possible inducement setup, drawing in early sellers only to reverse at a key confluence zone. The golden pocket, combined with the high-volume node just below, makes this a high-probability demand zone. If we see bullish SFPs, displacement candles, or lower timeframe market structure shifts from there, it would be a strong long entry zone for a reattempt at the highs.
Price Target and Expectations
If Scenario 1 plays out, we can expect price to reclaim the $100K level fairly quickly, with upside potential toward $102K to $103K in the near term. The risk here is limited, given the shallowness of the retracement, but continuation would likely be more gradual and grindy due to the lack of a proper reset. If Scenario 2 plays out, the bounce from the golden pocket could produce a much healthier structure for further upside, and in that case, targets beyond $104K become more viable. The lower retracement would offer a better R/R and allow the market to rebuild momentum organically.
Current Stance
Right now, we remain bullish on the higher timeframes, but recognize the need for a local correction. We’re not interested in chasing the breakout blindly, the move has already cleared a major liquidity level and needs to rebalance before any sustainable continuation. We’re watching both FVGs closely. If the first one fills and holds, we’ll look for signs of strength and continuation. But if price breaks deeper, we’ll shift our focus to the golden pocket and bottom FVG as the more attractive long entry. Below that, the VRVP shows thick support, so our bias remains bullish unless we get a confirmed breakdown beneath that base.
Conclusion
Bitcoin has done its job in tagging $100K and clearing the obvious liquidity pool above. What comes next is all about how the market digests that move. Either we get a shallow retracement into the first imbalance and continue higher from there, or we go deeper into the golden pocket and establish a more meaningful base. Both scenarios still lean bullish, the key is patience and waiting for the right structure to develop. There’s no need to force entries here. Let price come to your levels, wait for confirmation, and take the trade when the setup aligns.
___________________________________
Thanks for your support!
If you found this idea helpful or learned something new, drop a like 👍 and leave a comment, I’d love to hear your thoughts! 🚀
Make sure to follow me for more price action insights, free indicators, and trading strategies. Let’s grow and trade smarter together! 📈

BITCOIN → Consolidation before the rally. 106K - 110K?BINANCE:BTCUSDT , after breaking out of consolidation at 97,860 and distributing to 104,300, has returned to a consolidation phase, which is generally a positive sign for possible continued growth.
The growth of Bitcoin is linked to several reasons:
General improvement in the global market situation — easing of trade conflicts; Expectations of a US Fed rate cut; Influx of investment into Bitcoin ETFs
Technically , we see the price breaking out of its local downtrend and entering a strong distribution phase. The northern train continues to pick up passengers.
At this stage, I would like to draw your attention to the consolidation at 104300 - 102300. A rebound from resistance is currently forming, and we need to monitor the levels of 103300 - 102300 - 101700. These are quite important areas of interest. A false breakdown (liquidity capture) may form before further growth. A return to resistance and the formation of pre-breakout consolidation, for example between 104300 and 103300, will only increase the chances of a breakout of resistance and growth to 106-107K.
Resistance levels: 104300
Support levels: 103300, 102300, 101700
The trend is bullish, with Bitcoin consolidating. The coin is not going to fall (at the moment), but to build up potential, the price may form a false breakdown of support (a deceptive maneuver) before continuing to rise. Retesting the 104300 level could lead to a breakout and upward distribution.
Best regards, R. Linda!

BTC Approaches All-Time High — But Signs of Weakness Emerge!BTC is once again approaching its all-time high (ATH) on the daily timeframe, generating excitement across the market. However, a closer look at the lower timeframes reveals signs of potential exhaustion as BTC encounters strong resistance. This suggests a pullback could occur before any continuation higher.
On the 4-hour and 1-hour charts, BTC is currently trading within a rising channel, which is often considered a bearish continuation pattern, especially when it forms directly below a key resistance level like the ATH. Price action within this structure is starting to lose momentum, and the presence of bearish divergences and decreasing volume further supports the likelihood of a near-term correction.
Where Could We Buy the Dip?
A pullback may offer a strategic entry opportunity for traders looking to ride the next leg up. Notably, two fair value gaps (FVGs) were created during the recent upward move. The first FVG could provide a minor bounce, but the second one is more compelling for a higher-probability long setup.
This second FVG aligns with a well-established support zone and coincides with the Golden Pocket of the Fibonacci retracement (between the 0.618 and 0.65 levels). This confluence of technical factors makes it a strong area of interest for bulls, and a potential springboard for price to retest, and possibly break, the ATH.
In summary, while BTC is showing strength on the higher timeframes, lower timeframe patterns suggest that a healthy correction is likely. Patience and proper level selection will be key. Watching how price reacts around the second FVG and the Golden Pocket zone may present one of the best opportunities for re-entry.
-------------------------------
Thanks for your support.
- Make sure to follow me so you don't miss out on the next analysis!
- Drop a like and leave a comment!
BITCOIN - Price can correct to support line of rising channelHi guys, this is my overview for BTCUSDT, feel free to check it and write your feedback in comments👊
Some days ago, the price entered a triangle, where it dropped to the support line, after which it rose briefly to the resistance line.
Then, price exited from the triangle pattern and made a retest at once, after which it corrected $81500 level.
Next, price some time traded near this level and later fell below, but soon turned around and started to grow inside a rising channel.
In channel BTC broke the $81500 level and later rose to the $93000 level, which broke soon too, and then made a retest.
Later price bounced and continued to grow, and now it trades near the resistance line of a rising channel.
Possibly, BTC can grow a little more and then make a correction movement to $99000
If this post is useful to you, you can support me with like/boost and advice in comments❤️

BTC Bullish continuation in progressThis formation is one to keep close watch on. The market has printed a well-defined Inverse Head and Shoulders (ISHS) pattern with a clean breakout above the neckline. The breakout was followed by a classic bullish pennant, which perfectly retested the neckline zone—now acting as a strong support base.
The resulting bounce has been impressive, driving price toward the previous All-Time High (ATH). A confirmed breakout above that ATH will likely validate a powerful continuation phase, with the next key target projected around $138,000 and beyond as outlined on the chart.
The structure remains technically sound, and price action continues to favor bulls as long as the neckline holds.

BTC - Bulls vs Bears! Who will win?current market context
the chart displays btcusdt on the 1-hour timeframe, currently in a consolidation phase following a strong impulsive move to the upside. this phase is characterized by a range-bound price action forming a horizontal channel, with clear resistance near the top of the range and support near the bottom. the price is fluctuating between these two levels, indicating temporary equilibrium in the market where neither buyers nor sellers have established dominance.
consolidation structure
this range is acting as a reaccumulation zone, typically formed after a significant move when the market pauses to either absorb liquidity or distribute orders before the next impulsive leg. within this range, traders are positioning themselves for a potential breakout, and institutional players may be accumulating or offloading large positions depending on market intent. the balance within the range suggests that market participants are awaiting a catalyst before committing in size to a direction.
bullish breakout scenario
if price breaks above the range high, it would signal bullish continuation. such a breakout would likely occur with increased volume and a strong momentum candle, confirming buyer interest and initiating an expansion move. this move could target new highs, potentially opening the path toward all-time highs as the breakout clears short-term liquidity and invalidates local bearish structures. the green projection on the chart visually outlines this potential path, where the breakout leads to higher prices with minimal resistance above.
bearish breakout scenario
alternatively, a breakdown below the range low would indicate a shift in short-term market sentiment and a break in bullish structure. this scenario would likely trigger sell-side liquidity and initiate a quick move toward lower fair value gaps. these gaps, left unmitigated during the previous bullish rally, now serve as potential targets for price to fill. the red arrow illustrates a scenario where price pierces below support, accelerates lower, and seeks inefficiencies and demand zones around the \$98,000–\$95,500 levels. this breakdown would likely be sharp, driven by stop-loss triggers and sell-side imbalances.
range as a decision zone
the current structure represents a critical decision zone. the upper and lower boundaries are pivotal breakout levels, and the outcome of this consolidation will determine the short- to medium-term market direction. traders should exercise caution while price remains within the range, as fakeouts or liquidity sweeps are common near such levels. confirmed structure breaks and volume surges should serve as validation tools before entering directional trades.
liquidity and volume considerations
liquidity resting above and below the range acts as fuel for the eventual move. the longer the range holds, the more liquidity builds on either side, increasing the probability of a strong expansion when price finally breaks out. volume analysis will be key in validating the breakout’s legitimacy—without accompanying volume, the breakout could fail and result in a false move or whipsaw.
summary
this setup provides a high-probability environment for breakout traders and those waiting to trade the trend continuation or reversal. the market is compressing within a well-defined range, and a decisive breakout is likely imminent. preparation, not prediction, is the priority—wait for confirmation of structure shift and volume expansion before committing to either side.

Bitcoin - Is It Possible to Test the ATH Once More?The weekly structure on Bitcoin remains firmly bullish. After consolidating below major resistance through much of 2024, price finally broke out decisively in November 2024, triggering a clean impulsive move that led to a new all-time high in January 2025. That breakout was significant, not just a short-term spike but a structural shift that confirmed long-term bullish momentum.
Since then, Bitcoin pulled back in a controlled and clean fashion, retesting the same zone that initiated the breakout. This type of price action, revisiting the origin of displacement and holding above it, is classic trending behavior and shows that the market still respects the bullish order flow.
Consolidation Structure
The zone that once acted as resistance has now flipped into support. Price dipped into the weekly candles that caused the breakout and closed above them, showing that buyers are still in control. That area also aligned with a fair value gap, giving additional confluence. The reaction out of this zone was strong, confirming it as a valid demand level.
Since that retest, we’ve seen another leg up, and now a new weekly fair value gap has formed just beneath the current price. I’m watching that imbalance as a potential short-term pullback area, and ideally, I want to see price fill it to around the 50 percent level before continuing higher.
Bullish/Bearish Scenarios
The bullish scenario remains valid as long as Bitcoin continues to hold above the previous breakout zone. I’m expecting a pullback into the newly formed fair value gap, ideally down toward $89,000, which marks the 50 percent line of the imbalance. If price taps that level and begins to bounce, that would be a potential signal for continuation toward the highs.
The bearish scenario only comes into play if price breaks back below the original breakout zone, invalidating the structure and showing weakness across the weekly levels. As long as we stay above that structure, there’s no reason to fade the trend.
Price Target and Expectations
Main expectation is a healthy pullback into the $89,000 zone to partially fill the new weekly imbalance. From there, I’ll be watching for signs of strength such as bullish engulfing candles or strong closes above the midrange of the gap. If buyers show up there, the logical next step is another attempt at the all-time high.
The ATH remains the key target for this leg, and that’s where I’ll be looking to take partial profits or reduce risk depending on how price behaves near that zone.
Current Stance
Still leaning bullish. Structure is clean, key levels are being respected, and the market has shown a clear tendency to react from weekly imbalances. I’m not chasing price into highs, but I am interested in the 89K region as a potential re-entry zone. If price gives a clean reaction there, I’ll be looking to scale in or add to existing positions.
NEWS TOMORROW
Keep in mind that FOMC is scheduled for tomorrow, which could bring a wave of volatility across all risk assets. That might trigger wicks or erratic price action even if the higher timeframe trend remains intact. Manage risk accordingly, don’t overreact to the first move, and stay focused on the weekly structure. As long as the market respects it, this still looks like a setup that wants to reach for the ATH once more.
Conclusion
Bitcoin broke out in November 2024, reached a new ATH in January 2025, and has since pulled back to retest the zone that caused the breakout. That retest held perfectly and has now led to another move higher. With a new weekly gap in play, I’m watching for a 50 percent fill around 89K before the market potentially gears up for another attempt at the highs.
___________________________________
Thanks for your support!
If you found this idea helpful or learned something new, drop a like 👍 and leave a comment, I’d love to hear your thoughts! 🚀
Make sure to follow me for more price action insights, free indicators, and trading strategies. Let’s grow and trade smarter together! 📈

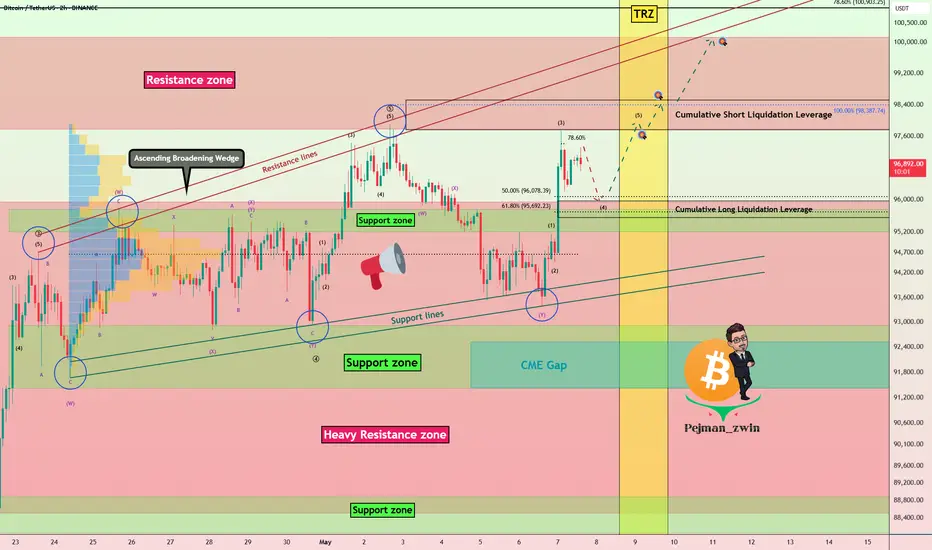
Bitcoin Breaks Heavy Resistance Zone— But Can It Hold?Bitcoin ( BINANCE:BTCUSDT ) started to rise yesterday as the S&P 500 Index ( FOREXCOM:SPX500 ) opened and it seems like it can break the Heavy Resistance zone($95,950-$88,500 ) this time, but there are still concerns from a technical analysis , so please stay tuned for this analysis .
Bitcoin is moving near the Resistance zone($100,200-$97,700) and has broken through the Heavy Resistance zone($95,950-$88,500) with good momentum .
In terms of Elliott wave theory , it seems that Bitcoin has completed microwave 3 near the Resistance zone($100,200-$97,700) and we should wait for the completion of microwave 4 . The microwave 4 can be considered a pullback to the Heavy Resistance zone($95,950-$88,500 ).
I expect Bitcoin to drop to at least $96,000 and is likely to touch the Support zone($95,760-$95,200) and start rising again, since microwave 3 was with high momentum , it is possible that microwave 5 will even be truncated . The targets I have indicated on the chart can be the target of a long position .
If you are looking for a Bitcoin reversal, you can focus on the Time Reversal Zone(TRZ) . The next major pivot will likely be within this time zone .
It seems reasonable to open a Long position near the Support zone($95,760-$95,200) , and it can give us a good Risk-To-Reward . What do you think?
----------------------------------------------------
My concerns for Bitcoin's continued bullish trend:
Because Bitcoin's correlation with US stock market indices , especially the SPX500 , is higher than in previous weeks, my analysis is that there is a re-correction in the SPX500 index , which could prevent Bitcoin from continuing its upward trend .
The Ascending Broadening Wedge pattern is likely to complete, which could cause Bitcoin to fall further if the lower lines of this pattern are broken.
If tensions between Pakistan and India increase, it could prevent Bitcoin from growing further.
----------------------------------------------------
Also, Today, the Federal Funds Rate is scheduled to be announced.
Let’s take a look at how this decision — along with Powell’s speech — might impact Bitcoin . Be cautious with your positions during the announcement and Powell’s remarks, as markets may become volatile.
Holding the rate steady is a signal of monetary policy stability, which could give risk assets like Bitcoin some breathing room in the short term.
Given recent U.S. economic data, markets are mainly focused on Powell’s tone during the press conference. If he adopts a dovish stance (hinting at potential rate cuts), this could support Bitcoin’s upward momentum.
However, if Powell emphasizes that rates will remain elevated for an extended period, we might see a temporary wave of selling pressure in the market.
Stay alert and manage your risk wisely — high-impact events like this can lead to sharp moves in crypto.
----------------------------------------------------
Cumulative Short Liquidation Leverage: $98,511-$97,774
Cumulative Long Liquidation Leverage: $95,966-$95,550
Note: If Bitcoin falls below $94,400, we can expect further declines.
Please respect each other's ideas and express them politely if you agree or disagree.
Bitcoin Analyze (BTCUSDT), 2-hour time frame.
Be sure to follow the updated ideas.
Do not forget to put a Stop loss for your positions (For every position you want to open).
Please follow your strategy and updates; this is just my Idea, and I will gladly see your ideas in this post.
Please do not forget the ✅' like '✅ button 🙏😊 & Share it with your friends; thanks, and Trade safe.
TradeCityPro | Bitcoin Daily Analysis #86👋 Welcome to TradeCity Pro!
Let’s move on to the analysis of Bitcoin and major crypto indices. As usual, in this analysis I want to review the futures session triggers for New York.
✔️ Yesterday the market made another bullish leg and has now reached the 103642 resistance. There’s a chance we might enter a correction phase because the move has been very sharp and I think the market needs a rest.
⏳ 1-Hour Timeframe
As you can see in the 1-hour timeframe, we had a bullish move that continued after a pullback to the 99337 zone, climbing all the way to 103642.
💥 The RSI trigger I gave you also got activated and yesterday you could open a momentum-based position. I personally already have a long on Bitcoin from near 88000, so I didn’t open another one yesterday.
⚡️ Currently, RSI is exiting the Overbuy zone, and if that happens, the chance of entering a correction phase increases. As long as the price is above 99337, the main market momentum is still bullish and we’re not confirming a trend reversal just yet due to this strong momentum.
📈 Over the past few weeks, I emphasized a lot that you should definitely have at least one long position open, and not to open short positions unless a trend reversal is confirmed. I hope you’ve used the analyses and opened proper positions on either Bitcoin or altcoins.
📊 Today, it’s a bit late to open new positions because I think the market has made its main move and now we’re waiting for a correction phase to start. However, if you don’t have a position, you can enter a very risky trade on the breakout of the 103642 level.
🚨 This position is very risky and I personally won’t open it because we’re near the ATH and I think even if Bitcoin moves up to 106247, it’ll likely take a breather and won’t go straight up.
🔼 In any case, if you want to open a long position, I personally suggest waiting for a new structure to form and then look for a trigger. Otherwise, the only current trigger we have is 103642.
📉 As for a short position, you definitely know by now that with this strong bullish momentum, I’m not going to give you a short trigger. You have to wait for a proper structure for short entries.
👑 BTC.D Analysis
Let’s go to Bitcoin dominance. Yesterday dominance finally made a bearish move. It was a very sharp and one-sided drop to the 63.61 level without any corrections.
🧩 Currently, dominance is very bearish and altcoins have moved up strongly. Especially Ethereum, which after a long time made a sharp bullish move. I think as the market starts to correct, dominance will also move up and correct.
⭐ For altcoin entries, I personally wait for dominance to make a short-term upward correction and if it continues the second leg downward, I’ll enter altcoins.
📅 Total2 Analysis
Let’s move on to Total2. This index also had a sharp bullish move and after breaking 1.05, it managed to climb to 1.17.
🔔 I’ve talked a lot about the 1.05 zone and repeatedly told you to make sure you have a long position if it breaks. With that trigger activated, the Total2 uptrend has started and reached the 1.17 resistance.
✨ Currently, the only available trigger is the breakout of the 1.17 zone, and if it’s broken, we can enter another position.
📅 USDT.D Analysis
Let’s move to USDT dominance. Yesterday the 4.82 trigger was activated and dominance continued to fall. I also emphasized the 4.99 breakdown a lot and once again, I hope you’ve used the analysis and opened a position.
👀 Currently, the price has reached the 4.65 zone, which is very important and could trigger a correction. But if this zone breaks, we can open short positions.
💫 Overall, today if you notice, all the charts we analyzed seem to have made enough moves and now it’s time for a correction. However, if their triggers are activated and you don’t already have a position, you can still enter.
❌ Disclaimer ❌
Trading futures is highly risky and dangerous. If you're not an expert, these triggers may not be suitable for you. You should first learn risk and capital management. You can also use the educational content from this channel.
Finally, these triggers reflect my personal opinions on price action, and the market may move completely against this analysis. So, do your own research before opening any position.

BTC – Liquidity Sweep, Fair Value Gap Reactions & Potential LongMarket context and structure
This BTCUSDT 1-hour chart from BYBIT illustrates a methodical transition from a phase of consolidation to bullish expansion, guided by smart money principles. Price initially consolidates beneath a well-defined resistance level, with an Imbalance Fair Value Gap (IFVG) forming inside the range. This IFVG signals an inefficient zone where institutional players may be positioned. The eventual breakout above this range indicates a structural shift and the beginning of a directional move, setting the stage for further bullish development.
Break of structure and liquidity sweep
Following the breakout, BTC sweeps the buy-side liquidity resting above a prior swing high. This liquidity grab is a common maneuver in smart money trading, designed to trigger stop orders and breakout entries to facilitate larger institutional fills. The aggressive price movement results in the creation of several Fair Value Gaps (FVGs), which are regions where price moved with such momentum that no overlap between candles occurred. These FVGs are crucial areas of interest where future re-entries or continuations might originate.
Fair value gaps and demand zones
The chart highlights multiple FVGs formed during the bullish impulse. The uppermost FVG, located just below the most recent liquidity sweep, acts as a shallow retracement zone and has already been partially mitigated. A mid-range FVG extends further down, providing a secondary support layer within the current price structure. The largest and deepest FVG lies closer to the breakout origin and represents a significant unfilled demand zone. These FVGs help to outline institutional footprints, revealing where unfulfilled orders may still reside and where price might return to rebalance.
Re-entry strategy and projection
An ideal re-entry area is labeled “Entry at IFVG,” situated near the recently swept liquidity. The projection suggests that price may retrace slightly into this IFVG, consolidate, and then continue its upward trajectory. This anticipated movement reflects a bullish continuation pattern rooted in the idea of reaccumulation, where price revisits areas of imbalance before pushing higher. The visual path drawn on the chart captures this idea, showing a measured retracement followed by a continuation of the trend.
Interpretation and tactical bias
The overall structure and price behavior support a smart money-based bullish outlook. The clean break of structure, the successful sweep of liquidity, and the presence of multiple fair value gaps provide a foundation for continued upside potential. Price respecting these imbalance zones on pullbacks reinforces demand and highlights ongoing institutional involvement. This setup encourages a patient, context-aware approach to trading, focusing on inefficiencies, order flow, and the narrative of price rather than arbitrary indicators.

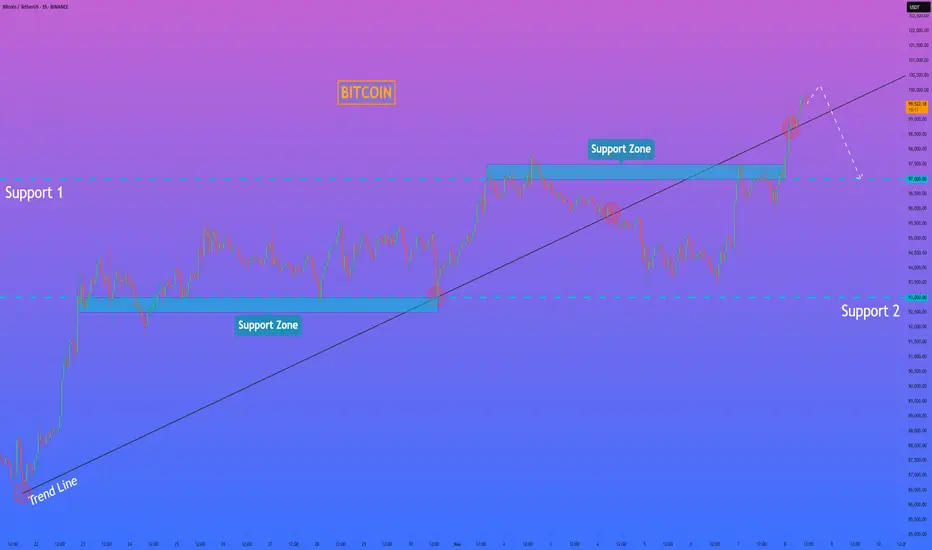
HelenP. I Bitcoin can break trend line and fall to support levelHi folks today I'm prepared for you Bitcoin analytics. After a strong rally, зкшсу has reached a critical zone, and the reaction here might become a key pivot for short-term price action. Price managed to break above the ascending trend line, but instead of continuation, we saw a clear rejection from the 99500 area, followed by a sharp drop back below the trend structure. This type of movement often indicates bull trap behavior. Breakout traders enter on momentum, but then get squeezed as the price fails to hold above the trend. At the same time, buyers are beginning to lose control, and sellers are regaining initiative near major resistance. Importantly, BTC is now pulling back toward a support zone between 97500 and 97000, which previously acted as a base for consolidation. If this level fails to hold, the next support lies around 93000, where the trend originally started. The structure is shifting. A trend line break followed by a failed retest often signals a trend reversal or, at least, a deeper correction. I expect BTCUSDT can drop to the 97000 level, breaking the trend line. If you like my analytics you may support me with your like/comment ❤️
BTCUSDT Non stop pumping (Soon or late another ATH cooking)As we can see price is near ATH resistance zone and we are looking for maybe a short-term correction and rest and soon after that more pump here is expected like green arrows and even breakout of ATH and new ATH like 113K$ or 120K$ is cooking for next two months.
DISCLAIMER: ((trade based on your own decision))
<<press like👍 if you enjoy💚

BTC Maintains Strategic Bullish Structure New ATH Still insightHello Traders and Crypto Enthusiasts! 👋
I'm excited to share a detailed analysis of Bitcoin (BTC) on its ongoing bullish structure, maintaining higher highs and higher lows. This chart captures the key support zones, demand areas, and chart patterns that underpin our optimistic outlook. Let’s dive deep into the technical narrative.
Bitcoin continues to respect a clearly defined bullish market structure on the weekly timeframe. The price action has persistently printed higher highs and higher lows, maintaining upward momentum within a dominant ascending channel. This behavior reinforces the ongoing bullish narrative, as buyers have repeatedly stepped in at logical demand zones to defend structure.
The immediate demand zone between $71,300 and $78,300 has acted as a critical launchpad for price. As long as this region holds on a weekly closing basis, the probability of continuation remains elevated.
A clean break above the $109,588 resistance , marking the previous high—would likely act as a technical trigger for further upside acceleration, with the projected price target standing at $140,998. This level is derived from a measured move extension based on prior impulsive legs within the channel, reflecting a symmetrical and organic expansion of market structure. This almost projected same as one of our previous analysis.
Key support remains layered across multiple zones. The internal demand zone around $48,800 to $54,500 represents a structural pivot level. Below that, the extreme support zone near $27,900 and the foundational base zone between $15,500 and $17,765 provide deep support from earlier cycle lows. These levels are unlikely to be revisited unless a significant macro reversal occurs, something not currently evidenced in the chart.
The preservation of trendline support, coupled with repeated bullish rejections from higher lows, confirms that market psychology remains tilted in favor of the bulls. Sellers have yet to invalidate any critical higher low, indicating the uptrend is not only intact but maturing toward another expansion phase with potential ending diagonal in view.
With the current projection and structural alignment, the bullish thesis remains valid as long as Bitcoin sustains weekly closes above the $78,300 zone. A failure to hold that level could lead to a re-evaluation of this outlook. Until then, structure governs sentiment and right now, the structure is still decisively bullish.
Stay disciplined, manage your risk, and watch for confirmation signals as Bitcoin continues its upward journey. 🚀
Let's keep the discussion alive — share your thoughts, setups, and predictions below!

After $105K Peak, Bitcoin May Revisit 0.382 FOB Level!CRYPTOCAP:BTC is pulling back after hitting a high of $105,800
If you look at the daily chart, we haven’t seen any healthy pullback, the price has gone straight up.
In my opinion, a retest of the 0.382 FOB level around $94K would be a healthy correction for Bitcoin. Based on the liquidation heatmap, we’re also seeing liquidity building up at lower levels.
This is one of the signs of a pullback, which is important for a sustainable and healthy market.
Stay tuned and follow for more updates!
