BTC Breaks 95K — What's Next?Bitcoin has finally broken above the tough resistance level at $95,000 , a level we’ve struggled to conquer for the past 15 days. It's now trading around $96,800 , and the bullish momentum appears to be building.
I believe this momentum could carry the price beyond GETTEX:97K – GETTEX:98K , potentially leading us to the next major resistance zone at $100,000.
However, $100K won't be easy to break. Expect significant profit-taking around that level, as we’ve seen in the past. Our previous failure to break above it led to a bloody market throughout 2024. While this time could be different, remember: $100K is a massive resistance wall.
Altcoins, meanwhile, have lost a bit of momentum, as capital has been flowing steadily into BTC. As Bitcoin gains strength and dominance, altcoins are temporarily being pushed to the sidelines.
But don’t lose hope— incredible altcoin opportunities are coming soon.
Stay tuned.
BTCUPUSDT trade ideas
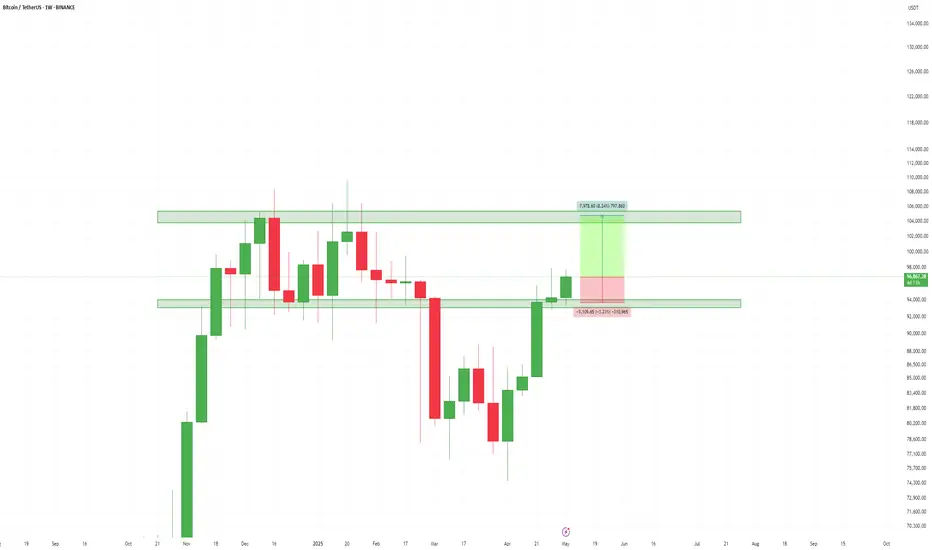

Bitcoin / US Dollar Analysis mid TermI've intoduced a good Demand area in 92800-94350 which has reacted well .
It's Target would be a good Supply are for sellers. which is 95600-95800.

BITCOIN CHARTBTC weekly chart exposed the demand and supply phase of the price movement and we quickly aligned with price movement until genuine buy confirmation is complete. The crypto tax gains is coming and regulatory inspection certain, as strict compliance from all brokers will be unavoidable.
4hrs makes it easy as one more break of demand floor will be a sell confirmation, don't rush yet.

TradeCityPro | Bitcoin Daily Analysis #79👋 Welcome to TradeCity Pro!
Let’s dive into Bitcoin and key crypto index analysis. As usual, in this analysis, I’ll walk you through the futures session triggers for the New York session.
⏳ 1-Hour Timeframe
On the 1-hour timeframe, as you can see, yesterday the price stabilized above the 95370 zone and continued its movement up to 97139.
✔️ The reason the price couldn’t move higher is that the RSI failed to stay above the 70 level and didn’t enter the Overbuy zone — it got rejected there. As a result, the price also got rejected from the 97139 resistance and is currently in a corrective phase.
🧩 The SMA25 indicator has now caught up to the price, and this could bring upward momentum into the market. If that happens, the price might resume its upward move, and breaking the 97139 high could lead to a continuation toward the 98828 zone.
📊 Volume increased during the bullish candles, but after reaching the 97139 high, volume returned to previous levels, and the price has been ranging.
⚡️ Today, if RSI enters the Overbuy zone, a bullish move is very likely — in that case, I recommend definitely holding a long position.
🔽 As for short positions and bearish sentiment on Bitcoin, as I’ve been saying for a while, we should wait for a proper trend reversal before entering short trades.
📈 If the price doesn’t respond to the SMA25 and keeps ranging, the next parameter that could drive bullish momentum is the SMA99.
👑 BTC.D Analysis
Moving to Bitcoin Dominance — BTC.D is still trending upward. Yesterday, after breaking the 64.72 ceiling, it started a new bullish leg, and so far, there’s no sign of trend weakness.
🎲 I suggest waiting for a new structure to form. For now, it’s still rising, and if this continues, Bitcoin will likely outperform altcoins.
📅 Total2 Analysis
Looking at Total2, this index was rejected from the 1.05 resistance yesterday. The reason is that Bitcoin dominance surged, meaning not much money flowed into altcoins, and Total2 couldn’t break its ceiling.
🔼 If BTC.D reverses and pulls back, a lot of capital could move into altcoins — in that case, we can consider opening long positions on altcoins.
📅 USDT.D Analysis
Now to Tether Dominance — another reason Bitcoin couldn’t extend its bullish leg yesterday was this indicator. Support at 4.99 held, preventing money from entering the market, and causing the correction phase.
💫 Currently, the 4.99 level remains a crucial trigger. If it breaks, the main bullish trend in the market could begin. On the other hand, a break above 5.10 would likely push the market into a deeper correction.
❌ Disclaimer ❌
Trading futures is highly risky and dangerous. If you're not an expert, these triggers may not be suitable for you. You should first learn risk and capital management. You can also use the educational content from this channel.
Finally, these triggers reflect my personal opinions on price action, and the market may move completely against this analysis. So, do your own research before opening any position.

BTC/USDT Analysis: Is the Long Trend in Question?
Hello everyone! This is a daily update from a CryptoRobotics trader-analyst.
Last week, posts were not published every weekday due to holidays — but we’re back now.
Yesterday, Bitcoin reached a support zone. Signs of defense were observed, but so far, there has been no meaningful recovery.
In the current buy zone, the power balance remains even: on one hand, market buyers failed to resume the uptrend, but on the other, we noticed absorption of sell orders according to delta analysis.
At the moment, the buyer appears weak, so entering long positions is not advisable.
The main scenario remains bearish. In addition to the two scenarios described yesterday, a third one has emerged — a short entry from the current price.
Sell Zones:
$96,100–$96,600 (local volume area)
Level $98,000
$107,000–$109,000 (volume anomalies)
Buy Zones:
$95,000–$93,400 (accumulated volumes)
$91,500–$90,000 (strong buying imbalance)
$88,100–$87,000 (absorption of market selling)
$85,500–$84,000 (accumulated volumes)
$82,700–$81,400 (volume area)
Level $74,800
$69,000–$60,600 (accumulated volumes)
What scenario do you think is most likely?
Share your thoughts in the comments — it’s always interesting to compare perspectives!
This publication is not financial advice.

BTCUSD | Neutral Bias | Watching Value Area Retest | (May 5, 202BTCUSD | Neutral Bias | Watching Value Area Retest + Macro Confluence | (May 5, 2025)
1️⃣ Insight Summary
Bitcoin has been consolidating after sweeping liquidity around the $69K level. I'm currently not in a position, but closely monitoring for confirmation of direction as we approach key zones.
2️⃣ Trade Parameters
Bias: Neutral (waiting for confirmation)
Entry: Watching for a retest of the value area low
Stop Loss: Will be set once structure confirms
TP1/TP2: Will define after confirmation
Partial Exits: Based on price reaction at value area and confluence zones
3️⃣ Key Notes
✅ Lots of spot selling pressure currently—if it continues, lower prices are likely
✅ Still watching for potential bullish reversal structure for long-term upside (targeting $214K in long horizon)
✅ Correlation with S&P 500 is important here—SPX may push higher in coming weeks, especially as “sell in May” often applies to retail, while institutional flow tends to shift in June
✅ Watching the 7500 level on SPX as a possible reaction zone
❌ No confirmation yet—entering early could be risky
✅ Waiting for a clear market structure shift around value area support
4️⃣ Follow-up Note
I'll continue monitoring this setup and will post updates once we get a confirmation of direction or a structural break worth acting on.
Please LIKE 👍, FOLLOW ✅, SHARE 🙌 and COMMENT ✍ if you enjoy this idea! Also share your ideas and charts in the comments section below! This is best way to keep it relevant, support us, keep the content here free and allow the idea to reach as many people as possible.
Disclaimer: This is not a financial advise. Always conduct your own research. This content may include enhancements made using AI.

Bitcoin: $94K and Climbing!Price Movement and Technical Patterns
Bitcoin (BTC) is currently trading at $94,075 on the 4-hour timeframe, marking its highest level in over two months. This surge comes after a clean breakout above a key trendline, a move that often signals the start of a strong upward trend. Over the past few weeks, BTC has climbed 28% from its five-month low of below $75,000, hit on April 9, 2025. Right now, it’s testing a major resistance level near $95,000. On the 4-hour chart, you’ll notice a clear pattern of higher highs and higher lows, a textbook bullish setup. The price has also broken out of a falling wedge pattern, which is typically a reversal signal that points to more gains ahead. Support is holding strong around $80,000, while the price seems to be coiling between $82,000 and $86,000, hinting at a possible explosive move toward $100,000 if it breaks out of this range.
Market Context and External Influences
What’s driving this rally? A big part of it is the broader economic picture. With trade tensions and tariffs stirring up global markets, Bitcoin is stepping up as a safe-haven asset, much like gold, which has also been on a tear lately. Investors seem to be turning to BTC to hedge against uncertainty, and that’s pushing prices higher. On top of that, there’s some positive news in the crypto space: the Maldives just signed a $9 billion deal to build a crypto hub, which could spark more mainstream adoption and boost market sentiment. There’s also chatter about the U.S. possibly pausing tariffs, which might ease economic pressure and give Bitcoin more room to run. These factors combined are creating a pretty supportive backdrop for this price action.
On-Chain Data and Investor Behavior
Digging into the data, there’s more evidence that big players are betting on Bitcoin. Large investors, often called "whales," have been scooping up BTC at a rate three times higher than what miners are producing daily. This kind of accumulation mirrors what we saw during the 2020 bull run, right before prices took off. It’s a sign that these heavy hitters are gearing up for something big. The 4-hour chart backs this up with steady buying pressure and no major sell-offs yet. If this trend holds, and Bitcoin stays above its key support levels, we could see a push toward new all-time highs sooner rather than later. Keep an eye on that $95,000 resistance, it’s the next big test.
What to Watch For
So, where does Bitcoin go from here? The technicals are screaming bullish: the breakout, the higher highs, and the wedge pattern all point up. But it’s not just about the chart, external factors like economic shifts and crypto news will play a role too. If BTC can smash through $95,000 with solid volume, $100,000 comes into view fast. On the flip side, a drop below $80,000 could cool things off, though the whale buying makes that less likely for now. For traders, this is a spot to watch for a breakout or a pullback to scoop up a dip. Either way, Bitcoin’s got momentum, and the market’s buzzing with potential.

TradeCityPro | Bitcoin Daily Analysis #78👋 Welcome to TradeCity Pro!
Let’s get into the analysis of Bitcoin and key crypto indices. As usual, in this analysis I’ll review the triggers for the New York futures session.
⏳ 1-Hour Timeframe
As you can see in the 1-hour timeframe, Bitcoin is finally stabilizing above the 95,370 level. If this movement continues and the price stays above this level, the likelihood of a move up to 98,828 increases.
✔️ Over the past few days, I’ve strongly emphasized that you should open a position once 95,370 breaks. I hope you did, because that entry point was very significant, and breaking it could mark the beginning of Bitcoin’s next bullish leg.
💥 Currently, RSI is entering the Overbought zone, and if that happens, the chances of a sharp upward move increase. Buying volume is also rising, which is expected when a resistance level is broken.
📊 At the moment, opening new positions doesn't make much sense. If you already have an open position, I recommend riding the market momentum and taking profits whenever you notice momentum fading.
👑 BTC.D Analysis
Bitcoin dominance dropped slightly yesterday and returned below the 64.60 level. If this level is broken again, we can reconfirm the bullish sentiment.
🧩 If dominance gets rejected from the 64.60 ceiling, it’s likely to drop back down to the 64.22 support level.
📅 Total2 Analysis
Let’s look at Total2. Yesterday we saw a downward correction that extended to the 1.00 level. If you recall, I previously said I wouldn’t consider a trend reversal confirmed just from the 1.03 break — I’d wait for a break of the 1.00 support.
🔑 That’s why I didn’t close any of my positions at 1.03 and instead waited to see how the price would react at 1.00. As shown, the price reacted strongly at that level and quickly returned above 1.03.
✨ If the 1.05 level breaks, altcoins — just like Bitcoin — could begin a new bullish leg.
📅 USDT.D Analysis
Now let’s look at USDT dominance. Yesterday, it made a bullish move and broke above the 5.10 level, but the entire move turned out to be a fakeout, and the price dropped back below 5.10.
⭐ Currently, dominance is heading toward the 4.99 support. The main trigger for a bullish market shift is the break of this 4.99 level in Tether dominance. If this happens, altcoins will likely begin their bullish moves.
❌ Disclaimer ❌
Trading futures is highly risky and dangerous. If you're not an expert, these triggers may not be suitable for you. You should first learn risk and capital management. You can also use the educational content from this channel.
Finally, these triggers reflect my personal opinions on price action, and the market may move completely against this analysis. So, do your own research before opening any position.

Bitcoin Price Action Analysis – Bearish Correction Toward DemandHello Guys!
Let's analyze btc!
Rising Trendline Break: The bullish structure has broken down as the price failed to hold above the key support region around $96,000–$96,200.
Targeted Demand Zone: The highlighted purple box between $94,200 and $94,700 represents a demand zone that has previously shown strong buyer interest. The current structure suggests Bitcoin may revisit this zone for a potential bounce.
Bearish Momentum: A large arrow indicates the directional bias toward the downside, aligning with the correction and market sentiment.
Fake RSI Divergence: The RSI panel indicates a “Fake Divergence” pattern, which may have misled early bulls. RSI has since dropped and currently hovers in the neutral zone, with no strong bullish signals yet.
_____________________________
Conclusion:
Unless a strong bounce occurs around current levels, Bitcoin looks poised to correct further toward the $94,200–$94,700 demand zone. Traders should watch for reactionary price action and bullish reversal patterns before considering long entries.

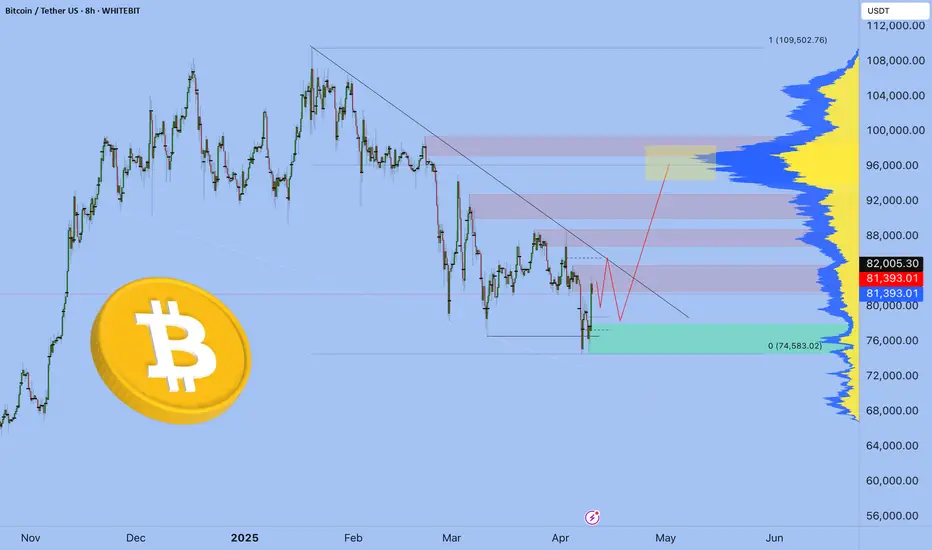
Bitcoin Buy Opportunity: Last Chance To Buy Below $100,000Bitcoin isn't trading at $78,800 nor $80,000 nor even $85,000 but still, even a small retrace is good to buy; even a small retrace is better to buy and enter a new trade than when prices are moving up.
A strong support range consisting from the lows of December 2024, January and February 2025 can be seen mapped on the chart. The lows on these date produced a support range between $89,250 and $94,250.
Bitcoin is now not trading within this range but if it does go there let me be the one to tell you that this would be an amazing entry zone and buy opportunity. This is marked green on the chart.
The truth is that when Bitcoin goes bullish it never looks back, it grows and grows and grows but, since we are set for the 2025 bull market and several new All-Time Highs, any retraces should be bought strong because there might not be another chance like this available.
Whenever the market goes red, that's the time to buy strong, go LONG and prepare for the continuation of the bullish trend.
Whenever the market turns green, we just let it grow and secure small portions of profits when resistance is hit. Rinse and repeat.
Right now Bitcoin is red but it won't be red for too long. See the trade-idea below to understand how Bitcoin will behave around this resistance zone:
It is the inverse image of the February drop. It will range a few days around this zone and then produce a very strong advance. This is your last chance to accumulate below 100K while Bitcoin is still low.
Once Bitcoin moves above 100K, 90K is gone. Just like $75,000, it is gone for this entire cycle. Just like $80,000, you cannot buy at $80,000 anymore. The same for $85,000 or anything below 90K.
This is the last chance to buy Bitcoin below $100,000 before the continuation of the bullish trend. This opportunity can remain open for a few more hours just as it can last a few days. But it won't be available for too long. Make your decision now, Crypto is going up.
Thanks a lot for your continued support.
Namaste.

BTC LONGA beautiful pullback to the 0.618 Fibonacci level is possible, right before the CME market opens. This could present a potential long entry opportunity.

Bitcoin Technical Analysis: Bearish Continuation with $95,200 TP
Looking at the Bitcoin/TetherUS chart from TradingView dated May 3, 2025, I can see a clear short-term bearish trend forming with several notable technical patterns.
The price is currently around $96,158.01, showing a decline of -0.17% with a volume drop of -0.75%. Let me correct my analysis for a short position:
KEY Technical Observations
- A descending channel has formed after rejection from the $97,200 resistance level
- Price is breaking down from a consolidation area around $96,327-$96,419
- The green shaded area indicates a projected downward movement targeting $95,349.80
- Consecutive red candles with increasing body size suggest accelerating bearish momentum
Trading Opportunity - SHORT POSITION
This setup presents a bearish continuation pattern with the following take-profit targets:
- TP1: $95,800 (initial target within the projection)
- TP2: $95,350 (projected bottom as indicated by the green zone)
- TP3: $95,200 (key horizontal support line)
Entry point for shorts would be on any retest of the $96,327 resistance (previous support now turned resistance).
Creative Strategy: The Emerald Descent
The green projection zone appears to be forecasting a controlled drop toward the $95,200-$95,350 area. This well-defined bearish channel presents an opportunity to ride the momentum down to these targets.
Set a stop loss above $96,600 to protect against unexpected upside movements.
The declining volume (-0.75%) suggests this move is a continuation rather than a panic sell, making it a more predictable technical play rather than an emotional reaction.


A massive f-you move from BTC....??Takes out the relative equal lows of Monday's range.
Bulls get wiped out.

BTC - The Perfect Retest!Hello TradingView Family / Fellow Traders! This is Richard, also known as theSignalyst.
The picture says it all!
🔄Is history about to repeat itself?
If so, we are currently in Phase 2. 📈
What’s next? A dip toward the $87,000 - $88,000 zone would be the perfect retest to look for trend-following longs and expect the start of Phase 3.
📚 Reminder:
Always stick to your trading plan — entry, risk management, and trade management are key.
Good luck, and happy trading!
All Strategies Are Good, If Managed Properly!
~Rich

Bitcoin Range-Bound in Heavy Resistance – CME Gap Still Open!Bitcoin ( BINANCE:BTCUSDT ), like Gold , has been moving in a Range for the past 5-6 days and is currently in a Heavy Resistance zone($95,950-$88,500) , as it has been in the past few days .
In terms of Elliott Wave theory , Bitcoin appears to be completing a main wave 4 . The main wave 4 structure can take two forms: Double Three Correction(WXY)_Expanding Flat(3-3-5) .
I label this analysis " Short " for the following reasons:
Due to Bitcoin's higher correlation with the S&P 500 Index ( SP:SPX ) these days, I am short on the S&P 500 Index.
China’s president Xi Jinping says Trump lied about them having a phone call ; it is NOT good news for the S&P 500 Index and Bitcoin .
CME Gap($92,525-$91,415) has NOT filled yet, and I think Bitcoin will NOT start the next bullish rally before filling the CME Gap.
I expect Bitcoin to drop to at least $92,830 and then decline to the Support zone($92,000-$91,400) if the Support lines are broken.
Cumulative Short Liquidation Leverage: $96,741-$95,520
Note: If Bitcoin can touch $97,000, we should expect more pumping.
Note: If Bitcoin goes below the 100_SMA(Daily), we should expect a fall.
Please respect each other's ideas and express them politely if you agree or disagree.
Bitcoin Analyze (BTCUSDT), 1-hour time frame.
Be sure to follow the updated ideas.
Do not forget to put a Stop loss for your positions (For every position you want to open).
Please follow your strategy and updates; this is just my Idea, and I will gladly see your ideas in this post.
Please do not forget the ✅' like '✅ button 🙏😊 & Share it with your friends; thanks, and Trade safe.

Bitcoin is poised for a 95K breakout. 100K target?After a fairly rapid growth (rally) bitcoin did not correct, the price could not reach 0.382 within the local correction, the range is squeezed between resistance and 0.236, which indicates a bullish interest in the current situation
The price has been in consolidation for the last 4-5 days. This is enough to break the resistance at 95600 and give us a good momentum.
Scenario: If bitcoin continues to slowly and gradually approach the 95600 resistance, there is a high probability of triggering a crowd when the resistance is broken, which will push the price to 100K.

Bitcoin update 10.04.2025 - BTC - 98k in May🔥 The Markets Are on Fire — and We Know Who Lit the Match.
The last few weeks have been pure chaos.
Markets are crashing, confidence is shaking, and crypto is confused.
And let’s not pretend we don’t know who’s behind it.
Donald Trump.
Even a Korean guy selling panda souvenirs on the street told me:
“This Trump is ruining everything.”
And he’s not wrong.
Billions wiped. Positions wrecked.
But here’s the thing — this isn’t random. This is tactical drama.
Trump sees himself as a master negotiator, and here’s how he plays the game:
🎭 The Trump Cycle (Get Ready for the Loop)
Pressure — tariffs, chaos, media hysteria. We’ve seen it.
Relaxation — 90-day delays, fake calm.
Talks — and boom, “positive developments.”
Good News —
• “Bitcoin added to U.S. reserves.” in MAY?
• “Americans to receive new stimulus.”
• “China’s our friend again!”
Charm & Flirt Mode — improving global relations, smiling at cameras.
More good news — stock markets fly, crypto rips and everyone screams, “New bull run!”
And then?
💥 Back to pressure.
📆 September 2025 is the punchline.
That's when this cycle hits the weaker economies like a freight train:
✅ Broken supply chains
✅ Collapsing currencies
✅ Defaults
✅ And where there’s chaos — there’s war. Expect escalation in fragile regions like the Middle East.
✅ Crude oil falling to 40$
Markets will top on pure euphoria.
The reversal begins when everyone’s drunk on hopium and “good news”.
💼 My Plan? Ruthlessly Simple:
🔹 May I will participate in the first Offline/Online International Crypto Trading Cup 2025 by WhiteBIT
🔹Jun-August -Euphoria in the market
🔹 September - Take profits
🔹 Either short — or sip something cold on a quiet beach. But we will see
We’ve officially entered the Turbulence Zone.
The following 10 years will be insane — for those who adapt, evolve, ride the trends, and harness AI and tech.
If not?
You get left behind.
It’s not the strongest who survive — it’s the fastest to adapt.
Best regards, EXCAVO
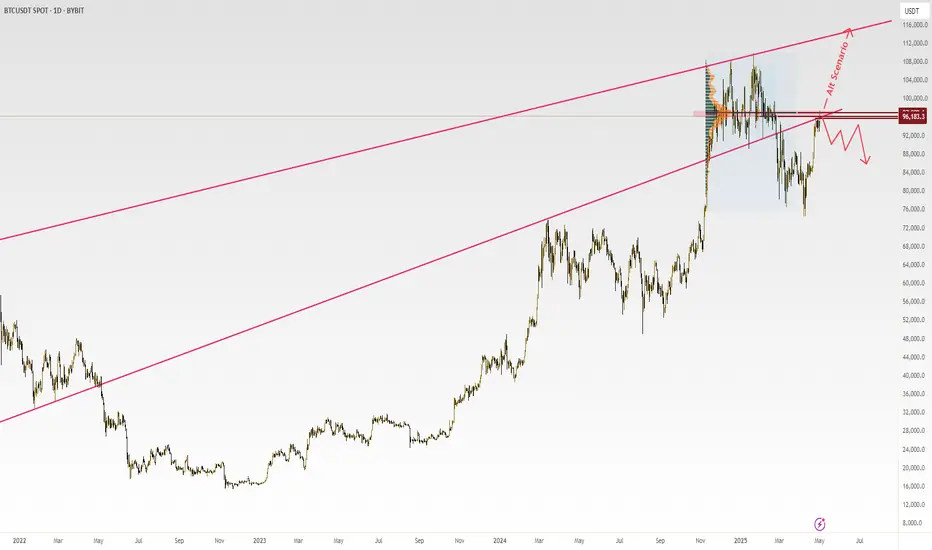
Bitcoin is at a critical decision pointBitcoin:
Currently, Bitcoin is at a key resistance zone around the $97,500 level, which holds significant technical importance as it has acted as a price barrier multiple times in the past. In a bullish scenario, if Bitcoin manages to decisively break through this resistance and stabilize above this level, a strong upward movement could begin. With increased trading volume and buyer support, the price could target the next level at around $115,000. This scenario is particularly likely if positive fundamental factors, such as favorable news regarding Bitcoin adoption or improving macroeconomic conditions, support this move.
However, in a bearish scenario, if Bitcoin fails to overcome the $97,500 resistance and faces selling pressure, a price correction becomes more probable. In this case, the first significant support level is around $92,000, which could serve as an initial correction target. If selling pressure persists and this level is breached, the next support lies at approximately $89,500, which may act as a temporary price floor. Given the current market conditions and recent volatility, my personal view leans more toward a potential price decline, as technical factors and market uncertainty may strengthen sellers.
Risk Warning: Investing and trading in the cryptocurrency market involves high risk. Prices can be highly volatile, leading to significant profits or losses. Please conduct thorough research and seek professional financial advice before making any trading decisions. This analysis is solely a personal opinion and should not be considered financial advice. You are solely responsible for any trading decisions you make.
Good luck
Pooya Salehipour
BTC - Is this rally sustainable and what to expect?In the past two days, Bitcoin has experienced an impressive surge in price, exploding from around 85k to over 94k, showing strong bullish momentum. This rapid movement has certainly caught the attention of many traders and investors. However, while the price action has broken through previous lower highs, signaling a potential shift in market sentiment, it's crucial to approach this rally with caution.
Although the recent price increase indicates that bullish momentum is in play, it's important not to overlook the possibility of a short-term pullback or consolidation. The market has shown volatility before, and while breaking the lower-high structure is a positive sign, it doesn’t necessarily guarantee sustained upward movement.
In this analysis, I will dive deeper into the current price action and what it means for BTC short-term outlook. We’ll explore the factors to watch in the coming days and the potential risks that could challenge the bullish trend.
------------------------------------------
What will we discuss:
- Golden Pocket fibonaccy with resistance
- Point of Control
- Stochastic RSI
- The deathcrosses
------------------------------------------
Golden Pocket fibonaccy with resistance
The golden pocket Fibonacci zone (0.618–0.65), measured from the highs to the lows on the higher timeframe, is located between 96,450 and 97,580. This area aligns with a key resistance level that previously triggered a strong move down in BTC. The golden pocket often acts as a strong rejection zone, and bears are likely to try defending this level again. So be careful on how price will move into this level and how it reacts.
------------------------------------------
Point of control (POC)
The Point of Control (POC) for the entire trading range from November to the present is located precisely at 96,450. This level is particularly significant as it aligns with multiple technical factors, creating a strong confluence zone. Not only does it coincide with a well-established resistance area that previously initiated a sharp move to the downside, but it also sits within the golden pocket Fibonacci.
The POC marks the price level where the highest volume of trading activity has occurred during this entire range, indicating a strong area of interest for both buyers and sellers. High-volume nodes like this often act as magnets for price and tend to offer either strong support or resistance depending on the context. In this case, with the POC positioned within a broader resistance zone, it becomes an even more formidable barrier.
------------------------------------------
Stochastic RSI
The Stochastic RSI on the daily timeframe is currently in the overbought zone, where it has remained for approximately 10 consecutive days. This prolonged stay in overbought territory suggests that bullish momentum may be weakening and the indicator is beginning to show signs of exhaustion.
Typically, when the Stochastic RSI hovers in this upper range for an extended period without a meaningful pullback, it signals that a reversal or at least a slowdown in the prevailing trend could be imminent. The oscillator appears to be running out of steam, and barring a sudden surge in buying pressure, it is likely to start curling downward in the coming days or within the next week.
This could imply a shortterm correction is luring.
------------------------------------------
Deathcrosses this cycle
A deathcross is a bearish technical indicator (lagging) that occurs when a shorter-term (50-day MA) crosses below the longer-term (200-day MA).
Deathcross 1
At the time of the first death cross, the price of BTC had already formed a local low before the crossover occurred. Following the death cross, BTC experienced what is commonly referred to as a "death cross rally" — a counterintuitive move where price rallies shortly after the bearish signal.
This rally was significant, as it broke short-term market structure to the upside and eventually found support at the 50-day MA, the same level that previously acted as resistance. That support held, even during a brief rejection, and marked a key shift in momentum.
From there, BTC continued its upward move and eventually went on to make new highs, effectively invalidating the immediate bearish expectations typically associated with a death cross.
Deathcross 2
The second death cross in this cycle occurred after Bitcoin had already established a local low and began moving back upward toward the death cross. Initially, BTC struggled to break above the 50-day MA, but it eventually managed to push through.
However, this time, during the subsequent correction, Bitcoin was unable to hold the 50-day MA as support. Instead, it formed a higher low, indicating a shift in market dynamics and suggesting that the selling pressure may have been weakening. This higher low marks a crucial point in the price structure, as it hints at potential bullish momentum building, despite the earlier bearish signal from the death cross.
Deathcross 3
This time, the low was established right at the moment of the death cross, and BTC began to move upward immediately after the crossover occurred. After initially struggling to break above the 50-day MA, BTC surged higher and managed to surpass both the 50-day and 200-day MA.
Currently, BTC is facing strong resistance at these levels. The question now is whether BTC will correct and find support at the 50-day MA once again, as it did during the first instance, or if it is aiming to form a higher low, similar to the second occurrence.
In both scenarios, Bitcoin has historically experienced a pullback after a few days of upward movement, so a correction at this point would not be surprising.
------------------------------------------
Thanks for your support.
- Make sure to follow me so you don't miss out on the next analysis!
- Drop a like and leave a comment!

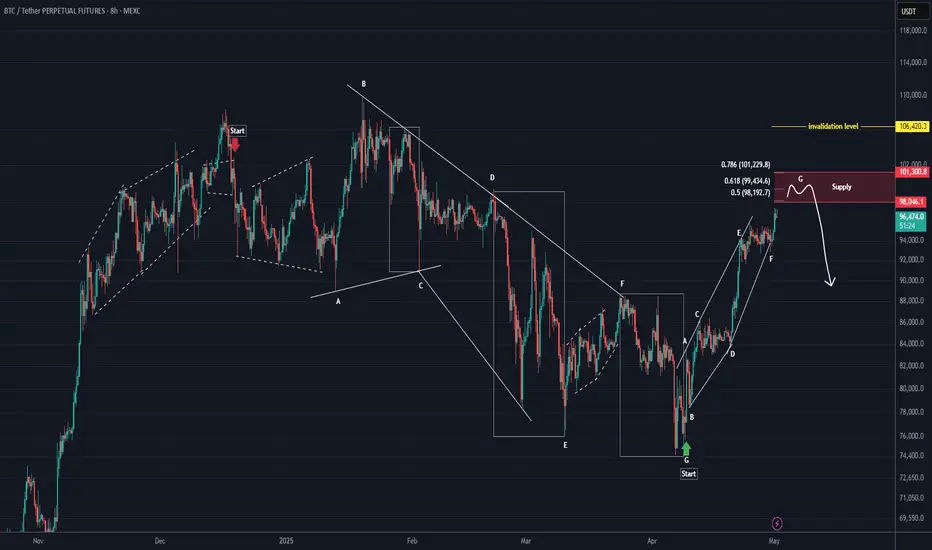
BTC New Update (8H)This analysis is an update of the analysis you see in the "Related publications" section
In the previous scenario, we considered that Bitcoin was in a diametric where wave E had extended. However, after reviewing the charts and analyzing various scenarios, we decided to revise the wave count as shown in this update, since wave E of the previous diametric scenario became overly extended.
You can see the complete wave count of the chart in this update. The correction in Bitcoin started from the point where we placed the red arrow on the chart. This correction was a diametric and ended where the green arrow is placed.
From the point where the green arrow is shown on the chart, Bitcoin's bullish wave has started, which is either wave A or W.
According to this scenario, the expected rejection zone should be between 98K and 103K.
The lowest-risk area for price rejection is the red box.
A daily candle close above the invalidation level will invalidate this analysis.
Let’s see what happens.
For risk management, please don't forget stop loss and capital management
Comment if you have any questions
Thank You