BTC 2025.05.06🔔 Follow SEOVEREIGN to get real-time alerts.
🚀 Your boosts fuel SEOVEREIGN to analyze more assets.
📊 Our team regularly publishes in-depth crypto market analysis reports.
📉
Bitcoin is expected to show a short-term decline, making it a key moment to consider short positioning with a strategic approach. Based on our analysis, the following targets have been identified:
Target 1: 92,325
Target 2: 90,565
Target 3: 88,853
From a wave structure standpoint, the C wave appears to have completed at 1.272 times the length of the A wave. This presents a clear and reliable wave count, suggesting that the C wave has likely concluded. As a result, we may now be at the very beginning of a new wave cycle—potentially marking the start of a short-term downtrend.
While the move may be short-lived, this zone could offer solid opportunities for traders who approach it with precision. Instead of entering impulsively, focus on well-defined targets and strict risk management.
This strategy is built on technical grounds—emotions should be set aside in favor of structured, scenario-based execution.
Stay sharp, stay focused, and don’t let the market catch you off guard.
BTCUPUSDT trade ideas

BTC/USDTMACROSENTIMENT
Macrosentiment Analysis – BTC/USDT
Current Market Structure:
Bitcoin appears to have found a strong bottom around the $74,000 level, which historically has acted as a key support zone. This area was anticipated months ago as a likely retest zone in the event of a correction — specifically between $70,000 to $75,000. We are now beginning to see bullish candles forming, signaling renewed momentum.
📈 Upside Targets:
If bullish momentum continues and volume sustains, BTC is potentially on track to climb toward the $140,000–$150,000 range as the ultimate macro target.
However, several key resistance levels need to be broken first:
$88,000 – Major immediate resistance
$95,000 – Secondary resistance
$100,000 – Psychological and historical milestone; likely to be the toughest barrier
It's important to note:
➡️ Without a clear breakout above $88,000, BTC will struggle to approach $95,000
➡️ Without breaching $95,000, we are unlikely to challenge the $100,000 level
📉 Downside Support Levels:
In case of a pullback, the key support levels to monitor are:
$85,000 – Currently holding
$80,000
$74,000
$70,000
Breaking below any of these levels would signal a weakening structure and could suggest the formation of lower lows and a shift toward a bearish trend.
📌 Summary / My View:
BTC remains in an uptrend, with this week’s candle opening green, and the $85,000 support holding firm — both are strong bullish signs.
Volume remains the primary driver of continuation.
Until we clear $88,000, the upside remains limited.
📍Implication for Altcoins:
Since many traders gauge BTC’s momentum to time their altcoin entries:
✅ I have personally entered a few altcoin positions based on current bullish confirmation.
The market structure suggests growing strength and increased risk-on behavior.

Bitcoins Next Potential Bullish MoveBitcoin has exhibited a notable resurgence following a significant decline into the lower $70,000 range, where it encountered key structural support zones. This retracement catalyzed a pronounced rebound, signaling a potential shift in short-term market sentiment.
At present, price action has reclaimed the prior all-time high (ATH) range but has encountered resistance at the current Point of Control (POC)—the most heavily traded price area—indicating active participation from sellers. Sustaining the Value Area Low (VAL) in conjunction with the downtrend-anchored VWAP around the $93,000 level will be pivotal for confirming a full rotation back toward the upper bounds of the value area, near $102,000.
This upper region represents a significant liquidity cluster, where a potential bull trap or liquidation cascade could unfold as late entrants enter the market under the assumption that the corrective phase has concluded and a new impulsive leg is underway. However, this area also marks the apex of the value range, where a reaction is statistically more probable—much like the recent rejection seen at the POC.
Should Bitcoin successfully defend the VAL, a broader value area rotation would be expected before any renewed downside pressure. A subsequent pullback toward the previous value area high could then act as a confirmation of breakout support, validating the bullish structure.
Ideally, this scenario—characterized by respect for value area dynamics and rotational momentum—would align most cleanly with market structure and auction theory. As price oscillates between value zones, each range is sequentially validated as either support or resistance, providing a framework for interpreting market behavior with greater precision.

[BTC] 2025.04.18Greetings. It’s a pleasure to reconnect with you.
Before diving into altcoin analysis, we believe it is essential to first address Bitcoin, as it remains the key driver in determining the overall market direction.
Since the beginning of 2025, Bitcoin has been in a prolonged consolidation phase accompanied by a downward trend. In an effort to identify a potential bottom for this correction, we have closely monitored the market over the past three months.
Initially, our team identified the period around March 10 as a likely inflection point for a bullish reversal and prepared a related analysis idea. However, we refrained from publishing it, as the movements of key altcoins—which typically serve as leading indicators—did not align with our internal criteria.
As anticipated, the market went on to form another low. We now believe that April 7 marked not just a temporary bounce, but a potential structural pivot point in the broader trend.
The rationale behind this assessment is outlined in detail below. We appreciate your time and hope you find the insights valuable.
We believe the logical starting point is to examine the key highs that have formed during this cycle.
Among the two major peaks—referred to here as “Point 1” and “Point 2”—it is critical to determine which marks the termination of the fifth wave. This distinction plays a pivotal role in accurately interpreting the subsequent wave structure.
If Point 1 is the conclusion of the fifth wave, then Point 2 can be naturally understood as the terminal point of a corrective B wave.
Conversely, if Point 2 represents the end of the fifth wave, then the decline that followed is likely the beginning of a corrective A wave.
To validate this, we conducted a detailed analysis based on Fibonacci retracement and extension ratios. The results showed that Point 2 did not align well with any major wave theory frameworks. Its price structure and time proportion appeared incomplete and inconsistent.
In contrast, Point 1 exhibited a high degree of confluence with multiple classical wave theories, including Glenn Neely’s NEoWave principles. Structurally, it demonstrated the typical characteristics of a completed five-wave advance.
Based on this evidence, we conclude that Point 1 is the more valid candidate for the fifth wave termination. Consequently, we believe any analysis of the current market structure should build upon this interpretation.
To further clarify the interpretation of the key peak,
we present two possible scenarios using Fibonacci ratios as the analytical foundation.
These scenarios are illustrated as the red path and the blue path,
each representing a different wave development depending on the subsequent market movement.
However, the key takeaway is that both scenarios converge on a single conclusion:
“Point 1” marks the completion of a full wave cycle,
and can thus be identified as the termination point of the fifth wave.
While the detailed wave progression may evolve depending on how the market unfolds,
recognizing that a major top has already been established is essential for shaping any mid-to-long-term strategy.
This structural understanding serves as a critical anchor in the broader market outlook.
Having previously identified “Point 2” as the likely termination of the B wave,
our current focus shifts to pinpointing the end of the C wave—
in other words, the optimal buying zone within the corrective structure.
Our team initially regarded the period around March 10 as a strong candidate for the conclusion of the C wave.
However, due to insufficient synchronicity across the broader market—
particularly the lack of confirmation from key altcoins—
we concluded that this point did not represent a genuine inflection.
※ Our analysis is based not on individual coins but on a comprehensive structural assessment of the overall market.
As a result, we extended our observation period.
A clear and confident reversal signal was finally detected around April 7.
In hindsight, the March 10 low proved to be a false bottom, marked only by a temporary rebound,
whereas the true structural pivot materialized in early April.
With this in mind, we believe the market is now entering a phase where a full wave reversal is plausible,
and it is time to begin formulating a strategic entry plan in alignment with this outlook.
Now, let us evaluate whether the second low (April 7)
qualifies as the true termination point of the C wave.
From a technical standpoint, the preceding decline exhibits the hallmarks of an Ending Diagonal—
a classic pattern frequently observed at the conclusion of C waves.
This structure serves as a strong technical signal that the wave sequence is entering its final stage,
indicating not just a temporary rebound, but the potential for a structural trend reversal.
Considering both the wave characteristics and the timing context,
we believe there is sufficient evidence to regard the April 7 low not merely as a short-term bottom,
but as the culmination of the C wave—and more importantly, the starting point of a major reversal in the broader trend.
Finally, to further reinforce the technical foundation of our analysis,
we turn to harmonic pattern analysis.
By applying a range of Fibonacci ratios between the start and termination of the B wave,
we have identified a remarkably precise Deep Crab pattern—
one of the most powerful reversal signals among all harmonic structures.
Notably, the current price action has landed directly within the PRZ (Potential Reversal Zone),
strongly suggesting that the timing for a strategic long position is ripe.
In summary, we now have a confluence of three compelling signals:
A clear Ending Diagonal structure at the tail end of the C wave,
A significant inflection point formed around April 7,
And a textbook Deep Crab harmonic pattern confirming the reversal zone.
These three elements align cohesively to provide a well-founded justification for initiating long exposure.
There is no longer a reason for hesitation.
Assuming appropriate risk management is in place,
we believe this is a moment to enter with confidence.
Thank you sincerely for reading this analysis in full.
We will continue to provide high-quality, data-driven market insights,
rooted in both structural depth and technical precision.
If our perspective resonates with your approach to the market,
we warmly invite you to follow our work and stay connected.
Your support and engagement are what fuel our continued efforts.
See you in the next idea.

Bitcoin's Blueprint: Channel Breakout Sets Stage for $104K Push
Looking at the Bitcoin/TetherUS 1D chart from May 6, 2025, we're witnessing a critical technical setup that suggests significant upside potential.
The price is currently at $94,758 , having established a solid foundation after the April recovery. This technical analysis reveals a powerful bullish scenario developing:
Master Pattern: Ascending Channel Continuation
Bitcoin has formed a textbook ascending channel (yellow boundaries) since the February-April bottoming pattern. After testing the lower boundary in April at approximately $74,508, price has rebounded sharply and is now consolidating in a rectangular accumulation zone (purple box).
Key Technical Elements:
- Diagonal Support Break : Price has successfully broken above the descending trendline (gray) that had capped gains since early 2025
- Channel Position : Currently trading in the lower half of the ascending channel, suggesting significant upside room
- Volume Confirmation : The 10.61K volume with positive price action (+0.03%) indicates healthy accumulation
Projected Movement Pattern
The blue arrows map out the anticipated price movement:
1. Current consolidation within the purple box (accumulation phase)
2. Initial thrust to upper channel boundary (~$100K)
3. Minor pullback to establish higher support
4. Final push toward the target of $104k
Strategic Insight: "The Channel Magnet Effect"
Bitcoin's price action demonstrates the magnetic pull of the upper channel boundary after confirmed breaks of diagonal resistance. The purple consolidation zone serves as the launchpad for this measured move.
This pattern is particularly significant as it mirrors Bitcoin's historical tendency to build momentum through rectangular consolidations before channel expansions.
Traders should watch for a convincing break above $98,000 as confirmation of this bullish scenario, with potential for acceleration once psychological resistance at $100,000 is breached.
For risk management, the lower boundary of the purple box provides a clear invalidation point for this bullish thesis.

BTC 1HA final liquidity hunt can be expected before or after the monthly close. Then we expect a correction movement with the first week of May.

Bitcoin a Technical Summery technical summary based on what you're describing for BTCUSDT on the 4H timeframe:
Forecast from Mr Martin Date 05 May 2025
Current Setup:
Pattern: Two-sided consolidation/pattern (likely symmetrical triangle or range)
Key Support: ~89,000 USDT
Key Resistance: ~95,000 USDT
Scenarios:
Bullish Breakout:
If price holds above 95K and confirms breakout: Next target: ~98,000 USDT
Above 98K, could test psychological levels like 100K.
Bearish Breakdown: If price falls below 89K:nExpect a retest or quick rebound toward resistance (~95K).
You may see more details in the chart Ps Support with like and comments for more analysis Thanks

TradeCityPro | Bitcoin Daily Analysis #77👋 Welcome to TradeCity Pro!
Let’s dive into the analysis of Bitcoin and key crypto indexes. As usual, I’ll walk you through the triggers for the New York futures session.
⏳ 1-Hour Timeframe
As you can see in the 1-hour timeframe, Bitcoin is still ranging, and volume has decreased compared to yesterday. In times like these when market volume is low, you need to pay closer attention.
✔️ Today, I’ve drawn an ascending trendline on the chart. When price performs very shallow corrections after an uptrend and each low is higher than the previous one, it indicates a very strong bullish trend. So if this trend continues, it can lead to some very attractive trade setups.
💥 As mentioned, volume is quite low today, and volatility is also lower than before. This means that most market participants are waiting to see what will happen before reacting. We should take the same approach and wait for our triggers to be activated.
📈 For a long position, it’s pretty clear that Bitcoin has a very important resistance at the 95370 level, which is currently the only long trigger. If you don’t have a position from lower levels, this is a very logical and attractive entry, and I suggest having a position ready if this level breaks.
📊 For a bearish scenario, we haven’t yet received confirmation, and we need to wait until at least the trendline is broken. After that, with the activation of a trendline trigger like the 93626 level, we can enter a short position.
👀 As I’ve said in previous analyses, I personally won’t open a short position unless Bitcoin reaches the 91945 level, as that’s my first confirmation for a trend reversal.
👑 BTC.D Analysis
Let’s check Bitcoin Dominance. The dominance range box continues, and yesterday it again moved upward from the 64.22 support and reached the range top at 64.60.
☘️ If you had opened a position on altcoins like ETH after their triggers activated yesterday, you probably hit stop-loss because of this dominance move. As dominance moved up after those triggers, capital flowed out of altcoins, causing many of them to fake out and fall back below their resistance.
📅 Total2 Analysis
Now for Total2. Just like Bitcoin, Total2 is forming a range box, but it has significantly less bullish momentum. While Bitcoin has some upward slope during its range, Total2 is completely flat and oscillating between 1.03 and 1.05.
⚡️ Triggers for Total2 remain unchanged: breakout of 1.05 for bullish confirmation and 1.03 for bearish. But just like I mentioned that I won’t act on Bitcoin’s 93626 break and will wait for 91945, here I also won’t act on a 1.03 break—I’ll wait for confirmation below 1.00.
📅 USDT.D Analysis
Let’s move to Tether Dominance. A new lower high has formed just below 5.14, and for now, I’ve adjusted the resistance level to 5.10, because as you can see, the price is reacting well to this area and we can use it as a trigger.
🧩 For a bearish USDT.D scenario (which would mean bullish for the market), breaking below 4.99 remains the key trigger. For a bullish USDT.D scenario, breaking above 5.10 would be the first confirmation of a shift in dominance upward.
❌ Disclaimer ❌
Trading futures is highly risky and dangerous. If you're not an expert, these triggers may not be suitable for you. You should first learn risk and capital management. You can also use the educational content from this channel.
Finally, these triggers reflect my personal opinions on price action, and the market may move completely against this analysis. So, do your own research before opening any position.

Bitcoin - Gearing Up for a Break Above Key ResistanceBitcoin has been grinding just below a key resistance zone, marked clearly around the 95,400–95,800 region. This area has seen multiple rejections in the past, making it a strong level where sellers are actively defending. Despite this, the broader trend structure remains intact to the upside, with price respecting a higher-timeframe ascending trendline and forming higher lows.
Consolidation Structure
Current price action shows a range developing just under resistance, with signs of weakening bullish momentum in the short term. We’ve had multiple wicks into the highs, but no convincing close above. On the flip side, there’s a visible support zone around 93,000–93,800, which has previously been used to absorb liquidity and fuel moves higher. This zone is confluenced by the ascending trendline from previous swing lows, offering a clear area for a liquidity sweep.
Bullish/Bearish Scenarios
In the short term, a pullback into the green support block looks likely. This would serve two purposes: sweep out late longs and provide fresh liquidity for a stronger bullish push. A dip into this level that still respects the trendline would maintain bullish structure despite violating the local higher low.
If price holds this zone and begins forming higher lows again, we could see an impulsive move into and possibly through the resistance. A clean break and close above 95,800 would likely open the door for much higher prices, as the level has capped upside multiple times and a breakout would likely trigger stop orders and breakout buying.
Failure to hold the green zone and the trendline, however, would break the short-term bullish structure and increase the probability of a deeper retracement, possibly invalidating the breakout thesis temporarily.
Price Target and Expectations
If the resistance breaks, the path toward 105,000 remains in play. That target aligns with the macro breakout structure and continuation from the trendline, supported by higher timeframe bullish sentiment.
What do do now
Watching for a pullback into 93,000–93,800 to see if liquidity is swept and support holds. No interest in chasing price into resistance. The key is to see how price reacts at the next low and then again at 95,800. If the pullback unfolds and buyers step in with momentum, that would provide the cleanest long opportunity into new highs.
Conclusion
The market looks poised for a short-term dip to rebalance liquidity before mounting a serious attempt to break a long-standing resistance zone. As long as the trendline is respected, the bullish structure is intact, and any sweep of local lows may offer a strong risk-reward entry for continuation toward 105k.
___________________________________
Thanks for your support!
If you found this idea helpful or learned something new, drop a like 👍 and leave a comment, I’d love to hear your thoughts! 🚀
Make sure to follow me for more price action insights, free indicators, and trading strategies. Let’s grow and trade smarter together! 📈

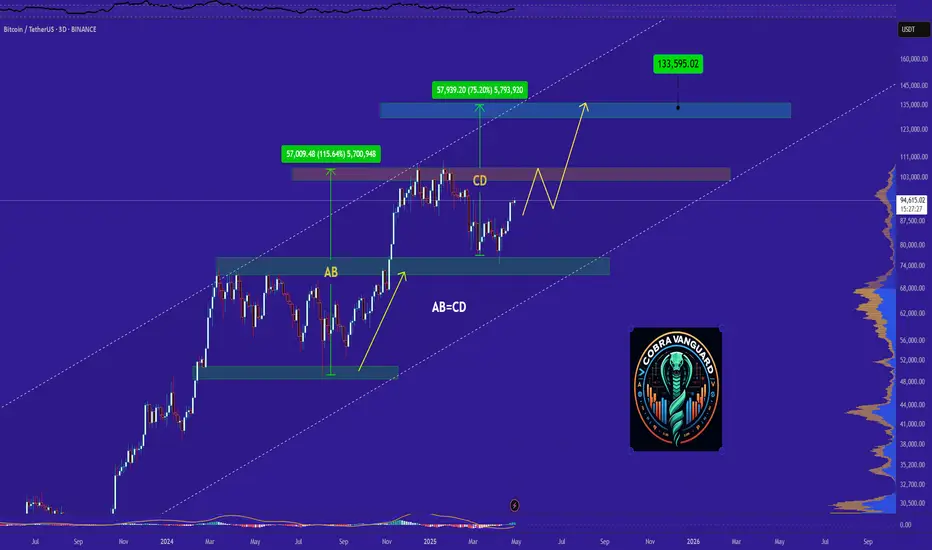
#BITCOIN: $130,000 Is Where Price Headed To? BINANCE:BTCUSDT consolidated at 75k and reversed from the region as predicted in our previous chart. We now have strong confirmation that price will likely break through the daily bearish trendline. We can enter when it retests the identified area.
We have two major targets. Do your own research and analysis, and use this as secondary bias.
Good luck trading.
❤️
Hope you’re having a great weekend.
Team Setuspfx_


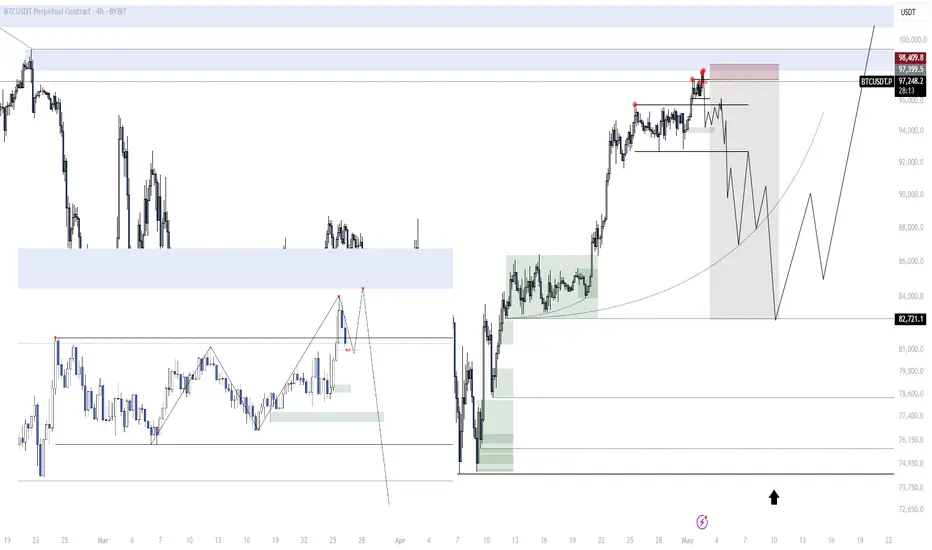
Do you think I'm joking ???I might be wrong and this might never happen, but it might come true From a technical perspective!!!
Give me some energy !!
✨We spend hours finding potential opportunities and writing useful ideas, we would be happy if you support us.
Best regards CobraVanguard.💚
_ _ _ _ __ _ _ _ _ _ _ _ _ _ _ _ _ _ _ _ _ _ _ _ _ _ _ _ _ _ _ _
✅Thank you, and for more ideas, hit ❤️Like❤️ and 🌟Follow🌟!
⚠️Things can change...
The markets are always changing and even with all these signals, the market changes tend to be strong and fast!!
Bitcoin Daily Chart Update – Momentum Intact!📢 Bitcoin (BTC) has surged from $84,800 to nearly $96,000 in just 10 days, following a strong breakout on the daily chart. Price is holding well, showing bullish continuation.
🚩 The next key level is $97,200 – a clean breakout above this can open the door to $99,520 and possibly a retest of recent highs, assuming global sentiment remains stable.
🔒 Stop-loss for the setup: $93,000
📈 This setup was spotted using the iSparkIndicator, which is designed to identify early momentum shifts and breakout zones. It’s been a game-changer in catching such moves with confidence.
📬 If you're curious about how it works, feel free to DM me for insights or a hands-on trial.
#Bitcoin #BTC #Crypto #Breakout #CryptoTrading #TechnicalAnalysis #TradingView #iSpark #BitcoinUpdate #TrendFollowing

BTC (1H)At this level. BTC looks like it will be bearish,
if this respected the resistance line....
This is condition 1... if bearish

Back to Base, and a Correction upwards towards 90k+This went way higher than most people expected and now people are calling 100k again.
We have a relatively "boring" number 95.7k which was the sellside monthly imbalance

Bitcoin Ascending Broadening Wedge (4H)After a clean breakout above the macro downtrend, BINANCE:BTCUSDT rallied into its supply zone — but price action has since become increasingly volatile, forming a rising broadening wedge (also known as a megaphone pattern).
Pattern Insights
• The structure is defined by diverging trendlines, with each swing becoming larger and more erratic.
• This pattern often signals instability or exhaustion, especially near key resistance.
• While it can break either way, broadening wedges in an uptrend frequently resolve to the downside, especially when supply is overhead.
Key Levels
• Resistance: ~$ 98K-$99.5k supply zone — the upper boundary of the pattern.
• Support: ~$93.5k area — prior S/R, potential flip zone.
• Reversal: A breakdown below ~$93k could confirm a short-term bearish resolution and open the door to ~$88.5k.
• Continuation: A breakout above the upper boundary with volume could trap shorts and ignite a squeeze toward new highs.
Until then, BTC remains in a high-volatility structure, best approached with caution or as a range-trading opportunity.


Bitcoin’s Make-or-Break Moment: Eyes on $70KBitcoin price almost reached the $74k support area, which is critical for the bull run continuation.
This zone has acted as a strong resistance in the past, and a clean bounce from here could signal renewed strength and confidence in the market.
However, if this support fails to hold and BTC closes the weekly candle below the $70k level, it would likely mark the end of the current bull phase and signal the beginning of a distribution phase or even the early stages of a new bear market.
That doesn’t necessarily mean Bitcoin will crash straight to $50k — corrections are rarely that linear. But it would drastically reduce the chances of seeing new all-time highs in this cycle.
The next rally, if it happens, would probably be more muted and shorter-lived.
Hopefully BTC will manage to avoid this scenario and hold above the support area.
On the positive side, if BTC holds above $70k and we see strong demand stepping in, it could set the stage for a healthy bounce and continuation of the uptrend.
Still I expect that BTC will test 70k level and if we see strong buying pressure on that level we can expect some recovery.

Simple Technical Analysis for Bitcoin
If the price closes above $69,150, then, God willing, we may head toward the next target at $107,000.
However, if it closes below this level, the likely direction would be toward $84,200.
In my personal view — and God knows best — the chances of a downward move seem higher than an upward one at the moment.

BTC next WeekThis is my outlook for the next week, going into the daily cycle low. A model 1 in this range which could confirm a PO3 would be perfect. After the weekend it should be clear what will happen next, so im patient.
Bitcoin is Showing a New Trend!!!Hey Traders, in today's trading session we are monitoring BTC/USDT for a selling opportunity around 95k, Bitcoin is trading in a downtrend and currently is in a correction phase in which it is approaching the trend at 95k support and resistance area.
Trade safe, Joe.

BTCUSDT BUYGiven the resistance levels and the hidden divergence, it returned to the previous support level.
