Market overview
WHAT HAPPENED?
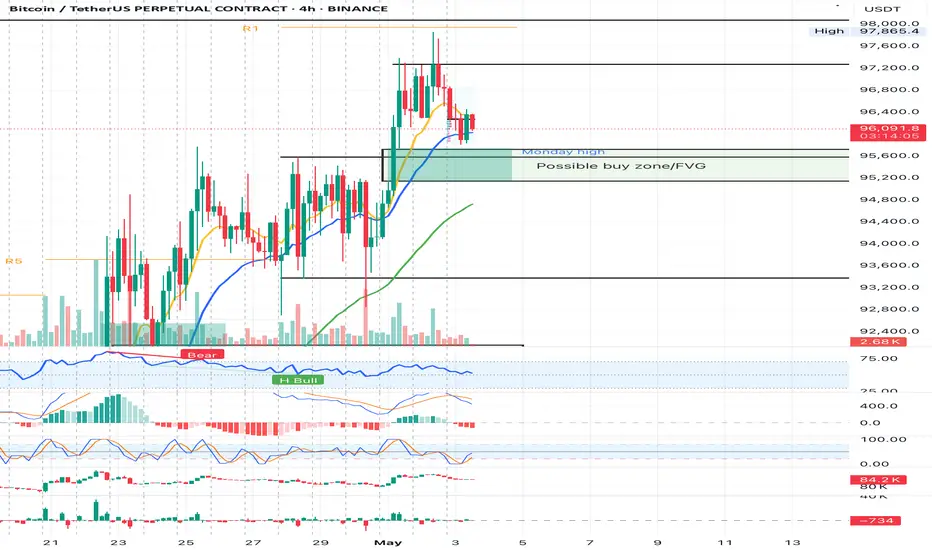
Last week, for bitcoin, we got an exit from the sideways trend in the upward direction, but the growth wasn’t significantly confirmed by volumes. The price reached the key resistance zone of $97,500–$98,400 (pushing volumes), from which we received a reaction.
Currently, BTC has adjusted to the buy zone of $95,000–$93,400 (accumulated volumes), the buyer's reaction is present.
WHAT WILL HAPPEN: OR NOT?
There is a high probability of a test of lower levels this week. This scenario is confirmed by the following factors:
• a steady delta advantage in the direction of sales, which prevents the development of a full-fledged upward movement;
• rather weak trading volumes;
• the wave structure, which has already called into question the current exit from the sideways trend, the price has returned to its framework.
We consider the development of the correction through one of the marked scenarios on the chart.
Sell Zones:
$96,100–$96,600 (local volume area)
Level $98,000
$107,000–$109,000 (volume anomalies)
Buy Zones:
$95,000–$93,400 (accumulated volumes)
$91,500–$90,000 (strong buying imbalance)
$88,100–$87,000 (absorption of market selling)
$85,500–$84,000 (accumulated volumes)
$82,700–$81,400 (volume area)
Level $74,800
$69,000–$60,600 (accumulated volumes)
IMPORTANT DATES
On macroeconomic developments this week:
• Monday, May 5, 13:45 (UTC) — publication of the index of business activity in the US services sector for April;
• Monday, May 5, 14:00 (UTC) — ISM Purchasing Managers' Index for the non-manufacturing sector of the United States for April;
• Wednesday, May 7, 18:00 (UTC) — publication of the FOMC statement and the US Federal Reserve interest rate decision;
• Wednesday, May 7, 18:30 (UTC) — FOMC press conference;
• Thursday, May 8, 11:00 (UTC) - announcement of the interest rate decision The Bank of England in May;
• Thursday, May 8, 12:00 (UTC) — publication of the inflation letter from the Bank of England;
• Thursday, May 8, 12:30 (UTC) — publication of the number of initial applications for unemployment benefits in the United States.
*This post is not a financial recommendation. Make decisions based on your own experience.
#analytics
BTCUPUSDT trade ideas

Bullish continuation Price retraced to a level on the 4hrs timeframe.
15mins bearish trend is coming to an end, now we continue bullish

BTC SHORTBTC Failed to push through the resistance at 97 to 98k, hence breaking structure downwards. I identified a strong push down and analyzed a breaker block which will be my entry as seen on the graph.
Targetting PWL as well as previous weeks POC.
Goodluck !

BTC (Post Weekly Close Update)BTC has seen a weekly close above the 93700 support, suggesting bullish strength and likely continuation if this level holds on the weekly. We remain bullish as long as 93700 is maintained; a drop below it would be the first SOW on the HTF, potentially targeting 89K–90K, and possibly 1D OB at 83K–85K. Technically, this remains a LH until the 99500 SH is convincingly reclaimed, ideally on a weekly close.
On the daily, however, we’ve observed the first SOW, closing below the SH at 95K after a rejection from the 1D supply zone, refined into MTF HOBs, where whales initially sold off aggressively. This isn’t alarming, but it warrants attention. With the SPX at resistance, the DXY at support, USDT.D closing the weekly well above the SL at 5.03, and TOTAL at resistance, these are signs of caution, in my view, despite the series of bullish news we’ve seen. That said, with the HTF remaining bullish, we’ll focus on exploiting LTF and MTF moves. The FOMC meeting on Wednesday could certainly bring volatility in the markets, particularly as BVOL24H and BVOL7D, as mentioned in the last update, are at support.👀
To further examine the weakness, note the contrast between the two horizontal ranges (grey boxes). The first range saw a BO followed by impulsive PA, smashing through the 90K key level. In contrast, the second range produced a BO but encountered an HTF supply, resulting in a notably weaker bounce compared to the first BO from the lower range. This could potentially manifest as a deviation if the price closes below the RL, making the 8D HOB at 89K–90K our next target.
On the LTF/ MTF, we’ve also seen a break below the TL, with the other resistance TL being respected, indicating further weakness. Although we haven’t yet seen HTF weakness, I believe a scalp-sized short from the 11H OB, refined into a 2H HOB at 95500 SH, makes sense with a tight invalidation, or from the MTF level around 97500, if provided. If the daily closes above 95500 again, I might consider a scalp long into the 1D supply for a potential DT or even the 100K psychological level.

BITCOIN BULLISH BTC/USDT Analysis – GigaAlgo SMC | May 5, 2025
Price has recently tapped into a premium OB zone with strong volume rejection. Although JASMINN ML flags bearish sentiment, the structure still supports bullish momentum up to 96K unless the 93K support fails. If that breakdown occurs, the next significant support lies around 83K, aligning with previous volume zones and the STATION marker.
The GigaAlgo Oscillator shows a deep red bar print, hinting at increasing bearish pressure short-term, while multi-timeframe sentiment shows a mix of red and green — signaling indecision and potential range-bound action.

BTC/USDT Quick Update – May 5 (BTC/USDT – Multi-Timeframe Breakd4H Chart – Short-Term Bearish
Price has clearly broken down from a rising wedge pattern with volume confirmation. RSI is trending downward (~36) and Parabolic SAR has flipped bearish. Expect potential continuation to the $91K–92K support zone. If momentum accelerates, gap-fill toward 88K remains in play.
1D Chart – Neutral to Weak Bullish
Daily structure still intact, but momentum is fading. Price is hovering near dynamic support (200 EMA / cloud base), but the lack of bullish volume suggests caution. RSI is flat (~60), and ADX shows weakening trend strength. A decisive breakdown could lead to retest of 88K–90K area.
1W Chart – Macro Bullish but at Resistance
Weekly chart remains structurally bullish, with higher highs/lows and price well above Ichimoku cloud. However, BTC is approaching a major resistance zone between 98K–$104K, where rejection has occurred previously. RSI (~58) shows mild cooling; bulls must step in soon for a clean breakout.
Final Take:
Short-term trend is clearly bearish, and mid-term momentum is weakening. However, long-term structure remains bullish as long as price holds above the 88K zone. Monitor volume closely at support levels—buyers must defend $91K to avoid deeper retracement.
Trade safe. Plan your entries wisely.
Follow for real-time updates and further ideas.

BITCOIN WEEKLY CHARTBitcoin Break of Supply Roof: Implications for Price Action
Bitcoin’s recent breach of a critical supply roof (resistance zone between $95,000–$98,300) has significant implications for its near-term price trajectory.
this range may represent a "supply roof" where holders accumulated Bitcoin. A breakout suggests these holders are either holding for higher prices or have already distributed, reducing immediate selling pressure.
On-Chain and Fundamental Support
Institutional Demand: Corporate treasuries (e.g., MicroStrategy) and ETFs continue accumulating Bitcoin, reducing available supply.
Negative Funding Rates: Despite price gains, futures markets show neutral-to-negative funding rates, indicating room for leveraged longs to enter.
Post-Halving Scarcity: The April 2024 halving has tightened new supply, with only ~19.86 million BTC in circulation (94% of total supply mined).
Conclusion
A decisive breakout above $98,000 would signal a bullish regime shift, targeting $100,000–$109,000 in May/June. However, traders should watch for volume confirmation and macroeconomic cues to validate the move. Failure to hold gains could see Bitcoin retest lower support, but the broader 2025 outlook remains bullish, with institutional adoption and scarcity dynamics underpinning long-term upside.
Critical events this week: US CPI data (May 30) and ETF flow trends will be pivotal for sustaining momentum.

BTCUSDT Take ProfitThe BTCUSDT trade I shared a few hours ago closed in profit. Those who wanted could have set the TP at a 1:2 Risk-to-Reward Ratio as well. I entered the trade with a sniper entry. 🎯📈

BTCUSDTHello traders! A potential short signal is forming on BTCUSDT. However, it's not ideal to open the sell position right now — we need to wait for the price to reach a specific level. Once it does, we can execute the trade.
So, what are the entry, TP, and SL levels for this setup?
If you’ve just started following me, let’s get started!
🔍 Criteria:
✔️ Timeframe: 15M
✔️ Risk-to-Reward Ratio: 1:1.50 / 2
✔️ Trade Direction: Sell
✔️ Entry Price: 95828.00
✔️ Take Profit: 95507.18
✔️ Stop Loss: 95988.00
🔔 Disclaimer: This is not financial advice. It's a trade I’m taking based on my own system, shared purely for educational purposes.
📌 If you're also interested in systematic and data-driven trading strategies:
💡 Don’t forget to follow the page and subscribe to stay updated on future analyses.


BTC DROPS 2% FROM A HIGH OF 97,895.26 Price recently made a 2% increase and quickly dropped back. I envisage a buy opportunity from the current market price. target profit is 97,895.
take advantage of this opportunity.

BTC Bias bullish imbalance that ultimately failed to provide expected support. Subsequently, the market executed liquidity sweeps, indicative of stop-loss inducement. Following this, price retraced to a discernible Optimal Trade Entry (OTE) level, which is currently exhibiting respect as a potential pivot point.
The failure of the anticipated bullish reaction at the imbalance suggested underlying bearish strength. The ensuing liquidity sweeps provided the necessary momentum for a directional move. The subsequent adherence to the OTE level now presents a technical confluence warranting attention for potential trading opportunities aligned with the observed market flow.

BTC can move slingshot? - When 87k?BTC as mentioned, have a slingshot move as mentioned above and shall come to the SVP 95,010, where can move up again

BTC/USDT Quick Update – May 4Bitcoin to $102K? Bullish Momentum Still in Play (4H Chart)
Bitcoin is holding strong within an upward channel, showing clear bullish structure with higher highs and higher lows. After breaking out of a long consolidation phase, it’s now finding support around $94.5K and riding along the midline of the ascending trend.
Momentum looks solid, with price above key EMAs and holding structure.
Next major resistance: Sitting at $102,000, which lines up with the top of the channel and a previous supply zone.
Indicators:
RSI is slightly cooling off, suggesting potential short-term consolidation.
ADX still supports a strong trend.
Volume’s dipped a bit, so we may need fresh buying pressure for the next leg up.
If BTC can hold above $94.5K, the bullish structure remains intact. A push to $102K looks likely in the short to mid-term.

Trading Secrets:How To Find The Best Assets To Trade-Part 1Trading keep be a challenge for you and
i understand if you are struggling to understand it.
I made decision yesterday and decided to
learn how to drive a car.This is something
that is life changing and i pray and hope that i will make it.
Its crazy that i never thought about this
idea in order to make money from it.
The key is to learn how to produce and not consume.
The problem with young people is that
all they care about is that dopamine rush.
They are thinking about consuming and not producing,
This is a huge problem and i never
thought about it in the beginning.
When you trade you need to manage risk.
You should not use margin at all.
If you want to use margin then you have to
Be a pro.Otherwise in the video i am only using 10x Margin on Forex.
Then i am only using X2 Margin in stock trading.
This is because these are the best risk levels
for the secret system i am using which
i can not share with you.
But i can share with you my HOT PICKS!!
watch this video to find my HOT PICKS..
Rocket Boost This Content To Learn More
Disclaimer: Trading is risky please risk management
and profit taking strategies.Also Feel free to use a
simulation trading account before you use real money.

BTC - Liquidity Mapping to Predict MovementAs a part II to my previous post on “Bull Market OR Bearish Retest?” - Here is a 2 day liquidity map on BTC’s chart.
I’m anticipating a sharp drop to 7,000 - why is this number significant?
There is a mass amount of liquidity in the chart down towards 7,000-10,000.
This liquidity is in the form of long stop loss orders.
In layman’s terms - the sell orders required to take price to this extreme low are already within the chart. It is a pre-set consequence to traders decisions in a market dominated by leveraged buys and sells.
If we consider what the “floor” price of BTC is (IE all long term secured holders) - we first have to seperate out the leveraging liquidity used in the futures market.
How much of the BTC market cap is injected liquidity from futures / derivatives? In my view, anything above 7,000.
This liquidity can flow in and out, and the business and function behind it isn’t affected. This liquidity is extremely fluid. It can drop 90,000 and rise 90,000 shortly after without any affect on the fundamental value of Bitcoin.
Sure there is a psychological consequence with perceived value and market stability - but the fact is, leveraged liquidity can enter the market and leave the market with no impact at all on the wallets of market makers.
Food for thought - happy trading.

BTC - “Bull Market” OR Bearish Retest on HTF? Bitcoins excessive rise for the previous two years brings concern for the mechanics of this market. Moving only up for so long leaves much liquidity in the form of long position stop losses below the current price.
These stop loss orders, or leveraged sell orders, are an explosive chain reaction ready to set off.
Observe these two trendlines and copy them to your charts. These two bearish trendlines (in my view) are why bitcoin has truly been rising so freely.
Moves up in the form of bearish retests are fast and fluid, only after the rejection does price fall aggressively.
I anticipate two scenarios here in the realm of bearish ideas:
Possibility 1 - 30% Probability
96,700 to 34,500
34,500 retrace to 68,500
68,500 to 7,000
Possibility 2 - 70% Probability
96,700 to 43,000
43,000 retrace to 60,000
60,000 to 7,000
Note that both of these possibilities end with 7,000. I’m mapping out two routes that take us there, using confluences with trendlines, volume profiles, liquidity mapping, and common sense.
Be mindful of this possibility. And protect yourself accordingly.

BTC (1H) condition 2If market didn't respect this resistance trendline..
then this will be bullish...
but this is my condition 2 . and i don't think this will happen.. but if happened then this will hit again..

BTC/USDT Quick Update – May 3BTC has seen a strong breakout and is showing good momentum, but we’re approaching a key resistance zone around $102,000 – so it's a good time to stay cautious.
Trend and momentum indicators still look bullish
RSI is nearing overbought territory
Watch price action and volume closely near resistance
No need to rush in here – let the chart guide you. Stay smart, stay patient.
#Bitcoin #BTC #CryptoTrading #MarketUpdate

When nobody knows where #Bitcoin is heading, #quantumalgo see thI took a long on BTC / USDT on the 15-minute chart when my Quantum Algo flagged an oversold condition—both the CRL oscillator and price printed green dots at a fresh swing low—signaling momentum exhaustion and support confluence around 96 000 USDT. I entered near 96 020 with a tight stop just below the low, and set my profit target near the next major resistance at about 98 900, yielding an attractive risk-reward. Overall, the signal combined clear momentum reversal, structural support, and disciplined risk management to ride the anticipated next leg up.


Bitcoin Could Rise Toward Its All-Time High"Bitcoin Analysis:
If Bitcoin stabilizes around the $100,000 zone, it could continue its upward momentum and potentially reach new all-time highs. However, if the $98,000–$100,000 resistance range holds strong, we may see a price correction that could bring Bitcoin down to the $68,000 support level.
It’s also crucial to closely monitor macroeconomic factors such as the U.S. Federal Reserve’s interest rate policies, the ongoing trade war, and potential economic recession in the U.S.—these factors can significantly influence Bitcoin’s price direction.
