BTCUSDT Bullish FrameworkBTC is coming for All Time Highs.
Any pullback into the Weekly Swing Point, I will be loading up my bag for a run to ATHs.
Let's see .....
BTCUPUSDT trade ideas

BTCUSDT to head towards 106kBTCUSDT is currently trading inside weekly resistance zone WR1 and currently holding inside this zone. However, since it has not been rejected outrightly from there showing the strength and a high probability of it breaking this resistance and moving to the upside towards 106k area. Later we can see pullback from there towards WR1+DS1 zone testing as support and then bounce again from there towards clear sky as depicted on the chart. This structure will also create a giant inverse head and shoulder fueling the upward move later on. However, those we will assess later after more price action is there. But for now, lets focus on this long trade from weekly resistance zone WR1 to 106k.

BITCOINSeveral factors could cap Bitcoin’s (BTC) upside this month (May 2025) despite its strong momentum near $97,000:
Volume Decline and Depleting Buying Momentum
Recent trading volume has been declining, suggesting weakening buying pressure. Without strong volume to confirm a breakout, rallies may stall or reverse, attracting bearish activity and limiting upward moves.
Profit-Taking After Sharp Rally
After surging roughly 24% from April lows , some investors may lock in profits, creating short-term selling pressure that caps gains.
Macroeconomic and Geopolitical Risks
Mixed economic data and ongoing macro jitters-such as trade tensions and tariff uncertainties-could trigger risk-off sentiment, reducing appetite for risk assets like Bitcoin and strengthening the US dollar, which often moves inversely to BTC.
ETF Inflows and Market Sentiment Volatility
While institutional inflows via Bitcoin ETFs have been strong, sudden shifts in sentiment or regulatory concerns around crypto products could cause volatility and limit sustained rallies.
Technical Indicators
Although technicals remain broadly bullish, Bitcoin must decisively break and hold above $96,230 with volume confirmation to sustain an upswing. Failure to do so could result in consolidation or pullbacks to support zones near $90,237 or lower

BTC to hit 98k in coming daysPrice cleared buyside liquidity on the daily and is currently heading for the bottom of the range. Below the bottom sell side liquidity is a 5 minute institutional candle which caused the previous weeks rally. Price to bounce of 96k and head towards 98k in the coming days. Trade carefully

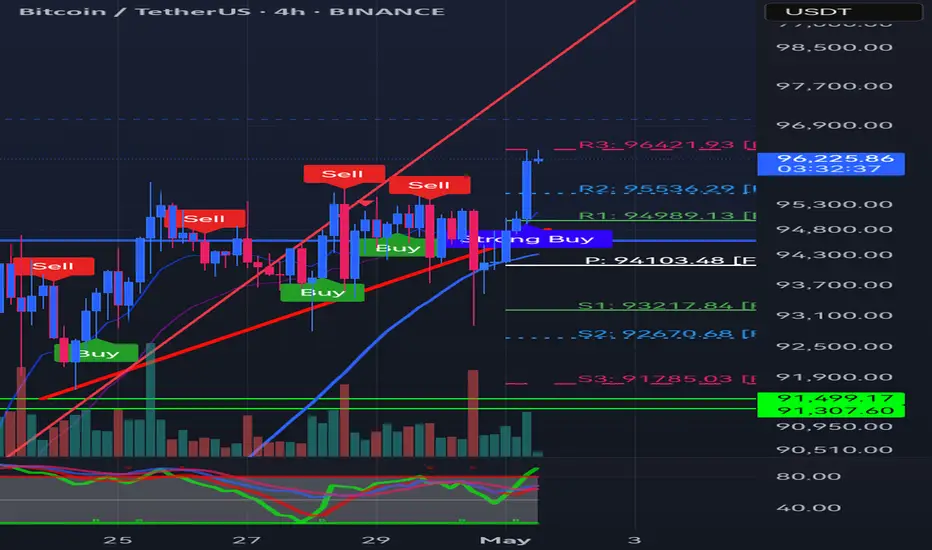
BTCUSD 4H – Strong Buy Signal After Pivot Bounce | Targeting 96KBitcoin (BTC) is showing a strong bullish setup on the 4H chart, following a clean bounce from the pivot level around $94,103. This bounce was accompanied by a strong buy signal, increased volume, and an upward trend in RSI, confirming buyer momentum.
Key levels I'm watching:
Support: $94,100 (Pivot), $93,217
Resistance Targets: $94,989 (R1), $95,536 (R2), and $96,421 (R3)
The price action suggests a breakout toward R2 and possibly R3 in the coming sessions. A sustained close above R1 would confirm this move.
Strategy:
Ideal for a short-term swing trade setup — entry near $94,800, take profits near R2 & R3, and a stop-loss just below $93,200 for safety.
Indicators used:
Trendlines
Pivot Points
RSI (bullish crossover)
Volume Confirmation
Buy/Strong Buy Labels
Why aren't we growing now?Bitcoin will not be allowed to rise at the moment. First of all, there are two unfilled liquidity zones. Secondly, there is no catalyst for growth — such as positive news. We will definitely move toward the first liquidity zone. The second one might be reached after some time. Even if there is growth now, it will be a false, artificial rise created by whales. This is crypto — welcome.

What’s Next for Bitcoin?At the moment, we’re inside a broad consolidation range between 109,951 and 74,456, with the midpoint at 92,204. Based on this, we can see that price is currently trading near the upper boundary of the range — showing strength and aiming for a potential breakout toward a new ATH. Additionally, price remains above the 0.618 Fibonacci retracement level, which reinforces the bullish outlook. We’re also testing the upper band of VWAP, acting as resistance.
Personally, I’d prefer to short — but right now it’s simply not the time. If we try to assess the chart objectively, this is clearly a long setup with a target above 110,000. As for potential shorts: they only make sense if price drops below the midpoint — under 92,204. If we start to break down from that zone, then selling becomes viable, with the first target around 74,456 or even lower. Because in that case, price likely won’t stop at 74,456 — it may push significantly deeper.

[SHORT] BTCUSDT - Binance | Will BTC Correction Happen Now?Welcome,
- Status: 📉 Short
- BTC wait 15m Close bellow the Orange Line then Entry
- TP & SL On chart
Keep wait..
Lets see..

BTC-----Sell around 96300, target 95300-95000 areaTechnical analysis of BTC contract on May 2:
Today, the large-cycle daily level closed with a medium-yang line yesterday, the K-line pattern was single-yin and single-yang, the price was at a high level, and the attached indicator was running in a golden cross. However, although the price broke through the high point yesterday, it did not continue. It is currently in a waving trend. In this way, we still have to look at the range shock trend in terms of trend, and the transaction is still high-altitude and low-multiple; the short-cycle hourly chart showed that the US market rose and broke the high yesterday, and the price retreated under pressure in the early morning. The current K-line pattern is continuous and negative, and the attached indicator is running in a dead cross, so there is a high probability that there will be a demand for a decline during the day.
Therefore, today's BTC short-term contract trading strategy: sell at the current price of 96,300 area, stop loss at 96,800 area, the first target is 95,300 area, and the second target is 95,000 area;

To be one of the best in trading BTC - BTC HTF HL Hypothesis Price closed below the support-level on the 1D (red line) ----> price should come back to these lows.
Price closed above the resistance-level on the 1D (green line) ----> price should SFP the lows
-----------------------------------------
I expect (or should I say: hope?) price to do a MSB here, meaning: price coming below all that structure below the green level. This will provide a short setup to the dashed line where the TP and spot limit buy orders are 'rested'.
To be one of the best in trading BTC.

BTC Breakdown Alert: Eyes on 94,900. Possible?BTC is currently at 96,565 and showing signs of potential downside; if it breaks below the key support level of 96,151, it could drop further toward 94,900 or even lower.

BTC correction scalp... Possible...?BTC is currently at 96,565 and showing signs of potential downside; if it breaks below the key support level of 96,151, it could drop further toward 94,900 or even lower.
Manage your risk.
Thanks 👍

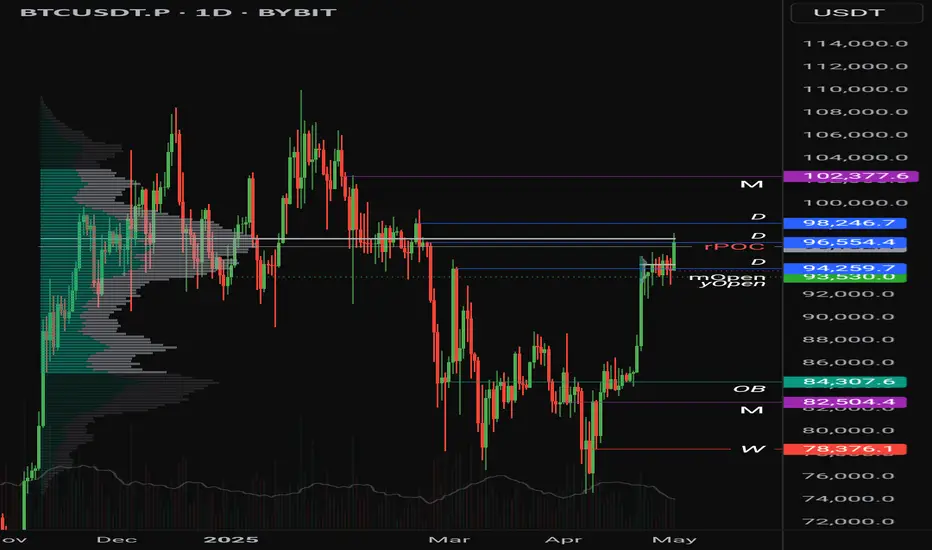
Current btc rangeComing into range point of control, have some levels above and below depending on the future action
BITCOIN ON FIRE.BINANCE:BTCUSDT.P , the bulls have regain back their strength and power, is there anything that can stop BTC from going back to 100kxx?? so as it stands, BTC will touch 107k before we can get any special threats from team bearish. BTC ATH loading.

Bitcoin Wave Analysis – 1 May 2025
- Bitcoin broke key resistance level 95000.00
- Likely to rise to resistance level 99300.00
Bitcoin cryptocurrency recently broke the resistance zone between the key resistance level 95000.00 (which stopped the previous wave B at the end of April) and the 61.8% Fibonacci correction of the downward impulse from January.
The breakout of this resistance zone should strengthen the bullish pressure on Bitcoin.
Bitcoin can be expected to rise to the next resistance level 99300.00, which reversed the price multiple times in February.

[LONG] BTCUSDT - Binance | BTC Moon ?Welcome,
- Status: 📈 Long
- BTC in action
- TP: I have 5 TP, the last 20% depend on you
- SL: When TP 1 is met, move SL to the entry position for FREE RISK. After the next TP is met, use Trailing Stop.
Keep wait..
Lets see..

BTC Inverse H&S PatternAs predicted initially . Price found support at a higher level around the neckline (75K demand zone) and the bullish up trend continues.
Text book inverse head and shoulders pattern.
Next stop : 130K

Bitcoin ABC correction in WeeklyI think BTC is actually printing an ABC correction in Weekly after a 1-2-3-4-5 wave run as shown.
Fasten your seatbelts boys.

Btcusdt Btc ranges btw a support and a resistance, a break above could lead to GETTEX:98K BTC price while a break below could lead to a GETTEX:92K btc


MARKET IS BOREDPlease call Bogdanoff ASAP, because this asshit market got bored and will be wrecked soon. Wall Street has no money to get over current resistance — this means we go back.
Way down we go.

BTC doing a 1.618 means altcoin season is on🔥 Why 1.618 on BTC = Altcoin Season Coming
The 1.618 Fib extension is a common target for wave 3 or wave 5 in Elliott Wave theory. Once BTC hits it:
Many traders start taking profit on BTC.
That capital usually flows into ETH and major alts, then mid/small caps.
BTC dominance often peaks or stalls after hitting 1.618, which historically signals:
ETH/BTC starts rising
Altcoins gain strength against BTC and USDT
Retail and sidelined liquidity get attracted by BTC gains, but then chase faster % returns in alts.
🧠 Example Playbook
BTC breaks out → Runs hard → Hits 1.618 (e.g., from last correction low to current high)
ETH/BTC bottoms → ETH/USDT starts to run
Majors like SOL, AVAX, MATIC, DOT follow
Mid/small caps explode last (aka “altseason” proper)
