TradeCityPro | Bitcoin Daily Analysis #88👋 Welcome to TradeCity Pro!
Let’s dive into the analysis of Bitcoin and key crypto indexes. As usual, in this analysis I want to review the futures triggers for the New York session.
⏳ 1-Hour Timeframe
In the 1-hour timeframe, as you can see, Bitcoin has formed a slightly better structure and it seems to be undergoing a trend-aligned correction.
✔️ A trend-aligned correction happens when the market enters a corrective phase, but the sellers are so weak that they can’t even stop the price from rising during the correction, and the price gradually moves upward.
🔑 In this case, since the market is in a corrective phase, if we enter with a tight stop loss, we are likely to get stopped out due to the nature of corrections. So it's better to open positions with a wider stop loss so it doesn't get triggered easily.
📊 One thing to note on the current Bitcoin chart is that we are very close to its most important resistance at 106247. This zone is a very strong supply area, and I think breaking through it won’t be easy.
⚡️ So for now, I suggest not opening any new positions on Bitcoin and instead using dominance charts to open positions on altcoins.
📈 If you already have an open position, I recommend keeping your Bitcoin position open, because if 106247 breaks, your position could become highly profitable.
👑 BTC.D Analysis
Let’s move on to Bitcoin dominance. Yesterday, after breaking the 63.61 level, there was another downward leg down to the 62.65 area, and altcoins made another upward move.
⭐ Currently, the dominance is correcting and has risen to the 63.29 area. I think it’s going through a slight correction since its drop was sharp and needs a bit of a breather.
💥 However, if the 62.65 low gets broken, we can take it as confirmation of the next bearish leg, and if that happens, we can again open positions on altcoins.
📅 Total2 Analysis
Now to the Total2 analysis. Yesterday, this index got rejected from the 1.24 top and slightly corrected, but it hasn’t reached the 1.17 area which overlaps with the 0.236 Fibonacci level, so we still haven’t confirmed the start of a correction.
✨ In my opinion, as long as we stay above the 0.382 level, the uptrend remains strong. Only after breaking below this area will we confirm the start of a deeper correction.
🔼 For continuation of the trend, breaking above 1.24 would allow us to open positions on altcoins.
📅 USDT.D Analysis
Now to Tether dominance. This index also broke below 4.63 yesterday and dropped to 4.51, and is currently correcting.
🧩 To get confirmation from Tether dominance, a break below 4.51 would signal that we can open long positions on altcoins.
🎲 The simultaneous break of 4.51 and 1.24 could be a strong confirmation if dominance continues to decline.
❌ Disclaimer ❌
Trading futures is highly risky and dangerous. If you're not an expert, these triggers may not be suitable for you. You should first learn risk and capital management. You can also use the educational content from this channel.
Finally, these triggers reflect my personal opinions on price action, and the market may move completely against this analysis. So, do your own research before opening any position.
BTCUPUSDT trade ideas

TradeCityPro | Bitcoin Daily Analysis #89👋 Welcome to TradeCity Pro!
Let’s dive into the Bitcoin analysis and key crypto indexes. As usual, in this analysis I’ll go over the futures triggers for the New York session.
⏳ 1-Hour Timeframe
In the 1-hour timeframe, as you can see, Bitcoin is still below the 104866 resistance level and is ranging underneath this zone.
💥 Today, an important news update came from Trump: a deal has been made between China and the U.S., and the two countries have agreed to reduce tariffs for 90 days.
✔️ The impact of this news was that Bitcoin made a wick toward 106247 but didn’t reach it, pulled back, and is now again below the 104866 area.
✨ At the moment, the 104866 level is a suitable trigger for opening a position, but be aware that there’s a significant resistance zone at 106247. Personally, I won’t open a position just on the break of 104866 because it's very close to the ATH zone, and the probability of entering a corrective phase is high.
⚡️ If a correction begins, the first support level for price is at 102391. If the RSI stabilizes below 50, the likelihood of a correction increases.
🔽 As for short positions, we should wait until the market shows a trend reversal.
👑 BTC.D Analysis
Now let’s look at Bitcoin dominance. Yesterday, the dominance chart made a slight upward correction and is now breaking below the 62.65 low.
🧩 If the downward move in dominance continues, altcoins could make another leg upward. The next support for dominance is at 62.17.
📅 Total2 Analysis
Now for the Total2 analysis. The 1.24 area, which was our long trigger, is being broken—and if it confirms, the price could rise up to 1.31.
⭐ This confirmation, along with the drop in Bitcoin dominance, could give us good long setups on altcoins.
📅 USDT.D Analysis
Now to Tether dominance. This index hasn’t triggered yet and is currently sitting at the 4.51 support. If this index also confirms a bearish move, the risk of opening long positions will be much lower.
💫 The next support level for Tether dominance is at 4.37.
❌ Disclaimer ❌
Trading futures is highly risky and dangerous. If you're not an expert, these triggers may not be suitable for you. You should first learn risk and capital management. You can also use the educational content from this channel.
Finally, these triggers reflect my personal opinions on price action, and the market may move completely against this analysis. So, do your own research before opening any position.

Bitcoin Still Stuck in Resistance – Eyes on CME Gaps & USDT.D%Bitcoin ( BINANCE:BTCUSDT ) touched $92,830(first target) and started to rise as I expected in the previous idea . Overall, Bitcoin has been moving in a range for about 12 days .
Note : In general, trading in a range market is more difficult than in a trending market . If your performance in a range market is not good, it is better not to trade until the trend is clear (this is just a suggestion).
Bitcoin is currently trading at a Heavy Resistance zone($95,950-$88,500) and has failed to break through it, and it seems like Bitcoin needs more momentum to break through this zone. Do you think Bitcoin will finally break through the Heavy Resistance zone($95,950-$88,500)?
In terms of Elliott Wave theory , it appears that Bitcoin has completed a five-wave impulsive and we should expect Corrective waves .
The analytical conditions of the Bitcoin chart have been a bit ambiguous in the past few days, so it's better to take a look at the USDT.D% ( CRYPTOCAP:USDT.D ) chart to increase the accuracy of Bitcoin analysis .
USDT.D% failed to break the Support zone(5.13%-4.95%) after several attacks. It currently appears to be forming an Ascending Broadening Wedge Pattern . It appears that USDT.D% needs to complete this pattern to break the support zone, and if this pattern fails , we should expect further increases =Bitcoin crash .
I expect Bitcoin to decline to the Support zone($92,910-$91,414) , 21_SMA(Weekly) and Cumulative Long Liquidation Leverage($93,359-$92,296) and probably fill the CME Gap($92,525-$91,415) this time and then start to rise and prepare to break the Heavy Resistance zone($95,950-$88,500) and fill the CME Gap($97,680-$96,455) .
Cumulative Short Liquidation Leverage: $98,989-$97,924
Note: If Bitcoin breaks below the Support zone($92,910-$91,414), we should expect further declines.
Please respect each other's ideas and express them politely if you agree or disagree.
Bitcoin Analyze (BTCUSDT), 1-hour time frame.
Be sure to follow the updated ideas.
Do not forget to put a Stop loss for your positions (For every position you want to open).
Please follow your strategy and updates; this is just my Idea, and I will gladly see your ideas in this post.
Please do not forget the ✅' like '✅ button 🙏😊 & Share it with your friends; thanks, and Trade safe.

BTCUSDT latest analysis strategy- Completed " 1234 " Impulsive Waves
- Break of Structure
- RSI - Divergence
- Bullish Channel as an corrective pattern in Short Time Frame
- Point of Interest

Bitcoin at PRZ! Is This the Calm Before a Drop?As I expected in yesterday's idea , Bitcoin ( BINANCE:BTCUSDT ) started to rise from near the Support line and hit the Target .
Bitcoin is trading near the Potential Reversal Zone(PRZ) , the upper line of the ascending channel(minor) , and the Resistance line .
In terms of Elliott Wave theory , it seems that Bitcoin has successfully completed the microwave B of the main wave 4 in the ascending channel(minor). A break of the lower line of the ascending channel(minor) could be a sign of the completion of this wave. The corrective structure of the main wave 4 so far could be a Zigzag(ABC/5-3-5) .
I expect Bitcoin to drop to at least $100,923 AFTER breaking the lower line of the ascending channel(minor) and breaking the Support line, the next target could be the lower line of the ascending channel(major) .
Cumulative Short Liquidation Leverage: $106,943-$105,913
Cumulative Short Liquidation Leverage: $105,525-$104,500
Cumulative Long Liquidation Leverage: $100,763-$99,774
Note: If Bitcoin goes above $105,300, we can expect more pumps.
Note: If Bitcoin touches $99,400, we should expect further declines.
Please respect each other's ideas and express them politely if you agree or disagree.
Bitcoin Analyze (BTCUSDT), 1-hour time frame.
Be sure to follow the updated ideas.
Do not forget to put a Stop loss for your positions (For every position you want to open).
Please follow your strategy and updates; this is just my Idea, and I will gladly see your ideas in this post.
Please do not forget the ✅' like'✅ button 🙏😊 & Share it with your friends; thanks, and Trade safe.

BTCUSD – Multi-TF Bearish SFP & Fib Retrace Before ATH Rebound
Bearish SFP printed on 4H / 8H / 12H / 1D at $103 345 – $104 985 after a parabolic ~$94 k → $104 k run and multiple rejections at $104 k–$106 k resistance.
Trump tariff-cut announcement sparked a sharp spike into resistance that was quickly sold off, confirming heavy supply at $104 k – $106 k.
Baseline plan: drop to 0.786 Fib ~$102 586, then 0.618 Fib ~$100 613, before a push toward the ATH ~$109 588.
Trade Setups
Short – SFP Breakdown
Trigger: 4H close below $103 345
Entry: ≈ $103 300 on retest
SL: $105 500 (above swing high)
TP1: 0.786 Fib ≈ $102 586 RR ≈ 0.7
TP2: 0.618 Fib ≈ $100 613 RR ≈ 2.6
Long – Fib Rebound
Trigger: Bullish reversal at 0.618 Fib / FVG cluster ≈ $100 613
SL: $99 300 (below FVG)
TP1: SFP top / range high ≈ $104 145 RR ≈ 2.7
TP2: ATH ≈ $109 588 RR ≈ 6.8

Lingrid | BTCUSDT potential PATHWAY to New All-Time HIGHBINANCE:BTCUSDT is testing the upper boundary of its breakout structure after reclaiming the $100,000 level and pushing above the blue upward trendline. The broader uptrend remains intact as price forms a higher low within the ascending channel and sets sights on fresh highs. Price action remains bullish with room for upside continuation if BTC holds above the breakout zone.
📌 Key Levels
Support zone: $98,000 - $100,000 (prior breakout and trendline retest)
Breakout target: $118,760 (resistance area top)
Invalidation level: Below $98,000 (break of structure + channel midline)
⚠️ Risks
Strong resistance lies just above ATH; could lead to rejection
Consolidation under resistance may delay breakout
Weekly close below $100,000 could shift momentum short-term
Traders, if you liked this idea or if you have your own opinion about it, write in the comments. I will be glad 👩💻

BTCUSDT Technical Analysis📊 BTCUSDT Technical Analysis – May 11, 2025
Hello traders! 👋
Here’s a fresh technical analysis on the BTC/USDT pair using the 1D timeframe. The chart highlights key supply and demand zones, harmonic structure, and two potential price scenarios for the coming weeks.
📌 Key Levels:
Support Zone: 86,191 – 88,909 USDT
Mid-Resistance: 91,978 USDT
Major Resistance Area: 105,371 – 108,458 USDT
🔍 Technical Overview:
After forming a strong bottom around 76,560, BTC reversed and surged upwards, filling the Fair Value Gap (FVG) created earlier.
Price is now testing a critical supply zone. A rejection from here may lead to a pullback, possibly toward the 86k–89k range.
If the support zone holds, it may act as a springboard for a new bullish wave targeting 105k and beyond.
🧭 Possible Scenarios:
Rejection at Resistance: Consolidation or pullback from the 105k–108k zone followed by downward movement.
Support Bounce: Rebound from 86k–89k support area leading to renewed bullish momentum.
Sideways Action: Short-term consolidation in the current price range before direction is confirmed.
💬 What’s your outlook for BTC at this stage? Are you expecting a breakout or a pullback? Share your thoughts in the comments!
🔔 Stay tuned for more updates and trade safely!

my idea about btc in secound half of 2025Dear followers,
I’ve analyzed BTC’s recent price movements and on-chain indicators, and I’d like to share my outlook for the second half of 2025. Based on my technical and macroeconomic assessment, I anticipate a significant correction before a strong rebound later in the year.
Key Highlights:
Sell Zone: I expect BTC to reach around $108,000 during a bullish run, where I recommend taking profits and initiating a short position.
Correction Phase: Following the peak, I foresee a correction bringing BTC down to approximately $69,000. This presents a deep buy opportunity for those looking to accumulate at lower levels.
Target for Rebound: Post-correction, I project a strong rally towards $140,000, driven by renewed institutional interest and market fundamentals.
Trading Strategy:
Consider selling or reducing holdings near the $108K level.
Be prepared to accumulate during the dip around $69K.
Aim for the $140K target on the rebound, aligned with overall bullish momentum.
Please note that all trading involves risk, and it's essential to manage your positions carefully. Stay tuned for updates, and always do your own research before making trading decisions.
Let me know your thoughts or if you'd like a deeper analysis!

HelenP. I Bitcoin may continue to grow inside upward channelHi folks today I'm prepared for you Bitcoin analytics. After bouncing from the lower boundary of the ascending channel and reacting strongly from the support zone near 92000, the price continues to respect the bullish structure. This level, which also aligns with the dynamic trend line, has acted as a powerful area of interest for buyers. Every touch to the trend line has resulted in a reversal to the upside, and this time may be no different. Previously, we saw a clear upward impulse that formed the base of the current trend channel. Then the market entered a consolidation with smaller pullbacks and held the 93000 zone with confidence. The recent retracement toward the trend line and support area is forming a higher low, which confirms buyer strength and sets the stage for another bullish leg. Given the strong support zone, the presence of an upward channel, and the steady bullish structure, I expect BTC to resume its upward move. My current goal is 99000 points. All elements signal bullish continuation. If you like my analytics you may support me with your like/comment ❤️

MACD: More Than Just a Crossover ToolHello, traders! 🔥
The MACD (Moving Average Convergence Divergence) indicator is one of the most trusted tools in technical analysis — but often one of the most oversimplified. While many traders focus on signal line crossovers, the real power of MACD lies in its ability to visualize market momentum, subtle shifts in trend strength, and early signs of potential reversals.
Let’s unpack how MACD behaves using the weekly BTC/USDT chart ✍🏻.
🔧 Understanding the Mechanics
At its core, MACD is the difference between two exponential moving averages — typically the 12-period EMA and the 26-period EMA. The result is the MACD line (blue). The orange line represents a 9-period Exponential Moving Average (EMA) of the MACD line, commonly referred to as the signal line. The histogram reflects the distance between them, helping to visualize when momentum is building or fading.
📊 MACD in Action — Weekly BTC Chart Breakdown
Looking at the BTC/USDT weekly chart, several notable MACD behaviors stand out:
1. The Bullish Acceleration in Early 2023
In early 2023, MACD crossed above the signal line, accompanied by a sharp rise in the histogram. This indicated strong positive momentum, as the price began recovering from the 2022 lows. The histogram’s expansion confirmed increasing divergence between the short- and long-term EMAs — a classic sign of trend acceleration.
2. Peak Momentum in Late 2023
Around late 2023, the MACD line peaked while the histogram also reached maximum height. This wasn’t just a confirmation of strength — it also hinted that momentum may have reached a climax. Despite price continuing to rise slightly, the MACD curve started to flatten — an early warning of potential exhaustion in trend strength.
3. Bearish Convergence into Q1 2025
In early 2025, the MACD line turned downward and eventually crossed below the signal line, while the histogram flipped to red. This reflected a cooldown in bullish momentum rather than an immediate reversal. What’s notable is how price didn’t collapse sharply, but moved into a pullback phase — illustrating how MACD can show momentum softening before price visibly reacts.
📌 What This Can Tells Us
The MACD indicator on this weekly BTC chart shows how momentum often shifts before the trend itself breaks. Each crossover, divergence, or histogram change is not a guarantee, but a cue to pay closer attention.
Key takeaways:
Strong Histogram Expansion = Confidence in the Current Move.
Peaks in MACD Without Price Making New Highs = Potential Divergence.
Shrinking Histogram + Converging Lines = Momentum Stalling.
🧠 Final Thought
MACD isn’t just about “buy when it crosses” or “sell on red bars.” It’s a narrative tool, showing how the story of the price develops beneath the surface. On higher timeframes, such as the weekly chart, it can potentially highlight macro momentum shifts long before they become apparent in price action alone.

TradeCityPro | Bitcoin Daily Analysis #90👋 Welcome to TradeCity Pro!
Let’s dive into Bitcoin and major crypto indices analysis. As usual, I’ll walk you through the key triggers for the New York futures session.
⏳ 1-Hour Timeframe
As you can see, the price has found support at the 101,628 level and is now moving back up toward the 104,866 resistance.
⭐ The first trigger for a long position was the breakout of 102,882, which confirmed the activation of a double bottom pattern and could’ve been a good entry point for a long.
✔️ The next key triggers are at 104,866 and 106,247. If you don’t already have a position open, you can enter on a breakout above these levels—but keep in mind it’s risky since there’s a strong supply zone nearby.
💥 From the RSI oscillator, a breakout above 57.41 can serve as confirmation of bullish momentum. In that case, you can take on more risk in long positions.
📉 For short positions, the first trigger is the breakdown of 101,628. If the price sets a lower high below 104,866, you can consider entering a short on the break of 101,628.
👑 BTC.D Analysis
Moving on to Bitcoin dominance—yesterday, dominance made a fakeout to the downside but came back above 62.65.
⚡️ To continue its downtrend, we can use 62.65 as the bearish trigger again. For a bullish confirmation, the next trigger is a breakout above 63.61.
📅 Total2 Analysis
Total2 had a pullback to 1.18 and is now heading back toward 1.24.
✨ We’ll confirm bullish continuation on a breakout above 1.24, and this can be used as a trigger for long positions.
🔽 For shorts, if the price prints a lower high under 1.24, a risky short could be considered on a breakdown below 1.18.
📅 USDT.D Analysis
Now looking at Tether dominance—like I mentioned yesterday, we were watching the 4.51 level for confirmation. That level held as support and blocked further Bitcoin upside.
🔔 Currently, a breakdown below 4.51 would confirm bearish continuation. If 4.70 breaks to the upside instead, we get confirmation of a deeper market correction.
❌ Disclaimer ❌
Trading futures is highly risky and dangerous. If you're not an expert, these triggers may not be suitable for you. You should first learn risk and capital management. You can also use the educational content from this channel.
Finally, these triggers reflect my personal opinions on price action, and the market may move completely against this analysis. So, do your own research before opening any position.

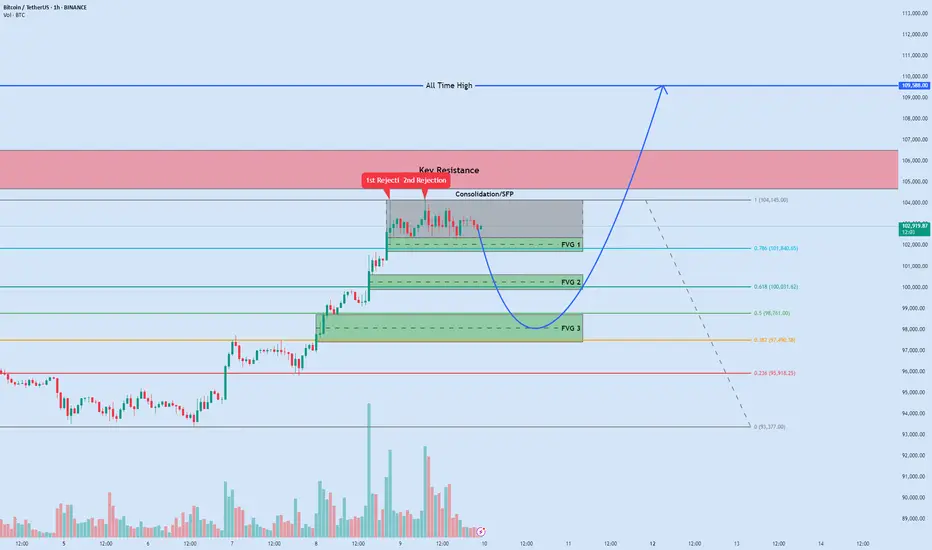
BTC: Potential Dip into FVGs Before New ATHBitcoin has rocketed from ~$94 000 to ~$103 250 in just days and is now consolidating between $102 364–$104 145. A Swing Failure Pattern at the top suggests a corrective pullback into one of three Fair Value Gaps aligned with key Fibonacci retracements, before the next leg up toward a fresh all-time high. This setup uses structure, inefficiency zones, and Fib levels to pinpoint high-probability entries.
📊 Chart Breakdown
1. Current Picture: Consolidation & Warning ⚠️
- Range: $102 364 – $104 145
- Swing Failure Pattern (SFP): Price briefly wicks above $104 145 to grab liquidity, then reverses. This classic liquidity hunt often precedes a deeper retrace as late bulls are stopped out.
2. Fair Value Gaps (FVGs) – Untested Support Zones 🌊
FVGs are rapid imbalance areas where price left gaps in the order book. These zones act like magnets, drawing price back to “fill” inefficiencies.
FVG 1 (Nearest): $101 700 – $102 364
FVG 2 (Mid-Zone): $99 900 – $100 600
FVG 3 (Deepest): $97 400 – $98 700
3. Fibonacci Confluences (from $93 377 → $104 145) 📏
Fibonacci retracement levels often align with FVGs to form confluence support—ideal for swing entries.
0.786 Fib @ $101 840.65: Sits squarely in FVG 1, a high-probability bounce zone.
0.618 Fib @ $100 031.62: Golden Ratio within FVG 2, offering strong support.
0.5 Fib @ $98 761 & 0.382 Fib @ $97 490.38: Cover top and mid-lower FVG 3 for a deep corrective entry.
📈📉 Navigating the Next Moves: Key Trade Scenarios 🧭
Given the current structure, with the SFP indicating a potential short-term top and strong FVG/Fibonacci confluences below, here are two primary scenarios we can watch for:
Scenario 1: The Short-Term Pullback Play (Short Position 📉🐻)
Concept: Capitalizing on the SFP at the consolidation high (~$104,145) to trade the anticipated dip towards the FVG/Fibonacci support clusters.
Aggressive Entry: Look for entries around $103,500 – $103,900 if price retests the upper part of the consolidation after the SFP, showing weakness.
Conservative Entry: A break below the consolidation low (~$102,364) could offer a confirmation entry, potentially on a retest of this broken level as resistance.
Stop-Loss 🛑: Place above the SFP high, e.g., $104,450 – $104,650, to protect against a false breakdown.
Profit Targets (FVG Zones) 🎯
TP1: The top of FVG 1 / 0.786 Fib area (~$102,300 – $101,840). This zone is critical.
TP2: The FVG 2 / 0.618 Fib area (~$100,600 – $100,030) if TP1 is breached with momentum.
Trade Management & Considerations 🤔:
Entry Confirmation: Watch for bearish price action on lower timeframes (e.g., 15m/1H rejection wicks, bearish engulfing) near the SFP high.
Profit Taking: Consider taking partial profits at TP1. The reaction here is crucial.
Reversal/Close Short: If price enters TP1 and shows strong bullish rejection (large wicks, engulfing bull candles, volume spike), close the short and prepare to flip to the long scenario.
Holding for TP2: If price slices through TP1 with sustained bearish pressure, trail your stop above TP1 once it’s clearly broken.
Invalidation: If price reclaims and holds above $104,650, the short thesis is invalidated.
Scenario 2: The FVG Rebound & Rally (Long Position 📈🐂)
Concept: Entering on the expectation that one of the FVG/Fibonacci confluence zones will hold as support, leading to a rebound and continuation of the larger uptrend.
Potential Entry Zones 📍:
Zone A (Primary): FVG 1 / 0.786 Fib area ($101,700 – $102,364, sweet spot ~$101,840).
Zone B (Secondary): FVG 2 / 0.618 Fib area ($99,900 – $100,600, sweet spot ~$100,030).
Stop-Loss 🛑:
If entering in Zone A: Place below FVG 1, e.g., $101,350 – $101,150.
If entering in Zone B: Place below FVG 2, e.g., $99,600 – $99,400.
Profit Targets 🎯:
TP1: Back to the consolidation high / SFP area (~$104,145).
TP2: The key resistance zone ($104,675 – $106,500).
TP3 (Ultimate): The All-Time High ($109,588).
Trade Management & Considerations 🤔:
Entry Confirmation: Do not blindly enter. Wait for price to enter your chosen FVG zone AND then show clear bullish confirmation on lower timeframes (e.g., 1H/4H bullish engulfing, hammer, RSI divergence).
Zone Prioritization: Zone A is the first test. If it fails and breaks down, Zone B becomes the next area of interest.
Profit Taking & Scaling Out: Take partial profits at TP1 and again at TP2 to secure gains.
Risk Reduction: After TP1 is hit, move your stop-loss to breakeven or slightly in profit.
Invalidation: A decisive break below $99,400 invalidates the bounce thesis and suggests a deeper correction.
🎯 Execution Notes
- Patience & Confirmation: Avoid “blind” entries. Seek volume confirmation and clear reversal candle patterns on 1H/4H charts.
- Risk Management: Define stops before entry and size positions to risk no more than 1–2% per trade.
- Additional Signals: Watch for bullish RSI/RSI-MFI divergences or a turn in on-balance volume at support zones.
Disclaimer: This is for educational/informational purposes only and not financial advice. Crypto trading carries high risk—always DYOR and consult a qualified advisor.
What’s your take? Which FVG/Fib level will hold? Share your insights below!
BTC/USD) bullish trend analysis Read The ChaptianSMC Trading point update
Technical(BTC/USDT) analysis outlines a bullish outlook with key technical levels and scenarios. Here's a breakdown of the idea:
Key Observations:
1. Trend Break and CHoCH (Change of Character):
The chart shows a clear break of the downtrend, confirmed by the CHoCH label — a common Smart Money Concept (SMC) signal indicating a potential trend reversal from bearish to bullish.
2. Key Zones Highlighted:
EVC-Buying Zone: Around 86,000 – 88,000 (aligned with EMA 200), marked as a strong accumulation area.
New Support Level: Around 92,000 – 93,000, potentially forming a bullish support after the recent rally.
Resistance Levels: Two major resistance zones near:
99,600 (intermediate resistance and target)
106,400 (final target)
3. RSI Indicator:
RSI is near 64, indicating strong momentum but not yet overbought — a potential sign of further upside.
4. Two Bullish Scenarios:
Scenario 1 (Aggressive Bullish): BTC continues upward from the current level and breaks above resistance toward the 106,447 target.
Scenario 2 (Retracement Bullish): BTC dips to the new support or even into the buying zone (86–88k), then rebounds to reach the same targets.
Mr SMC Trading point
---
Idea Summary:
The chart suggests bullish continuation, with potential pullbacks into strong demand zones. It supports both breakout and retracement entries, with targets at 99,632 and 106,447. If price holds above EMA 200 and RSI remains supportive, the upside thesis remains valid.
Pales support boost 🚀 analysis follow)

BTC - New Short-Term Long!Hello TradingView Family / Fellow Traders. This is Richard, also known as theSignalyst.
📈BTC has been overall bullish trading within the rising channel marked in blue.
Moreover, the green zone is a strong demand and structure.
🏹 Thus, the highlighted blue circle is a strong area to look for buy setups as it is the intersection of structure and lower blue trendline acting non-horizontal support.
📚 As per my trading style:
As #BTC retests the blue circle zone, I will be looking for bullish reversal setups (like a double bottom pattern, trendline break , and so on...)
📚 Always follow your trading plan regarding entry, risk management, and trade management.
Good luck!
All Strategies Are Good; If Managed Properly!
~Rich

Bitcoin (BTC): What Are We Expecting From Markets Now?Bitcoin might be heading towards the ATH area of $109K, where we are expecting to see a correctional movement to the $93K area.
More in-depth info is in the video—enjoy!
Swallow Academy

Bitcoin BTC price analysis - READ the text !There was some positive news: "The US and China have agreed to reduce tariffs for 90 days."
The price of CRYPTOCAP:BTC has entered the zone of total sales - $105-110 thousand.
🕯 Metrics show that large wallets are now opening short positions worth hundreds of millions of dollars, and on the other hand, no less large wallets that organized this rebound in the OKX:BTCUSDT price are very tempted to launch the final stage of cascading liquidations of shorts.
🍿 So, stock up on popcorn - it's going to be "fun" today/tomorrow, and then we'll go to the stronger side!)
Globally, before the growth wave begins, we want to see the final "shake-up" of the longs who have survived everything and still held their positions and didn't give up.
1️⃣ Weak correction in the range of $90-91k - to close the GAP that formed on this rebound and then continue to confidently update ATH with a clear conscience.
2️⃣ A strong correction to the range of $80-82k - during which it will be very interesting to watch the capital flow and dominance.
Which scenario is closer to your heart? Write in the comments!
_____________________
Did you like our analysis? Leave a comment, like, and follow to get more

BTC Short Setup – High Leverage Precision Trade (30x)Description:
Shorting BTC with a tight strategy and calculated risk:
Entry: $105,200
Leverage: 30x
Margin: $400
🎯 Targets:
TP1: $104,600 → Book 25%
TP2: $102,800 → Book 50%
TP3: $10,000 → Close Remaining
⚠️ High-risk, high-reward play. Use proper risk management.

Mastering Order Blocks: How to Trade Like Smart MoneyIntroduction
Order Blocks (OBs) are one of the most critical concepts in Smart Money trading. They represent areas where institutional traders have entered the market with significant volume, typically leading to strong price movements. Identifying and trading Order Blocks gives traders an edge by aligning with the footprints of Smart Money.
What is an Order Block?
An Order Block is the last bearish candle before a bullish move for bullish OBs, or the last bullish candle before a bearish move for bearish OBs. These candles represent areas where institutions accumulated or distributed large positions, leading to a market shift.
Types of Order Blocks
A Bullish Order Block appears at the end of a downtrend or during a retracement just before the price moves sharply upward. It is typically represented by the last bearish candle prior to an impulsive bullish move. Price will often return to this level to mitigate institutional orders before continuing upward.
A Bearish Order Block, in contrast, forms at the end of an uptrend or retracement where price begins a downward reversal. It is characterized by the last bullish candle before a strong bearish move. Price tends to revisit this level to mitigate before continuing lower.
How to Identify a Valid Order Block
The key to identifying a valid Order Block is first observing a strong impulsive move, also known as displacement, that follows the OB candle. The move must also result in a break of market structure or a significant shift in direction. Order Blocks that produce Fair Value Gaps (FVGs) or Market Structure Shifts (MSS) tend to be more reliable. Another important sign is when price returns to the OB for mitigation, offering a potential entry.
Entry Model Using Order Blocks
After locating a valid OB, the next step is to wait for price to return to this area. The ideal entry happens within the OB body or near its 50% level. For extra confirmation, look for a Market Structure Shift or Break of Structure on a lower timeframe. Entries are more powerful when combined with additional elements like Fair Value Gaps, liquidity grabs, or SMT Divergences. The stop-loss should be placed just beyond the OB’s high or low, depending on the direction of the trade.
Refinement Techniques
To increase precision, higher timeframe OBs can be refined by zooming into lower timeframes like the 1M or 5M chart. Within a broad OB zone, identify internal market structure, displacement candles, or embedded FVGs to determine a more precise entry point. One effective refinement is the Optimal Trade Entry (OTE), which is often found at the 50% level of the Order Block.
Order Blocks vs. Supply and Demand Zones
While they may seem similar, Order Blocks are more narrowly defined and specifically related to institutional order flow. Supply and Demand zones are broader and typically drawn around areas of price reaction, but OBs are derived from the final institutional candle before a large move and are often confirmed by structure shifts or displacement. This makes OBs more precise and actionable in the context of Smart Money concepts.
Target Setting from Order Blocks
Targets after entering from an OB should align with liquidity objectives. Common targets include internal liquidity like equal highs or lows, or consolidation zones just beyond the OB. External liquidity targets such as previous major swing highs or lows are also ideal, especially when they align with imbalances or Fair Value Gaps. It's important to adjust targets based on the current market structure and trading session.
Common Mistakes to Avoid
A frequent mistake is treating any candle before a move as an OB without verifying key signals like displacement or a Break of Structure. Entering without other confirmations, such as an MSS or liquidity sweep, can lead to poor trades. Another common error is placing the stop-loss too tightly within the OB, instead of just beyond it, increasing the chance of premature stop-outs. Traders should also avoid executing OB trades during low-liquidity sessions where price action can be unpredictable and wicky.
Final Thoughts
Order Blocks are foundational to Smart Money trading. They allow you to enter where institutions have placed large positions and offer clear invalidation and entry logic. With practice, you can identify high-quality OBs and combine them with other concepts like FVGs, MSS, and SMT for powerful, precise trades.
Practice on different timeframes and assets, and always look for clean displacement and structure confirmation. Mastering OBs is a big step toward becoming a consistently profitable trader.
Trust the Blocks. Trade with Intention.

Bitcoin ($BTC) Technical Outlook – Weekly Chart
As long as BTC holds above the $90K–$93K support range, the structure remains bullish with strong upside potential. The $124K and $146K levels represent logical Fibonacci-based extension targets for the next macro leg.
🎯 Target Levels:
T1: $124,147
T2: $146,303
@RosePremiumm

BTC SHORT to 65k5 waves completed, A and B completed, time for the C leg, bearish daily OB at the premium 0.78 zone, everybody waiting for ATH FOMO
I've got my entry at $104.426, SL above the OB $105.900, TP $66.000 in 2/3 months.


Bitcoin (BTC): We Reached Liquidity Line | Important Zone!Once again, Trump is at his finest, tweeting about another economic news (major trade deals), which pushed decent volatility into the markets, which led Bitcoin to an important liquidity zone near the $100K area.
We are going to monitor this zone now and once we see any clear signs of proper breakout or rejection, we will be looking for direction based on reaction, but as of now we are stuck at that area so as long as we have not broken it fully, we are looking for rejection from here. Let's see.
Swallow Academy
