$BTC to $100k or $87k, which comes first?Today's move seems like a bull trap, a healthy correction to GETTEX:87K before $100k should do it
BTCUPUSDT trade ideas

TradeCityPro | Bitcoin Daily Analysis #75👋 Welcome to TradeCity Pro!
Let’s move on to Bitcoin and major crypto index analysis. As usual, in this analysis, I want to review the triggers for the New York futures session for you.
🔄 Yesterday's Analysis
In yesterday's analysis, I told you that if the price stabilizes below 93626, I expect a correction down to 91945.
However, this didn’t happen and the price faked below this area and moved back up, and now its trigger has been activated.
Let’s move on to today’s analysis to see what triggers are suitable for today.
⏳ 1-Hour Timeframe
In the 1-hour timeframe, as I said, the price faked downwards and moved up again, activating the first trigger at 94421.
The 94421 trigger was a preliminary trigger for the breakout of 95306, so if you opened this position, I suggest you wait to see if the price breaks the 95306 resistance or not.
✔️ The main trigger for a long position is still the breakout of 95306, which can start the next bullish leg for Bitcoin.
If you plan to open a position upon the breakout of this area, pay attention to the volume, and if volume increases at the same time, I suggest you definitely have a position.
💥 In the RSI oscillator, as you can see, the divergence we had in the previous bullish leg has been activated, and we can see its effect in the market, and now a new structure is forming, getting close to the Overbuy area.
⚡️ If RSI enters Overbuy and the 95306 resistance is broken, we could see a sharp and fast move toward the 98828 resistance.
📉 For a short position and for Bitcoin’s trend to turn bearish, yesterday I told you we have a risky trigger at the break of 93626, but I personally wouldn’t open a position with this trigger because it’s risky and I prefer to wait for a confirmed trend change.
🔍 Currently, the trigger I have for a trend change in Bitcoin is the break of 91945 and forming a lower high and lower low below this level. Otherwise, we should wait to see if a new structure for a trend change forms in the coming days.
👑 BTC.D Analysis
Let’s move on to Bitcoin Dominance analysis.
As you can see, Dominance has finally exited the range it had formed between 64.19 and 64.41, breaking 64.19 and moving downward.
🧩 If this decline continues, the next major support area for Dominance is 63.67, and Dominance could fall to this level.
If this happens simultaneously with Bitcoin’s rise, altcoins could experience a lot of sharp bullish moves.
📅 Total2 Analysis
Let’s move on to Total2 analysis.
As you can see, this index also faked the floor it had formed, and this fake breakout has brought bullish momentum into the market, and now it has managed to stabilize above 1.05.
⭐ The reason Bitcoin is still struggling with its resistance and hasn’t broken it yet is because Bitcoin Dominance is decreasing, causing Bitcoin to move upward slower than Total2.
📊 Currently, the next resistance for Total2 is the 1.07 area, and the probability of the price reaching this level is high.
If this bullish move gets faked, breaking 1.03 will be a good short trigger.
📅 USDT.D Analysis
Let’s move on to Tether Dominance analysis.
I believe the market is still waiting for Tether Dominance to move out of the range box formed between 4.99 and 5.14.
🚀 If the 4.99 level is broken, it can confirm that the market is turning bullish.
I think this trigger could start Bitcoin’s move toward a new ATH.
🎲 If 5.14 is broken instead, we can confirm the end of the bullish trend that the market has had in recent days.
❌ Disclaimer ❌
Trading futures is highly risky and dangerous. If you're not an expert, these triggers may not be suitable for you. You should first learn risk and capital management. You can also use the educational content from this channel.
Finally, these triggers reflect my personal opinions on price action, and the market may move completely against this analysis. So, do your own research before opening any position.

BTCUSDT: Bounce Incoming?BTCUSDT Technical analysis update
-March 2024 resistance is now expected to act as a strong support level.
-The price has touched the 0.618 Fibonacci retracement level, suggesting a potential reversal from this zone.
-The 200 EMA on the 2-day chart is positioned as a strong dynamic support, reinforcing the bullish case.
We can expect a bounce from the $72-75k level.

BTCUSDT - Binance FuturesBTCUSDT – Weekly Technical Outlook
🔹 Market Overview
Bitcoin (BTCUSDT) continues its steady upward recovery, currently trading around $94,000.
Following a strong bullish breakout from prior consolidation zones, BTC is now holding near local highs, showing cautious optimism among market participants.
🔹 Key Technical Highlights
• Price remains above major moving averages, confirming a bullish weekly structure.
• Support levels:
• $88,900 → Previous breakout base
• $81,780 → Strong weekly liquidity zone
• Resistance levels:
• $95,700–$97,500 → Critical supply zone ahead
• Psychological target above: $100,000+
🔹 Trend and Momentum
• Weekly trend is bullish while BTC holds above $88,900.
• Breakout above $95,700 could lead towards the $100,000 psychological target.
• Volume remains supportive of continuation.
🔹 Summary
BTC is consolidating at higher levels after an impressive rally.
A confirmed breakout above $95,700 would likely ignite further momentum.
Support zones remain intact, suggesting bullish structure continuation unless major levels are lost.
⚠️ This is an informational and educational analysis only. No financial advice is provided.
#Bitcoin #BTCUSDT #CryptoAnalysis #CryptoTrading #MarketFocus #TechnicalAnalysis #TradingView

28/04/25 Weekly OutlookLast weeks high: $95,778.66
Last weeks low: $84,688.21
Midpoint: $90,233.44
Last week Bitcoin ETFs recorded their second highest net inflows ever, $3.06B between April 21st-25th. The result of this buyside volume is evident on the chart as BTC breaks up into the mid $90k's, and in doing so is now back at the level in which BTC fell from originally to hit $74,500. As a result it is fair to say this area will be a big resistance level, but where is new support after this rally?
The aggressive nature of last weeks move up has left a number of areas of imbalance that the market does tend to revisit. Just below midpoint we have the $89,000-$90,000 area just below a key S/R level at $91,000. Dipping below this area into the FWB:88K 's briefly to sweep the demand and reclaiming $91,000 would be ideal for the bulls and very healthy for the next rally.
A less appealing area of imbalance for the bulls would be towards weekly low of $85,300-$86,300, that would be very painful for anyone longing a retest of the $91,000 area and from a HTF perspective would be a lower high and a SFP of the range midpoint, both bearish signals. The 4H 200 EMA is currently around that area at $87,000 too which would mean losing the level after just climbing back above it.
This week I'm looking at that first imbalance area to be a level of support for the next leg up, that's the ideal bullish scenario in my mind. A move below midpoint with acceptance is a red flag on this move and would start to look like a lower high bearish continuation.
Good luck this week!

The Hidden Power of the Silver Bullet Strategy - Full GuideIntroduction
The Silver Bullet Strategy is a high-probability intraday trading technique popularized within the Smart Money Concepts community. It focuses on taking precision trades during specific times of the day when liquidity is most active. Mastering this strategy can help traders consistently capture high-quality setups with minimal risk.
In this guide, we will cover:
- What the Silver Bullet Strategy is
- Key Times to Watch
- Entry Models
- Target Setting
- Risk Management
- Real Chart Examples
---
What is the Silver Bullet Strategy?
The Silver Bullet Strategy is based on trading within a "window" of high-probability price action, typically during key liquidity times. It looks to capture moves after liquidity sweeps, order block mitigations, and Fair Value Gap (FVG) plays.
Key Principles:
- Focuses on high-probability windows (New York session especially)
- Waits for a liquidity grab and displacement
- Entries are often on FVGs, OBs, or MSS points
---
Silver Bullet Timing Windows
Timing is crucial to this strategy. The "Silver Bullet" typically occurs in these windows (New York time):
- First Window: 10:00 AM - 11:00 AM (New York)
- Second Window: 2:00 PM - 3:00 PM (New York)
These times capture major moves post-liquidity sweeps or reversals after news/market manipulation.
---
Silver Bullet Entry Model
The classic sequence for a Silver Bullet setup:
1. Identify Liquidity Sweep: Look for price to grab liquidity above a swing high or below a swing low.
2. Look for Displacement: A strong move away from the sweep, creating a Fair Value Gap (FVG) or Breaker Block.
3. Entry in FVG or OB: Enter on a retracement into the FVG or Order Block after displacement.
4. Confirmation: Use lower timeframe MSS or BOS to confirm the reversal.
Liquidity sweep and FVG at the 5m:
MSS + Displacement candle at the 1m:
So all 4 steps completed!
Example Entry Checklist:
- Liquidity sweep
- Strong displacement creating an FVG
- Price retraces into FVG or OB
- MSS/BOS confirmation
- Execute trade with tight stop-loss
---
Where to Set Targets
Targets should be logical based on market structure:
- First Target: Recent internal liquidity (equal highs/lows)
- Second Target: External liquidity zones (major swing highs/lows)
- Optional: Use 1R/2R/3R scaling based on risk-to-reward goals
---
Risk Management for Silver Bullet Trades
Golden Rules:
- Risk less than 1% per Silver Bullet setup
- Set stop-loss beyond the liquidity sweep (not too tight, not too loose) or above FVG
candle
- Stick to one or two trades per window maximum
- Avoid revenge trading outside the windows
---
Common Mistakes to Avoid
- Trading outside the specified time windows
- Entering without a confirmed sweep and displacement
- Overleveraging because the strategy "looks easy"
- Ignoring higher timeframe bias (HTF context is still critical!)
Pro Tip: Combine Silver Bullet entries with SMT Divergences, MSS, and IFVGs for maximum confluence.
---
Final Thoughts
The Silver Bullet Strategy is one of the cleanest ways to approach intraday trading. By mastering liquidity concepts, timing, and precision entries, traders can catch powerful moves with strong risk-to-reward setups.
Be patient, wait for your window, and always trade with discipline.
Happy Sniping!
Bitcoin Bullish Monthlythe bullish April monthly candle is very start of the new bull run on cryptos

BTC - FVG + Golden Pocket Confluence = Short SetupA strategic high-timeframe imbalance meeting Fibonacci retracement, setting up a potential bearish reaction.
---
1. FVG + Golden Pocket — High-Value Supply Zone
The red shaded area defines a significant confluence:
- Fair Value Gap (FVG): Left behind by an aggressive drop, representing inefficiency where price is likely to react.
- Golden Pocket (0.618–0.65): High-probability Fibonacci retracement level, often acting as a magnet for liquidity before continuation.
This zone is primed to act as strong supply if price retraces into it.
---
2. 0.618–0.65 Fibonacci Retracement — Prime Rejection Zone
This Fib pocket offers:
- A technical level where aggressive buyers previously failed to hold ground.
- A common area where institutional players offload positions, triggering sell-offs.
A reaction inside this range aligns with broader bearish continuation expectations.
---
3. FVG Rebalance — Liquidity Collection
As price fills the inefficiency:
- It completes the rebalancing process, removing the incentive for further upward movement.
- Typically, liquidity grabs inside the FVG precede a sharp move back toward lower liquidity zones.
This supports the short bias post-rebalancing.
---
4. Expected Price Behavior — Liquidity Trap Mechanics
The projected move mirrors classical smart money behavior:
- Step 1: Induce late buyers into the FVG + Golden Pocket area.
- Step 2: Trigger a quick rejection after liquidity collection.
- Step 3: Resume downward pressure as imbalance is resolved.
The entire flow is designed to punish inefficient entries and reward patience.
---
5. Market Context Alignment
- FVG and Golden Pocket together strengthen the case for a precise, controlled rejection.
- Emphasis on liquidity-driven movements keeps the focus sharp on execution and timing.
---
6. Summary:
- FVG + Golden Pocket = Strong Supply Confluence
- High-Probability Short Setup Based on Rebalancing and Liquidity Collection
- Structured, Smart Money-Driven Price Behavior Expected
Tactically clean setup following liquidity engineering and imbalance theories.

Lingrid | BTCUSD weekly BULLISH Closure Above KEY LevelsThe price perfectly fulfilled my last idea . It reached the target level. Last weekly candle closed bullish showing bulls stepped in, and previous week BINANCE:BTCUSDT closed above the last 6 week highs. The market completed the ABC movement, therefore the market is moving sideways around the 95,000 level. At this point we can see the pullback in the market since it's testing the previous week high and ABC completion. This pullback would give us the opportunity to go long from the support zone in expectation of continuation. Looking left on the daily chart, we can see the price kept rebounding from the support level around 90,000 from November and February, which shows the importance of this zone. If the price pulls back toward this key level, the chance of bouncing off is pretty high. This historical support combined with the recent bullish momentum creates a compelling case for potential upside continuation after the current retracement completes. My mid-term goal is resistance zone around 99600
Traders, if you liked this idea or if you have your own opinion about it, write in the comments. I will be glad 👩💻


BTC/USDTRight now, BTC is at a crossroads. We've completed the weekly Fibonacci retracement and returned to the main trading zone.
It's crucial to hold the key level at 94,400.
If we succeed, the next target is 99–100K for BTC.
At that point, we should watch for a local correction — we likely won't break through 100K on the first attempt.
Altcoins should also catch up accordingly.
Finally, everything looks nice locally, and it's a good time to start building strong swing positions

Watchlist; week 17TVC:DXY
CRYPTO:BTCUSD
CRYPTO:ETHUSD
TVC:USOIL
FX:EURCAD
FX:AUDCHF
FX:GBPJPY
FX:GBPNZD
OANDA:XAGUSD
Weekly wachtlist. Some short term plays on BTC and ETH on the horizon.
EUR/CAD and US/OIL on my daily focus. The rest could need some time to develop.
The biggest goal for me this week is to stick towards these pairs and don't look at different pairs. Stick to the plan at all costs!

How can beginners use ETFs to catch the next 10× quickly?Introduction to Crypto ETFs
How Crypto ETFs Work?
Future Candidates for ETF Inclusion
Advantages of Crypto ETF Listing
Hello✌
Spend 3 minutes ⏰ reading this educational material. The main points are summarized in 3 clear lines at the end 📋 This will help you level up your understanding of the market 📊 and Bitcoin💰.
🎯 Analytical Insight on Bitcoin: A Personal Perspective:
Bitcoin is currently approaching three strong daily support zones, which perfectly align with key Fibonacci support levels. Based on this setup, I anticipate at least another 6% move to the upside, targeting the 99,700 level — very close to the major daily and psychological resistance at 100K.📈
Now, let's dive into the educational section , which builds upon last week's lesson (linked in the tags of this analysis). Many of you have been eagerly waiting for this, as I have received multiple messages about it on Telegram.
Introduction to Crypto ETFs 📈
In the rapidly evolving world of digital assets, Crypto ETFs (Exchange-Traded Funds) provide a bridge between traditional finance and cryptocurrencies. They allow investors to gain exposure to assets like Bitcoin, Ethereum, and a basket of other cryptocurrencies through regulated stock exchanges, without the need for direct ownership or private wallet management.
How They Actually Work 🔍
Instead of holding company shares, a Crypto ETF holds cryptocurrencies or crypto-related assets. You’re tracking coins like BTC and ETH the same way you’d track the S&P 500, but without direct crypto ownership headaches.
Why Crypto ETFs Are a Big Deal 📈
They make crypto accessible to everyday investors, offer easy diversification across multiple coins, and skip the risk of managing private keys. Great for both beginners and institutions looking for safer exposure.
What’s Inside a Crypto ETF? 🛒
Top picks usually include Bitcoin (BTC), Ethereum (ETH), Binance Coin (BNB), Ripple (XRP), and Litecoin (LTC). Some ETFs even mix in other favorites like Cardano (ADA) and Chainlink (LINK) to broaden the basket.
Future Coins That Could Join the Party 🎉
Beyond BTC and ETH, expect to see DeFi giants like Uniswap (UNI) and Aave (AAVE) show up in future ETFs. Even stablecoins like USDC could sneak in to balance out volatility.
What Makes a Coin ETF-Ready? 🧠
It needs high liquidity, broad investor trust, strong security backing, and, most importantly, regulator approval. Only coins that tick all these boxes are likely to be considered.
Examples You Should Know 🏛️
Purpose Bitcoin ETF (Canada), Grayscale Bitcoin Trust (GBTC), and ProShares Bitcoin Strategy ETF (BITO) are a few leaders. They open crypto markets to a whole new class of investors.
Why Being in an ETF Matters 🌟
Landing inside an ETF boosts a crypto project’s credibility, liquidity, and investor demand. It’s almost like getting a stamp of approval from the traditional finance world.
Not Always Smooth Sailing 🌊
Regulations are still tricky. Compliance isn’t easy. Some coins might not make the cut due to legal hurdles or operational risks. It’s a selective process for a reason.
Final Thoughts: Crypto ETFs Are Just Getting Started 🌐
Crypto ETFs are reshaping the market, creating new bridges between blockchain and Wall Street. As more projects mature and regulations catch up, ETFs could become a dominant force in crypto investing.
However , this analysis should be seen as a personal viewpoint, not as financial advice ⚠️. The crypto market carries high risks 📉, so always conduct your own research before making investment decisions. That being said, please take note of the disclaimer section at the bottom of each post for further details 📜✅.
🧨 Our team's main opinion is: 🧨
Crypto ETFs let you invest in Bitcoin, Ethereum, and other coins through regular stock markets, no wallets needed. 🚀 They make crypto investing safer, easier, and more accessible, while giving you diversified exposure. Top coins like BTC, ETH, and even DeFi tokens are in — but only if they’re liquid, trusted, and regulator-approved. 📈 ETFs boost a crypto’s credibility, liquidity, and adoption, though regulation hurdles still exist. 🌐 Overall, Crypto ETFs are a game-changer, connecting traditional finance with the world of digital assets! 🔥
Give me some energy !!
✨We invest countless hours researching opportunities and crafting valuable ideas. Your support means the world to us! If you have any questions, feel free to drop them in the comment box.
Cheers, Mad Whale. 🐋

Bitcoin (BTC/USDT) 1H – Bullish Until Key Support BreaksHello guys!
Bitcoin continues to move inside an ascending channel after testing the main resistance zone around $95,700. Price action shows a slight correction while respecting the channel structure. Despite a "fake divergence" appearing on the RSI, the main trend remains bullish as long as the $90,900 support holds.
✅ If buyers defend this zone, we could see another leg higher toward the channel top and beyond the main resistance.
⚠️ However, if $90,900 breaks down, it would signal weakness, and short opportunities could emerge with a target toward the $86,400 zone and lower.
Key Levels to Watch:
Support: $90,900
Resistance: $95,700

#BTC Complex consolidation phase📊#BTC Complex consolidation phase📊
🧠Currently in the resistance zone, but the trend direction is bullish. We are doing narrow fluctuations in the range of 91800-95000. There are some contradictions between the long and short positions here. If we want to participate in new transactions, we must wait until the absolute support and resistance levels.
➡️If it falls below the first support zone near 91800, then we need to pay attention to the second support zone of 88000-89000
➡️We need to wait for the structure to become clearer before looking for new trading opportunities.
🤜If you like my analysis, please like💖 and share💬 BITGET:BTCUSDT.P

BTC Major Top And Bottom Identified Road to $160,000 Bitcoin is currently trading around $95,000. Based on my analysis of the top and bottom zones, we are very close to breaking the critical $100,000 resistance level.
I expect BTC to break $100K within the next few weeks. Once we achieve a clean breakout above $100K, the market could enter a strong bullish phase.
From there, I anticipate Bitcoin will reach the $160,000 target within the next 4 to 7 months.
Key support and resistance levels are marked on the chart, with confirmations from volume, structure, and sentiment.
This is a long-term bullish idea — short-term volatility is expected, but the macro trend looks very strong.
🔔 Follow for updates as the journey unfolds!
🚀 Target: $160,000 | 🛡️ Always manage risk carefully.

Bitcoin Bullish for ShortermBitcoin currently trade around $93,911 having broken resitance above $88,000-$89,000 zone. The breakout, supported by strong volume, positions Bitcoin favorably for further gains, although a short-term pullback appears likely.
Technical indicators remain bullish:
Price holds above the 21-EMA and 30-SMA, both beginning to slope upward.
Quarterly VWAP levels at $89,485 and $84,484 provide strong support.
The Volume Profile suggests heavy buyer interest around $84,000–$86,000.
A minor retracement toward $88,000–$89,000 could precede a consolidation phase before Bitcoin targets $96,000 and eventually the psychological $100,000 mark.
Bitcoin remains in a strong position. Tactical patience and disciplined risk management will be key to capitalizing on the next major move.

BTC will ever go 100k?
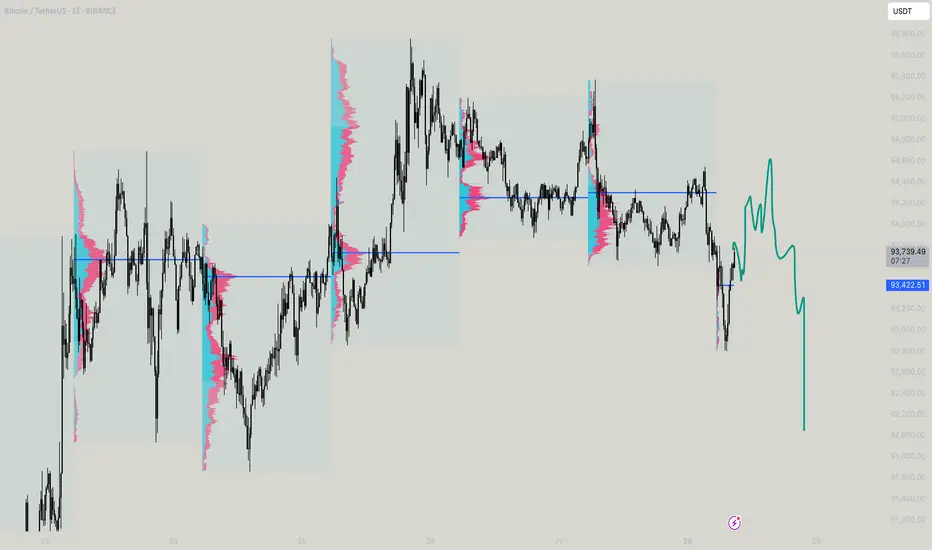
The immediate structure shows aggressive selling pressure — big thin volume zones (where there is less historical volume) are visible between $93,200 and $92,700. If BTC cannot reclaim and close strongly back above $93,900–$94,100 (preferably closing inside the old VA), the path of least resistance remains downward toward $92,500 first and even $91,700–$91,500 eventually.
In simple words: as long as BTC stays under $93,900, the market is favoring shorts, not longs. Quick bounces can happen, but they are more likely to get sold off unless a very strong reclaim happens. Bulls need to urgently push back above $94,100 to reattempt upside momentum, otherwise downside expansions toward lower value zones remain active.
TL:DR - Observe!
BTC..! Run it Back to $97k?The Asian session caused a dip on crypto market but it looks like price got enough strength in it and recovering.

BTC Ugly FaceBTC struggles at the yearly open. Nice ugly face pattern. We either get some strong volume n break up through that yearly open. If not ill be looking for a nice dump. Trade happy n have fun!. Stay prepared.

$BTC | 1D Macro Resistance ZoneBitcoin is testing a key liquidity area ($94.5K–$95.2K) after a sharp rally from $78K. This blue zone has triggered major rejections before — we may be nearing exhaustion.
🔍 Context & Observations:
— Possible final push + trap above resistance
— MSS level at $89,272 = first target if breakdown starts
— LTF range forming post-impulse
📌 Main scenario (correction):
— Entry: after fakeout & drop below resistance
— Target: $89.2K / $85K
— Invalidation: close 2-3 bars > $95K
📈 Alt scenario (bullish breakout):
— Entry: breakout & hold above $95K
— Target: $101K–$105K
— Invalidation: drop below $94K
⚙️ Triggers to watch:
— SFP or bearish structure on LTF
— Fakeout + low-volume rally
— Reclaim below range
Altcoins remain strong while BTC chops. Patience is key!

Bitcoin Weekly, Bullish Continuation ConfirmedDid you know... Look what is happening right now on this chart, it is an amazing and incredible development you are going to love it and you are going to love me for showing it to you. It confirms everything I've been saying for the past few months.
The week closes today within three hours and this is the first time that Bitcoin closes green three consecutive weeks in the year 2025.
Three green (bullish-positive) sessions is a classic bullish signal called the three white soldiers in candlestick reading parlance. In normal terms, based on simple fact straight in your face TA, it is the first time this event happens in 2025 period. Why it didn't happen before and that's because the market was bearish. Why it is happening now it is because the market is no longer bearish and turned bullish.
Three green candles with Bitcoin moving higher but that's not all, the third candle which is the current candle is about to close full green and the biggest candle of 2025. When a strong big candle appears it only confirms what comes next.
Now, you can allow for retraces, whatever... The week has seven days. Next week the whales can trick you with a small retrace followed by huge growth. But the whales are not stupid, they cannot take the risk of selling tons and people buying everything when prices are low.
Think long-term.
Bitcoin is set to grow above $150,000 in the coming months. So, any buying below $100,000 is a super discount, below $95,000 it is just too good to pass up. So no, nobody is ready to sell we are ready for growth.
The signal is in. The fact that the market remains green while the Altcoins grow confirms that Bitcoin will produce a bullish continuation as the next major move, going up, for sure.
What will you do? Will you follow will you trust?
Will you go the other way and support the people that are saying that Bitcoin will crash when Bitcoin has been growing since November 2022?
Bitcoin is going up.
The correction is over.
The bottom is in.
It will be a massive rise lasting more than 6 months.
Are you ready for the strongest bullish action you've seen in your life?
I am.
Thanks a lot for your continued support.
Namaste.

BTCUSD - MY ONLY FOCUS FOR THIS WEEK!!INTRO
BTC has broken out of the descending Trendline just as anticipated but it's now trading at a premium, so let's breakdown the levels i'm watching and have a clear view on what to expect this week.
1. MARKET OVERVIEW
BTC has showed an impulsive move to the upside these previous weeks. While some might be thinking of jumping in on this buys that has been going on i think it's a bad idea to look for the buys to continue this new week because BTC is now trading at a premium level where buys are low probability(it might be a good idea to buy earlier in the week becaus price hasn't approached a key supply zone i'm watching out for) and i'm also anticipating for price to retest the Trendline before the major Buys.
2. KEY LEVELS I'M WATCHING
* Supply Zone: 96,400 - 98,700
(My major trade idea for this week is a sell on BTC so i'm only focused on the key supply zone)
3.TRADE BIAS & SCENARIOS
I'm Bearish on BTC this week but i'll be looking out for a buy earlier in the week from my H1 Demand Zone (91,600 - 92,400) into my supply zone(96,400 - 98,700). But if price trades to my Supply zone without getting to my H1 Entry point i'll cancel my buy order and focus only on the sell for the week.
4 FINAL NOTES
Stay patient and let price come to you and manage your risk when it does. Feel free to share your thoughts or setups in the comment.
