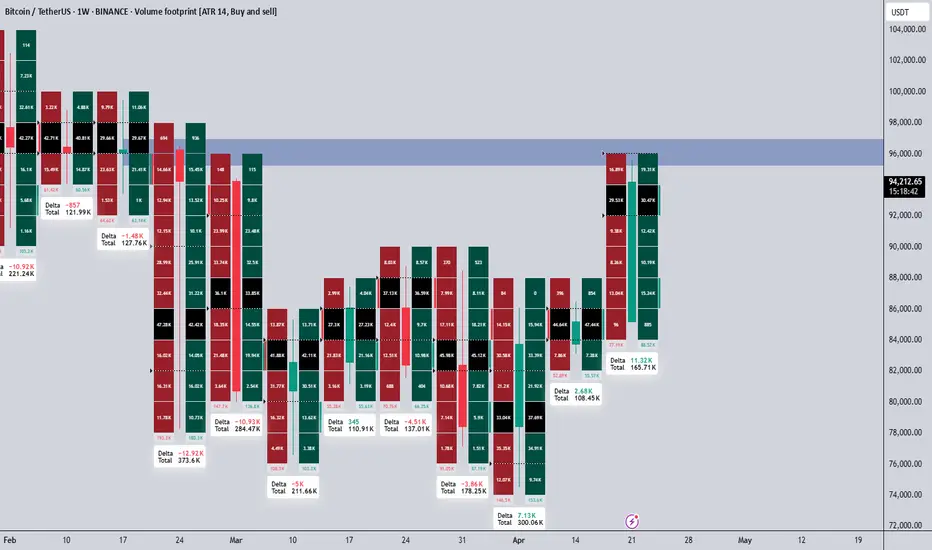
Market Recap | Last Week's Data Still Positive but Stay AlertLast week's data continues to paint a positive picture for the markets. Buyers are still clearly active based on the momentum we've observed. However, it's crucial to remember that markets are dynamic, and what looks strong today can shift quickly depending on upcoming news and developments.
📊 What the Data Tells Us:
Buyers are in control. Demand has been supporting the price across key levels, preventing deeper pullbacks.
Momentum remains bullish for now, but there’s a sense of caution creeping in as traders anticipate next week's news releases.
No major cracks yet, but we cannot afford to be complacent. Smart traders always stay flexible.
⚡ What's Next?
Until fresh news hits the market, buyers have the upper hand. But remember: your biggest strength is adaptability. Stay ready to pivot if next week’s developments shift sentiment.
Trust the data, but always respect the changing nature of the market. Confidence is good, but awareness is better.
📌I keep my charts clean and simple because I believe clarity leads to better decisions.
📌My approach is built on years of experience and a solid track record. I don’t claim to know it all but I’m confident in my ability to spot high-probability setups.
📌If you would like to learn how to use the heatmap, cumulative volume delta and volume footprint techniques that I use below to determine very accurate demand regions, you can send me a private message. I help anyone who wants it completely free of charge.
🔑I have a long list of my proven technique below:
🎯 ZENUSDT.P: Patience & Profitability | %230 Reaction from the Sniper Entry
🐶 DOGEUSDT.P: Next Move
🎨 RENDERUSDT.P: Opportunity of the Month
💎 ETHUSDT.P: Where to Retrace
🟢 BNBUSDT.P: Potential Surge
📊 BTC Dominance: Reaction Zone
🌊 WAVESUSDT.P: Demand Zone Potential
🟣 UNIUSDT.P: Long-Term Trade
🔵 XRPUSDT.P: Entry Zones
🔗 LINKUSDT.P: Follow The River
📈 BTCUSDT.P: Two Key Demand Zones
🟩 POLUSDT: Bullish Momentum
🌟 PENDLEUSDT.P: Where Opportunity Meets Precision
🔥 BTCUSDT.P: Liquidation of Highly Leveraged Longs
🌊 SOLUSDT.P: SOL's Dip - Your Opportunity
🐸 1000PEPEUSDT.P: Prime Bounce Zone Unlocked
🚀 ETHUSDT.P: Set to Explode - Don't Miss This Game Changer
🤖 IQUSDT: Smart Plan
⚡️ PONDUSDT: A Trade Not Taken Is Better Than a Losing One
💼 STMXUSDT: 2 Buying Areas
🐢 TURBOUSDT: Buy Zones and Buyer Presence
🌍 ICPUSDT.P: Massive Upside Potential | Check the Trade Update For Seeing Results
🟠 IDEXUSDT: Spot Buy Area | %26 Profit if You Trade with MSB
📌 USUALUSDT: Buyers Are Active + %70 Profit in Total
🌟 FORTHUSDT: Sniper Entry +%26 Reaction
🐳 QKCUSDT: Sniper Entry +%57 Reaction
📊 BTC.D: Retest of Key Area Highly Likely
📊 XNOUSDT %80 Reaction with a Simple Blue Box!
📊 BELUSDT Amazing %120 Reaction!
I stopped adding to the list because it's kinda tiring to add 5-10 charts in every move but you can check my profile and see that it goes on..
BTCUPUSDT trade ideas
Market next move is comming from this level #bitcoinHello trader's
here is your next move analysis prediction
Be patient at this level so don't be rush.

BTC - Golden Pocket Confluence + FVG Sweep = Long SetupA highly refined scenario blending Fibonacci confluence with liquidity principles, setting up a controlled bullish play.
---
1. Golden Pocket + FVG Confluence — Critical Demand Zone
The blue highlighted area represents a strong confluence:
- FVG (Fair Value Gap): Imbalance left by aggressive price movement, likely to attract price for rebalancing.
- Golden Pocket: The 0.618–0.65 Fibonacci retracement zone, statistically favored for deep retracements and high-probability reversals.
Expecting strong buying interest once price taps into this confluence.
---
2. 0.618-0.65 Fib Range — Key Reversal Territory
The Fibonacci zone offers the perfect environment for engineered liquidity sweeps and smart money accumulation.
- This range often acts as a trap for retail shorts while institutions accumulate.
- A clean entry opportunity arises as price dips into this critical golden zone before expansion.
---
3. FVG Resistance Above — Initial Reaction Zone
A notable FVG resistance area is marked around 94,400–94,500:
- Upon reaching this zone, price may face initial selling pressure or short-term consolidation.
- Observing how price interacts here can further confirm bullish strength and continuation.
---
4. Smart Money Liquidity Play
The setup suggests a classic liquidity engineering move:
- Induce shorts through a pullback into the Golden Pocket.
- Absorb liquidity inside the FVG.
- Trigger a sharp bullish reversal aligned with institutional footprints.
This layered setup is clean, logical, and methodical.
---
5. Projected Price Flow
Anticipated price action structure:
- Step 1: Dip into the Golden Pocket + FVG demand zone.
- Step 2: Reversal toward the FVG resistance.
- Step 3: Breakout continuation upon reclaiming resistance, leading to further bullish expansion.
Each leg is mapped to follow high-probability liquidity behavior.
---
6. Summary:
- Golden Pocket + FVG = Prime Reversal Confluence
- Efficient Liquidity Sweep Mechanics
- Structured Bullish Progression Based on Smart Money Concepts
This plan is framed to capitalize on precision entries and liquidity dynamics without chasing price.

BTC Is Still Bullish (4H)This analysis is an update of the analysis you see in the "Related publications" section
Bitcoin is still struggling with the supply zone we identified in the previous analysis. It has not yet been able to establish itself above this supply area.
A slight correction is expected, with support anticipated from the green box.
The closing of a 4-hour candle below the invalidation level will invalidate this analysis.
For risk management, please don't forget stop loss and capital management
Comment if you have any questions
Thank You

BITCOIN SHORT SETUP ALL trading ideas have entry point + stop loss + take profit + Risk level.
hello Traders, here is the full analysis for this pair, let me know in the comment section below if you have any questions, the entry will be taken only if all rules of the strategies will be satisfied. I suggest you keep this pair on your watchlist and see if the rules of your strategy are satisfied. Please also refer to the Important Risk Notice linked below.
Disclaimer
BTC SHORT SETUP
ENTRY : 96400
PROFIT : 88174.9
STOP : 98812.8

A Simple sell set up is formed here in BitcoinCurrent Price Area: ~94000
Short-term Trend View: Downtrend
First Target: 93500
Second Target: 93000
Stop Loss: above 94400
In short: you are expecting a short-term correction in Bitcoin from 94000, with a stop-loss tight above recent highs (94400), aiming for a ~1000 point move down.
Quick thoughts on this setup:
If Bitcoin fails to break 94400 cleanly, your short view stays valid.
Watch for support near 93500 — some bounce can happen there, so partial booking or trailing stop could be smart if it stalls.

Bitcoin Long....Bouncing off from Demand zone at 15 mins tf. Might give a nice rally to the next supply zone

Bitcoin pullback next85600 area should be the next support, 4h left unfilled gap, onec it will go down to it, panic selling will break the support and starting pulling back slowly down

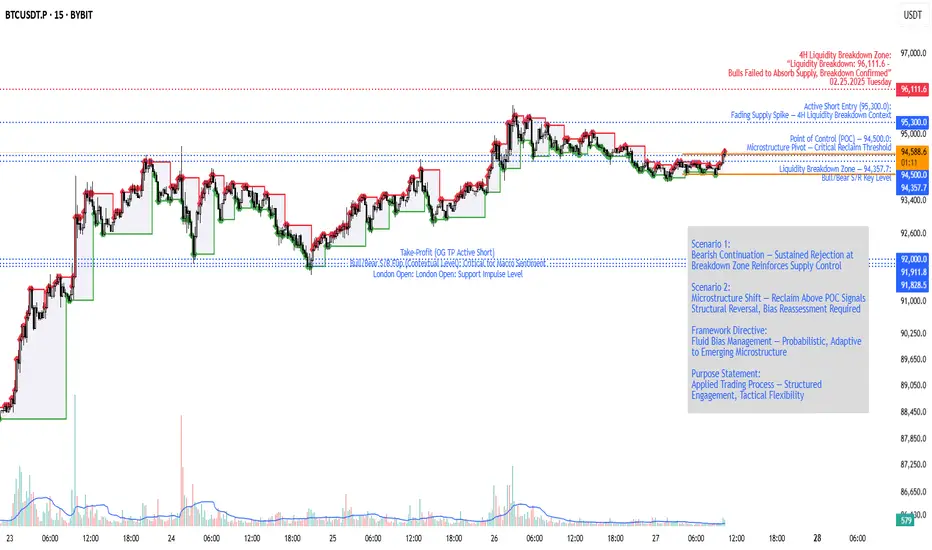
Microstructure Shift Observed — Scouting LTF Long Reversion PlayThe active short from 95,300.0 remains fully engaged, aligned with the 4H liquidity breakdown thesis, targeting broader downside expansion. This position will play out in full as per the original trade design, independent of lower timeframe fluctuations.
However, emerging microstructure shifts—evidenced by reclaiming the Point of Control (94,500.0)—highlight a potential short-term structural reversal.
Primary Position: Swing short thesis remains intact, allowing full downside potential to unfold.
Secondary Opportunity: Scouting LTF long reversion setups for countertrend engagement, contingent on continued supply failure and structural stabilization above reclaimed pivots.
This approach exemplifies multi-timeframe bias management:
Primary bias (HTF) remains bearish, unchanged.
Secondary bias (LTF) shifts toward opportunistic longs, with conditions monitored in real-time.
Demonstrating conviction in core theses, while maintaining agility to capitalize on evolving microstructure.
BTC / USD 1 HThe uptrend line has been breached and we will wait for a close below the moving average lines and the green zone, which is a high volume area, to start selling.


Bitcoin —Short-Term Retrace (Drop) Or Higher Next?Look at this, this is Bitcoin on the daily timeframe. I will keep it short, sweet and easy.
Bitcoin broke up 22-April and has been sideways since with an upward bent. When Bitcoin is set to drop, it drops the next day.
It has been four days and Bitcoin is going up, no retraces. This indicates that the next move will be a big, very big, green candle. No significant drop so far.
A drop would mean prices moving below 90K. Wicks lower or higher are not relevant and consider noise only. Not a drop nor a rise.
The next major move is up. Bitcoin is going up.
The action on the chart reveals higher prices.
The action coming from the Altcoins market reveals a major advance happening in the coming days.
Four days not lower but higher.
The 2-March high, the highest price since the first drop below 90K has been compromised. There was no strong rejection nor selling pressure.
This is a strong resistance level, $95,000. As soon as it gets conquered, Bitcoin will move straight up to $100,000.
Very easy, simple, short and sweet.
Bitcoin is going up. Buy and hold.
Buy and hold. I repeat.
Orange is the target zone. Short-term. Up next.
Namaste.

BTC LONG We wait for price confirmation at my buy level and then we swing for price to take out the recent high formed

BTCUSDT ### 1. Heikin Ashi:
- The recent candles are small with no strong lower shadows (short wicks and small bodies) → Indicates weakening buyers.
- No pure bullish candles (full green body with no lower shadow) are visible.
### 2. Regular Candles:
- Formation of a small red candle after the peak of 95,600 → Suggests a retest of resistance and a potential double-top pattern.
- Trading volume has decreased compared to the previous leg (smaller blue volumes) → Weak demand at higher levels.
---
### Is now the time to enter?
**No**, it’s better to wait until one of the following two scenarios becomes clear:
#### **1) Long Entry Signal:**
- Clear breakout above **95,600** (more than one 4H candle closing above resistance).
- **Heikin Ashi confirmation:** At least **2 strong bullish candles** (long body, short lower shadow).
- High buying volume relative to the **10-candle average**.
- **Entry strategy:** After the 4H candle closes above resistance, you can enter long with a stop-loss below **95,600** and an initial target of **98,000–100,000**.
#### **2) Short Entry Signal:**
- Breakdown and **4H candle closing below the purple trendline** (short-term support).
- **Heikin Ashi confirmation:** Appearance of at least **2 consecutive red candles** with short shadows.
- Increase in selling volume (red volume larger than average).
- **Entry strategy:** After the candle closes below the trendline, you can enter short with a stop-loss above the breakdown point and an initial target around **92,000–90,000**.
---
### **Summary:**
- **Do not open any new trades** until either a breakout above **95,600** or a breakdown below the trendline occurs.
- Always place a **tight stop-loss** at the invalidation point.
- Adjust position size based on **risk management**.
By following these principles, you’ll enter trades with **limited risk** and a **higher probability of success**. Good luck!

BTCUSDT Imminent BUYSo BTCUSDT broke the Possible Area (sky Blue) and is currently respecting the Stronger Support Level. I'm seeing a Break of the Trendline to further fuel the BUY.

BTCUSDT BTC is on its way up.
Price is back at 95000
Once we break those recent highs @95000 we’re back back up to @105000


BTC be cautious of stoploss hunt for buy of bitcoin .93300-92000 looks like a retest to the broken structure on 1hr

BTC Gann Box Symmetry - Bearish ScenarioTake a look at my spin on a Gann projection with symmetry in mind
BYBIT:BTCUSDT.P BITSTAMP:BTCUSD

$BTC - Weekend OutlookBitcoin just tapped into the major overhead supply zone 95k, which corresponds to the breakdown origin of the previous range.
Notably, we observed the highest Coinbase premium in recent sessions, signaling aggressive spot-driven demand. However, a sell wall is starting to build around 95k and 97k, suggesting that short-term sellers are positioning here.
Key support to watch : the 88k–86k range, which marks the recent breakout base and vwap.
Holding this zone would validate the breakout structure and set the stage for further continuation to the upside. Failure to hold likely triggers a deeper retest toward mid-range levels.
Expect volatility over the weekend as price oscillates between overhead supply and this critical breakout support.

BTC Setup: Scalp Shorts Active Below 97.5K BTC is currently facing strong resistance around the 97.5K area on the daily timeframe.
As long as BTC stays below 97.5K on a daily closing basis, I am expecting a potential pullback move.
📉 There is a chance of a wick or sharp move down toward the 92K zone, which could provide good scalp short opportunities.
📈 However, a clear breakout and daily close above 97.5K would invalidate this short idea and shift the bias back to bullish continuation.
Trade Plan:
🔻 Below 97.5K = Look for scalp shorts with strict risk management.
🔼 Above 97.5K = Exit shorts and watch for bullish setups.
Always remember: Protect your capital and stick to your plan! 🎯
⚠️ Disclaimer:
This is not financial advice. This post is for educational purposes only. Always do your own research and manage your own risk before entering any trade.

BTC BACK AT A PREVIOUS MONTH HIGH OF 94k! WHAT NEXT?Price trades at $94,264 which is previous month high price. Technically, this is a resistance high which we’re likely going to see a further bullish breakout before we can confirm a high probability of price trading back at $100,000
From the technical standpoint, we’re likely going to see a possible pullback of the previous week impulse move before buyers can step in again. Next bull target is 100k,110k

BTC Possible HTF HL Creation 3BTC Possible HTF Creation 3
Inversed chart again... (to minimise full breakdown to 48k fear which messes with my analysis).
Price did a MSB which definitely weakens this downtrend (yellow). But what happens now?
-------------------------
Three possibilities:
1
Price gets capped here at outstanding 95k level and goes back to 74k level, breaks through it and goes to 48k. This now definitely is a irrational thought as price messed the downtrend up by doing this MSB. Beforehand this might have been also irrational as the big 70k is a closed structure because of the pump through it (this change in PA + followed up up-move makes this a confirmed closed structure; however this is still speculation: needs more sample). Like, if price just kept on downtrending through the inefficiency, then I could see the mega breakdown to 48k happening but now... no.
2
Price makes a HL instead of going back to 74k level. I don't see this happening as changes in trend usually start with some sort of significant PA at the lows/highs which we IMO didn't get here. I don't think the MSB is enough as the downtrend got initiated with an SFP (strong) and price has yet to deal with the 95k level which IMO is just a really big level if you look at it LTF (though definitely less outstanding as this isn't the last LH anymore. That's the one which now has been broken with the MSB). Just LTF looking at the lowest low it just doesn't make sense to me: nothing significant happened at the lows. The way price went back down and then made a HL instead of an SFP while IMO there was no reason for the HL just doesn't make sense. The 'base' for the higher TF MSB (yellow) is imo weak.
3.
Price SFP's the lowest low 74k level on the 1D (and even better on the 15min). Why SFP? Well, higher TF moves often just start with an SFP. Either SFP or deviation and I don't see a deviation happening as I think the downmove to 74k would just be weak as there's already the MSB. Weak so no stength to get below the level so simple SFP is what you get. This 'pattern' happens often: downtrend ----> sudden MSB but unexpected as insignificant PA at lows, thus unjustified MSB -----> price gets back to lowest low and creates significant PA (SFP) -----> now the real uptrend starts with a justified bottom.
Oct-Dec 2022: SFP within deviation
March 2023: deviation
August 2023: deviation
January 2024: deviation
August 2024: SFP
