BTC Bearish Harmonic CompleteW (Bearish) Cowboy Harmonic with price targets and support levels
glhf
$cowboycharts
BITSTAMP:BTCUSD BYBIT:BTCUSDT.P
BTCUPUSDT trade ideas

BTC Elliott Wave Count - Bearish Wave IncomingBYBIT:BTCUSDT.P BITSTAMP:BTCUSD
Potentially Large Bearish Corrective Wave on BTC with potential downside of up to $20,000
glhf

TradeCityPro | Bitcoin Daily Analysis #73👋 Welcome to TradeCity Pro!
In this analysis, I want to give you a complete review of Bitcoin. There are just a few days left until the monthly candle closes, and it’s been a while since I analyzed higher timeframes for you, so it’s a good time to do that now.
📅 Monthly Timeframe
In the monthly timeframe, it’s very clear that Bitcoin has a long-term uptrend, which is still ongoing. The new leg of this trend started from the 16162 bottom and has so far extended to 104857.
⚡️ In the past few candles, the price has entered a phase of correction and consolidation, which is perfectly natural and necessary for the trend’s health. However, because this is happening on the monthly timeframe and takes months, some traders and market participants might think the uptrend has ended.
✔️ First of all, Bitcoin’s uptrend has not ended yet. We’ve just seen two red monthly candles, and now with this month's candle, bullish momentum is reentering the market. I believe the price can register a new all-time high (ATH). Even if that doesn’t happen, remember that Bitcoin’s dominance is very high, and this bullish cycle won’t last forever—eventually, Bitcoin dominance will start to fall.
🔍 If that happens and the percentage of money inside Bitcoin decreases, this capital will shift into altcoins. With this large inflow of capital, an altcoin season will begin.
📊 My personal view is that Bitcoin will have one more bullish leg toward 130,000 or 180,000, and after that, dominance will start to drop and the altcoin season will begin. Initially, Bitcoin will move upward, followed by strong, large-cap altcoins like Ethereum, BNB, XRP, etc. After these big players rally, capital will shift into good low-cap projects, leading to the crazy crypto pumps we've seen in previous bull runs.
🔽 This is the scenario I find most likely. But if the market moves against this scenario and dominance shifts earlier or later, I will adapt accordingly without being rigid in my analysis.
✨ As for Bitcoin turning bearish, I think that’s very unlikely for now, and the triggers for that are still far away from the current price. If that scenario becomes more probable, I’ll update my analysis and discuss it.
In short, for Bitcoin to turn bearish, it would need to make a lower high and a lower low compared to 104000, and if a sharp downtrend is to happen, the price must establish below 58000.
📅 Weekly Timeframe
In the weekly timeframe, we can see the bullish movement in more detail. A bullish move started from the 16162 bottom and after three bullish legs, the price reached the 104857 resistance.
💫 Currently, the price is in the correction phase of the third bullish leg and had pulled back close to the previous high of 71520. After forming a bullish engulfing candle, bullish momentum has returned, and the price is moving back toward 104857.
🎲 The 104857 area overlaps with the 0.618 Fibonacci Extension, creating a strong PRZ (Potential Reversal Zone). If this high breaks, the next resistance levels are the 0.786 and 1 Fibonacci levels, roughly around 125000 and 155000.
👀 There’s also a visible trendline in this timeframe that the price has touched three times, and each time the trendline bottom coincided with RSI support. However, the last time the price touched the trendline, it made a fakeout, which can be observed both on the price chart and on RSI.
⭐ This fakeout could inject even stronger bullish momentum and drive the price higher. But for this to happen, the current bullish leg must break above 104857—otherwise, the scenario fails, because if buyers truly have strength after a trendline breakout, they should be able to break the previous high.
☘️ If this doesn’t happen, it signals weakness, and the price could move back toward the 71000 support, with an increased probability of breaking it.
💥 In previous analyses, I also mentioned that during this bullish cycle, RSI has accurately indicated market bottoms each time it touched the 45.17 support level. This has happened again, and I hope you were able to benefit from it.
📅 Daily Timeframe
In the daily timeframe, as you can see, using the bullish leg up to 106247, we can draw a Fibonacci Retracement.
🔑 In the initial correction phase after reaching 106247, a box was formed between the 0.236 Fibonacci level and the 106247 top. After the 0.236 Fibonacci level, which overlapped with 90958, was broken, a deeper correction occurred down to the 0.5 Fibonacci level.
🔄 A descending trendline can also be drawn on the chart. As I mentioned in Bitcoin analysis #52, I advised spot buying upon the breakout of this trendline. I hope you were able to take full advantage of that opportunity.
📚 After the price reached the 0.5 Fibonacci level, a strong reaction occurred, and after activating the 87360 trigger, the price began a bullish move with strong buying volume and sharp candles, climbing back above 90958. If it holds above this level, it could move back toward the 106247 top.
💥 The RSI oscillator has increased significantly during this bullish move and is now near the Overbuy zone. If RSI enters the excitement zone, the likelihood of a sharp move toward the main resistance increases, and if RSI stabilizes above this zone, the probability of breaking the 106247 top will be very high.
📉 Currently, strong bullish momentum has entered the market, so we can expect a solid uptrend to continue. However, if the price falls back below 90958 before reaching the 106247 top, it would suggest that the entire bullish move was a fakeout, and bearish momentum could enter, pushing the price lower toward the 0.618 or even 0.786 Fibonacci levels.
⏳ 4-Hour Timeframe
Let’s check the 4-hour timeframe for futures triggers.
✔️ As you know from previous analyses, we had two main entry points for long positions at 85697 and 88289, and I hope you managed to open positions based on those.
💣 Currently, the price has reached the 95173 resistance and is being rejected. The RSI oscillator also shows a divergence, and if the 64.4 level breaks on RSI, temporary bullish momentum could fade.
🔼 In case of correction, the supports we currently have are at 92109 and 88289. For more levels, we’ll need to wait for a proper correction to use Fibonacci tools.
📈 For a long position, you can enter on the breakout of 95173. The next price target will be 98828.For a short position, we still need to wait for a proper trend reversal.
❌ Disclaimer ❌
Trading futures is highly risky and dangerous. If you're not an expert, these triggers may not be suitable for you. You should first learn risk and capital management. You can also use the educational content from this channel.
Finally, these triggers reflect my personal opinions on price action, and the market may move completely against this analysis. So, do your own research before opening any position.

HelenP. I Bitcoin can rebound up from support zone to $96KHi folks today I'm prepared for you Bitcoin analytics. After breaking out of a prolonged sideways movement, the price entered a confident bullish phase that changed the market rhythm. This breakout came after the price consolidated for several days within the 83700 - 83000 support zone. During that period, the price formed a reliable foundation, and the trend line confirmed its strength, consistently holding the lower boundary of the structure. Once the price escaped this consolidation box, bulls quickly seized control, pushing BTC upward with strong momentum. The move took Bitcoin above the 94000 area, where it started to slow down and form a local peak. Now the price is pulling back, heading toward the nearest support zone between 92200 and 91600 points. This area matches Support 1 and historically acted as a zone of high buyer interest. Given the proximity of the trend line and the strength of this support zone, I expect that BTCUSDT will rebound after this correction. That's why I set my goal at 96000 points, a realistic target if the support holds and BTC resumes upward movement. If you like my analytics you may support me with your like/comment ❤️

Btc going to reach short liqFrom my last post we got 28% profit without leverege. Perfect entry point. And now we going to reach main week short liq. $$$

Bitcoin is going for a new ATHHi traders,
It turned out that Bitcoin made a leading diagonal (wave 1) and a correction down (grey wave 2).
After that it made the next impulse wave up just as I've said last week.
Now we could see small corrections down and more upside for a new ATH.
Let's see what the market does and react.
Trade idea: Wait for a small correction down to trade longs.
If you want to learn more about trading FVG's with wave analysis, please make sure to follow me.
This shared post is only my point of view on what could be the next move in this pair based on my analysis.
Don't be emotional, just trade your plan!
Eduwave

BTC weekend liquidity grab?Possible move down to 85.5K - 86.5K over the weekend. Ocean of liquidity available at this region. Short TP @ 87K.
Moves down to this level keeps the Weekly candle green --> anticipate a reversal moving into next week. Going long @ weekly open.


BTC SWINGWhile ignoring all the X crypto gurus, you should focus on reading the chart. This Long on BTC seems kinda obvious to me, daily breakers with unfilled imbalances. What do you think?
Comment below!

Bullish Idea on Bitcoin If bitcoin sustains above 94350 on the 1 hour time frame. We may see a nice bullish move till 94700

BTC's short-term outlookA correction to 89k becomes more likely the longer BTC fails to close above 95k.

#Bitcoin update , 100K or 88k?#Bitcoin has moved exactly as we anticipated over the past 36 hours.
The real test comes: BTC must break above $95,700 to target the $100K milestone.
This level also marks a major distribution zone on the lower timeframes, making it a tough but not impossible barrier to overcome.
⚡ If BTC gets rejected here, expect a potential revisit to sub-$90K levels.
I’ll keep updating this chart as the price action unfolds.
If you found this helpful, bookmark this post and smash the like button to stay in the loop!
Thank you
#PEACE

BTC CAN RISE AFTER FALLING TO 91500Hi , Elliott's wave telling us btc should touch 91k to complete wave 4. Be careful btc will dump to 91k !!!!

Bitcoin "Crash" 2025Bitcoin started a more significant correction recently, which is scaring many people, and there is already a lot of talk about the beginning of the Bear market.
In my view, the upward trend is still intact, and this could very well be a healthy correction to prepare for a more significant rise in the coming months.
We have an important support level at $75K which has confluence with the 3D SMMA which has already proven to be strong in the past, I think there will be some reaction and that could very well be the end of this correction, but as long as the price manages to stay above $70K I will remain bullish and looking for Longs.
It is important to note that the Fear and Greed indicator is at 21, with Bitcoin at $84K.

$btc Bitcoin's falling channel....CRYPTOCAP:BTC Bitcoin has seen an all time high of approximately 110k
Current price: $77700
Bitcoin price action is currently respecting the falling channel as seen. With price currently being supported by the 200EMA in the 75k region
Expecting price action to continue to respect this channel and test resistance levels at 88k and then around 92k (bullish divergence also spotted on 2D timeframe). Reactions which will determine higher prices or further rejection.
if #btc price action breaks down from this falling channel then expects supports at 66k and then 56k to be tested for support!

BITCOINBitcoin’s market cap and price action in April 2025 confirm a robust upswing, supported by technical breakouts, improving sentiment, and favorable macroeconomic conditions. Sustained trading above $88,000–$91,000 and a convincing breach of $94,000 are key confirmations of the current bullish phase, with $100,000-103000 as the next major target

Possible BUY on BTCUSDTThere is a Possible Support Area (sky Blue) that price is respecting and there is a counter trendline as well. If broken, I expect a BUY. If not broken, there is a stronger Support Level below which should fuel the BUY.

BTC ANALYSIS (update)📊 #BTC Analysis : Update
✅As we said earlier, #BTC performed same. Around 22% bullish move done after the analysis. Now we can see that #BTC is trading around a mmajor resistance. We could expect around 10% bullish move if it sustain above its major resistance area
👀Current Price: $94,590
🚀 Target Price: $1,04,476
⚡️What to do ?
👀Keep an eye on #BTC price action and volume. We can trade according to the chart and make some profits⚡️⚡️
#BTC #Cryptocurrency #TechnicalAnalysis #DYOR

BTC continuing bullish momentum on 4HRCurrent breakout of BTC shows target price of 107K.
It seems that the price will test the levels of 106-107K

Here for a Funtime short sellCurrently analyzing Bitcoin on the 15-minute chart.
I spotted a symmetrical triangle forming after a strong upward move, showing signs of market indecision.
I mapped out the weekly highs (blue line) and potential support zone (yellow line) based on the daily/weekly structure.
My anticipation:
If price breaks down from this triangle, I expect a short move toward the 92,155 support zone.
If price breaks up, the next target would be around 95,670.
I'm staying flexible and will let the breakout direction guide my next move.
Trade safe, manage risk!
#Bitcoin #BTC #CryptoTrading #ChartAnalysis #Forex #TechnicalAnalysis

Take a step back to leap forwardMost altcoins REALLY NEED another correction before they can aim for higher levels.
There’s a high chance we’re about to see a major shakeout, and after that, the market will gradually rotate capital into altcoins.
It’s coming very soon — probably early May, though it’s hard to pinpoint exactly when. Just be prepared for a big liquidation move to wipe out all the FOMO long positions flying around 😂😂😂😂
This game has never been easy.
Wait for the market shakeout, fam. 😎😎😎😎😎
This upcoming move is going to be a big one 😎😎😎😎

BTC - Next to 100k?Bitcoin (BTC/USDT) is currently showing strong price acceptance above the $94,500 region, with the latest POC (Point of Control) holding firm at $94,880, suggesting this is the price where most trading volume has occurred recently. The VAH (Value Area High) sits just above at $95,100, and price is hovering slightly above that range at $95,043, which is an early sign of potential bullish continuation. Each previous breakout leg—such as the one from $91,000 to $94,000—was supported by rising value areas and shifted POCs, showing steady demand and controlled price discovery upward.
As long as BTC stays above $94,500, dips may continue to be bought, and bulls are likely targeting $96,200–$97,000 liquidity pockets next. However, any failure to hold above $94,400–$94,500 with a 4H close back below VAL could lead to a rotation back toward the older value area around $93,000, which would shift the bias to short-term range-bound or even corrective.
So, more buys can be expected on retests of $94.5K, but profit booking or initial short setups can be planned if BTC prints a rejection wick + closes below the developing POC and VAL — especially below $94,300, which would invalidate current acceptance💥

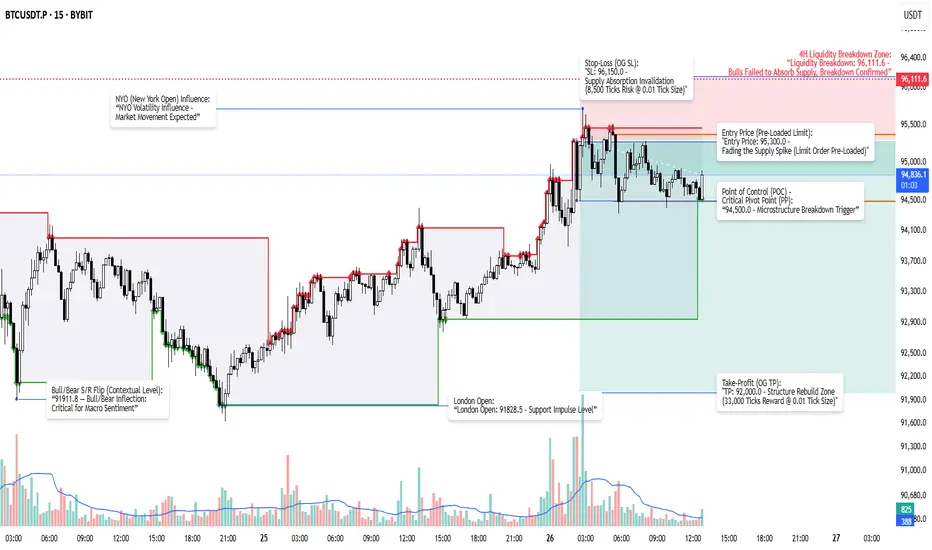
BTCUSD Swing Short | Fading Supply Spike- 4H Liquidity BreakdownBTC retraced into the 4H liquidity breakdown zone at 96,111.6. Bulls failed to absorb supply here, confirming structural weakness. Price spiked into this zone but rejected, setting up a swing short opportunity. This rejection lacked conviction, driven by late longs chasing into thin liquidity. The setup isn’t about momentum—it’s about exploiting the structural fragility where stretched positions collapse.
"Entry Price: 95,300.0 – Fading the Supply Spike (Limit Order Pre-Loaded)"
"SL: 96,150.0 – Supply Absorption Invalidation (8,500 Ticks Risk @ 0.01 Tick Size)"
"TP: 92,000.0 – Structure Rebuild Zone (33,000 Ticks Reward @ 0.01 Tick Size)"
"RRR: 3.88R Skewed Outcome (Pre-Fee)"
"Net RRR After Fees: 3.56R"
Expected stop loss is 850.0 USD range on price, translating to 1.70 USDT risk on my 0.002 BTC size. Expected take profit is 3,300.0 USD range on price, yielding 6.60 USDT reward. Total fees estimated at 0.07492 USDT if TP hits, 0.13427 USDT if SL hits. Net reward after fees is 6.52508 USDT, net loss after fees is 1.83427 USDT, yielding a final net reward-to-risk ratio of 3.56R.
Contextual layers:
"Liquidity Breakdown: 96,111.6 – Bulls Failed to Absorb Supply, Breakdown Confirmed"
"POC: 94,500.0 – Microstructure Breakdown Trigger"
"Bull/Bear Inflection: 91,911.8 – Critical for Macro Sentiment"
"London Open: 91,828.5 – Support Impulse Level"
Conviction weighting:
ADX rising above 22 confirms trend strength weakening into resistance. RSI divergence highlights momentum exhaustion with price making higher highs, but RSI printing lower highs. Open interest rising into supply suggests late long positioning, primed for failure as structure collapses.
This is a structural exploitation setup. Monitoring price behavior for confirmation or invalidation as liquidity thins.