WARNING: Something feels off...🚨 Something feels off... While CRYPTOCAP:BTC looks bullish on the surface, this pump shows signs of heavy manipulation:
🔸 Michael Saylor just bought $500M in Bitcoin.
🔸 The purchase was made during Easter weekend, when institutions were closed.
🔸 Today is still a holiday in the UK, and yet the pump occurred during Asian hours — highly unusual.
🔸 Meanwhile, the SPX500 is plunging, while CRYPTOCAP:BTC is rising — a rare decoupling.
🔸 Over SEED_TVCODER77_ETHBTCDATA:2B in leveraged longs are sitting between GETTEX:82K –$85K, vulnerable to liquidation.
📉 This could be a classic FOMO trap — pushing price high on low volume to lure in retail before a long squeeze.
Yes, CRYPTOCAP:BTC may be gearing for another leg up…
But an all-time high this week? Highly unlikely.
⚠️ Stay cautious. The confidence is getting excessive.
DYOR – Do your own research.
#Bitcoin #BTC #CryptoWarning #LongSqueeze #MarketManipulation #CryptoNews #MichaelSaylor #Altcoins #DYOR
BTCUPUSDT trade ideas

BTC GETTING BACK As of Now BTC has broken it's last resistance which was 85-86, so now i am looking for a pull back near 87-88 for a perfect long... For the target of new high or its last high.

Short BTC 2025BTC may drop slightly in value in the coming weeks. This is not investment advice, just analysis.

a bullish case for bitcoinBitcoin could reclaim its all-time highs, as it appears only mildly impacted by recent tariffs. If the trade war de-escalates and geopolitical tensions, such as the conflict in Ukraine, continue to subside, we may see enough trade stability and market clarity to fuel a bullish surge. A rally to $150,000 is plausible under these conditions. However, a consistently calm year seems unlikely, given Donald Trump's historically unpredictable leadership.

Bitcoin: $150K In May (Your Altcoins Choice & Market Update)Part 1 was titled, "Bitcoin $120,000 In April & $150,000 In May."
Do you think this is possible? We only have 8 days left for the month to be over, it would require a very strong advance for Bitcoin to trade at $120,000 this very same month.
Ok. It can happen but maybe not. Anything goes.
Bitcoin is now super bullish, ultra-bullish as it trades above $90,000.
Any buy below $80,000 is an awesome buy. Even buying Bitcoin below $90,000 would be a dream. That is how it will feel like for those joining the market in several months, but not all is lost.
Any buy below $100,000 is a great opportunity if you are focused on the long-term. Bitcoin is entering bull market territory and will grow for months, the biggest growth you've experience in years... The 2025 bull market.
Bitcoin is ultra bullish now confirmed, it will never trade below 80K.
This is the bullish phase that will change the financial world forever —Crypto is here to stay.
I am Bitcoin's #1 fan, please allow me to tell you so.
» Altcoins Market Update & Your Top Altcoins Choice
The market can shake and there can be doubt but Bitcoin will always recover and grow. The Altcoins right now are very strong.
The bullish bias has been confirmed, expect maximum growth. The Altcoins will be growing on average between 20-30X each by the end of the bull run. Some will grow 50-60X while others will grow 5-8X. Allow for strong variations.
Bottom prices are still available for some pairs but, once the action starts going these prices will be forever gone. The time to take action is now. A pair can trade at a price today and tomorrow it will be 100% up. There is no going back after that, so make sure to load up on the pairs you like the most.
Choose wisely, not everything will grow.
Some pairs can start growing within days while others can start growing within months. To avoid getting the stuck pairs you can always use a diversification strategy. Lower risk and higher potential for big reward.
Focus on the long-term. Think long-term. Buy and hold.
The strategy is very simple now: The bullish bias has been confirmed, higher highs and never new lows.
Never set a limit order as stop-loss (no stop-loss), instead, you can use a manual stop-loss or forget this tool altogether, you don't need it when the market is set to grow.
Visit my profile and read all the articles that I've been publishing in the past few days, it reveals all the bull market dynamics and the approach we need to take to achieve maximum success.
Your support is appreciated.
» Feel free to leave a comment with your favorite Altcoin and I will look for you into your chosen pair.
Thank you for reading.
Namaste.

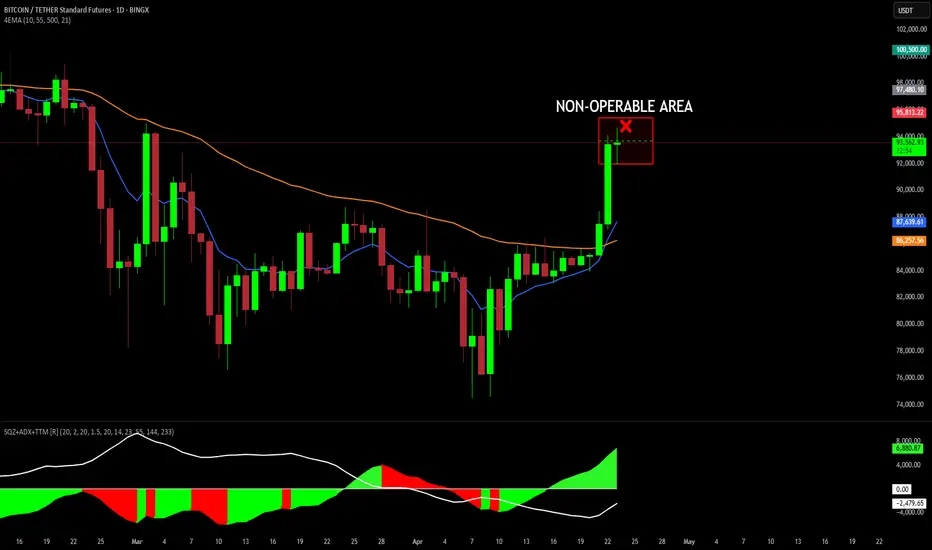
NON-OPERABLE AREA, 1D BTC/USDT ChartAfter a strong bullish impulse in 1D, above more moving averages generating a crossover of them, we do nothing. We wait for the price to retrace or make a range so that time in the SQZ runs out and the averages approach the price, thus generating its bullish pattern.
BITCOIN WILL CRASH!!! WELL YOU WILL SEE IT! ATTENTION!Bitcoin will crash it. This is my prediction of 98% i m sure

Short term bearish - BTC In analyzing the BTC/USDT daily chart, it's evident that the 20 MA has not crossed the 50 MA, indicating that we're not yet entering a bullish trend. 📉 Consequently, we are experiencing a short-term downtrend.
I anticipate a correction in the $86,500 - $89,000 zone. 🔄 Following this adjustment, I expect the bullish trend to potentially resume. 🚀

BTC Short Term If the uptrend continues and we see a bullish Total chart (i.e. we get volume support) then this pose will work.

BTC/USD: Do You Think Bitcoin Will Break Above $100K Again?By analyzing the #Bitcoin chart on the weekly timeframe, we can see that after our last analysis, the price successfully hit the $80,800 target and even dropped close to the second target at $73,700. Eventually, after forming a bottom around $74,400, Bitcoin saw renewed demand and has since surged to $93,600.
Take note: the $93,480 to $99,500 zone is a key supply area, and the primary expectation is for the price to face rejection from this level. However, after a possible short-term correction, I expect Bitcoin to resume its upward move toward targets above $100,000.
Please support me with your likes and comments to motivate me to share more analysis with you and share your opinion about the possible trend of this chart with me !
Best Regards , Arman Shaban
Latest Analysis :

BTC reach his topElliot wave count + Fibonacci time line shows btc gonna enter to a bear market soon

Bitcoin is currently testing a significant resistance zoneBitcoin is currently testing a significant resistance zone that aligns with the 8.618 Fibonacci extension, the value area low, previous point of control, and high time frame SR levels. This region also coincides with a potential point C in an ABCD correction based on Elliott Wave theory.
Key Points:
Price is reacting at point C of a possible ABCD correction, with technical confluence from major Fibonacci levels.
Rejection here could lead to a drop toward the $60K– FWB:67K region, aligning with wave D completion.
The current move up appears short-squeeze driven rather than organic, increasing the likelihood of a corrective rejection. If point C holds as resistance, Bitcoin may rotate lower, continuing the broader bearish market structure and validating the wave theory setup.

Going long on BitcoinBINANCE:BTCUSDT
Bitcoin has made a 5 wave move to the downside, it is forming a bullish RSI divergence on the 4-hour chart, it already shown climatic volume on the recent bounce, seems like downside should be limited from here in the short to mid-term. Long term, the trend is still down.
I expect a multi-week bounce from here, probably to the 50% retracement, around 92k, before continuing to move down to a deeper lower-low.
Good luck to you

Short it!Although we have not swept the range high there is a potential for a short from supply here.
I need to see a 5m confirmation here before I pull the trigger

Potential short trade alert - BitcoinAlthough we have not swept the range high there is a potential for a short from supply here.
I need to see a 5m confirmation here before I pull the trigger

BTC/USD sniper long thanks to Trump Tariffs. Hovering around 90k saw price at a discount at 98 and swung it till 95k with bullish momentum due to environmental events.

Bitcoin Overall: Significant RallyLast week I provided a less likely breakout up scenario--this is what occurred.
My personal emotional feeling is absolutely disbelief -- cue the various emotional cycle charts. The speed of the advance (after relatively vicious decline)...
The fact is, this is a rally with at least some staying power. If there is a significant retracement in the rally from the nearby resistances, we should at least expect a push to the large resistance. It the rally shoots relatively quickly to the big resistance, I would expect a significant retracement, but potentially thereafter new ATH.
The trend is up at the moment, carefully-selected long opportunities are more attractive. Shorts are dangerous in a market such as this except at strong resistance.

BTCUSDT|LONG"After analyzing the left side of the market and its historical price action, I believe the 90.747 level is a strong area to place a buy order, with clearly defined stop-loss and take-profit levels."


BTC/USDT Analysis – $100,000 Soon?!
Hello everyone! This is CryptoRobotics’ trader-analyst with your daily market analysis.
Yesterday, Bitcoin continued its almost uninterrupted upward movement and is now approaching our key long-term resistance zones.
In the coming days, we can expect a pullback within the bullish trend toward the $92,000 area, where a strong imbalance in delta and buying activity has been observed.
Now is not the time to fall into FOMO and enter long positions at market price — it's better to wait for the mentioned local retracement.
We've adjusted one of the buyer zones based on the broader context.
The previous $90,300–$89,500 (potential pushing volume zone) has now transformed into $92,000–$90,000 (strong buying imbalance zone).
Sell Zones:
$95,000–$96,700 (accumulated volume)
$97,500–$98,400 (pushing volume)
$107,000–$109,000 (volume anomalies)
Buy Zones:
$92,000–$90,000 (strong buying imbalance)
$88,100–$87,000 (absorption of market selling)
$85,500–$84,000 (accumulated volume)
$82,700–$81,400 (volume cluster)
$74,800 (key level)
$69,000–$60,600 (accumulated volume)
Do you think we’ll hit $100,000 this week?
Drop your thoughts in the comments — it’s always interesting to compare perspectives!
This publication is not financial advice.

TradeCityPro | Bitcoin Daily Analysis #70👋 Welcome to TradeCity Pro!
Let’s dive into Bitcoin and major crypto index analysis. As usual, in this analysis I’ll review the futures triggers for the New York session.
🔄 Yesterday’s Analysis
Yesterday, the price broke through the 88502 level, which was our main trigger for a bullish move. The price then made a very sharp upward move and even broke the next resistance at 92000, now heading toward 95307.
✔️ I also mentioned the RSI, saying if it enters the Overbought zone again, we could see a sharp leg toward 92000—and that’s exactly what happened, with strong upward movement.
🧲 I hope you opened a position, because all the triggers of my strategy were activated yesterday: the fake break of 84363, the breakouts of 85126, 85550, and 88502. These were the key trend-starting triggers, and I made sure to be in a position as those sharp candles formed to profit from the move.
🎲 So today it’s a bit harder to open new positions, which is natural, because 4 main triggers have already been activated. But I’ll try to share any new ones if they appear.
⏳ 1-Hour Timeframe
As you can see, we witnessed a very sharp move, with price consistently in Overbought, and now just exiting that zone.
⚡️ The triggers I can give today aren’t really based on support/resistance breaks. If you’re going to open a position, you should enter with minimum risk and based on momentum. That is, if you see bullish momentum coming in, go long.
☘️ You can use the SMA indicator or RSI oscillator for this. The price has pulled back multiple times to SMA7, and moved again with confirmation candles. You can also use this strategy with pullbacks to SMA25 or SMA99.
💥 The RSI is also a momentum oscillator, and if it re-enters Overbought, we could see more upside just like yesterday.
📊 In both strategies, make sure buying volume is increasing, and there is no volume divergence. Again, note that the main triggers have already been activated, and I believe the market needs to create a new structure before new entries. So today’s trigger is quite risky, and I personally won’t open a new position because I’m already in from lower levels.
🚀 If you, like me, have one or more open positions from lower levels, I recommend taking partial profit. If you have one position, take 40–50% off. If you have more than one, maybe close one entirely but keep at least one open.
👑 BTC.D Analysis
Let’s check Bitcoin dominance. Yesterday, with Bitcoin’s strong price action, dominance dropped slightly and was rejected at the 64.60 ceiling. That’s why some altcoins—especially in the DeFi category—saw strong rallies, and you could’ve opened positions on them.
💫 The next support is around 64.12, and I think BTC.D could drop to that level. A bullish trigger for dominance remains a break above 64.60.
📅 Total2 Analysis
In previous updates, I emphasized the 980 resistance level. I told you to try and have a long position ready if this level broke. As you can see, that’s exactly when the sharp move began. Now, even 1.02 has been broken, and Total2 is moving toward 1.04.
🔼 For long entries, confirmation from Bitcoin’s chart is more reliable since this index is highly correlated with BTC and is better for identifying targets or entries.
📅 USDT.D Analysis
As mentioned before, if 5.39 breaks in USDT.D, you should have a position ready. That level broke cleanly, gave entry triggers on the breakout, pullback, and break of pullback’s low, and then dropped sharply to 4.99.
🧩 Right now, USDT.D has reacted to 4.99 support, and I think the psychological 5% level has a strong impact here. I still believe the market is heavily dependent on Tether dominance, and if this support breaks, we could see another bullish leg in the market.
❌ Disclaimer ❌
Trading futures is highly risky and dangerous. If you're not an expert, these triggers may not be suitable for you. You should first learn risk and capital management. You can also use the educational content from this channel.
Finally, these triggers reflect my personal opinions on price action, and the market may move completely against this analysis. So, do your own research before opening any position.

BTC-----Buy around 91500, target 93000 areaTechnical analysis of BTC contract on April 23: Today, the large-cycle daily level closed with a big positive line yesterday, the K-line pattern continued to rise, the price was above the moving average, and the attached indicator was golden cross. It was said earlier that the trend had no continuity, so now the continuity has been achieved and the price has continued to break the high trend. In this way, the current large-scale upward trend is relatively obvious. Trading should still be short-term to prevent the risk of price retracement; the current price of the short-term four-hour chart deviates from the moving average, and the price returns to the moving average support position near the 91500 area. The hourly chart is currently under pressure and retreating, the K-line pattern is a single positive line, and the attached indicator is golden cross, so the trend will still be corrected during the day.
Today's BTC short-term contract trading strategy: sell directly at the current price of 92850, stop loss at 93300, target at 91500, buy at 91500, stop loss at 91000, target at 93000;

Lingrid | BTCUSD shifting SENTIMENT. End of CORRECTION Phase?BINANCE:BTCUSDT market initially made a false breakout below the March low before bouncing off this support level. Recently, prices broke through the downward trendline that showed the correction phase, suggesting sentiment is gradually shifting toward bullish. However, we should remain cautious as this could still develop into a false breakout. If that scenario unfolds, we anticipate the inverse head and shoulders pattern.
Notable resistance has emerged around the 84,000 level, with price action struggling to breach this threshold, highlighting its significance as a key zone. Going forward, the market will likely oscillate between 84,000 and 89,000 before potentially retesting the March high levels. Overall, we might have positive momentum and bullishness in the market towards end of this month, though this outlook remains vulnerable to any unexpected negative news that could impact price action. My mid-term goal is resistance zone around 94,800
Traders, if you liked this idea or if you have your own opinion about it, write in the comments. I will be glad 👩💻
