DeGRAM | BTCUSD Holds the Support Line📊 Technical Analysis
Price has broken the long‑term down‑trend and flipped the 84‑85 k supply zone into support; holding >83 k unlocks 92 k then 100 k.
💡 Fundamental Analysis
BlackRock’s IBIT pulled in $186 M net inflows last week.
Spot‑ETF flows remain positive, even at 2025’s weekly low.
MicroStrategy bought 6 556 BTC at $84.8 k, giving 13 k+ institutions indirect exposure.
Network hashrate hit a record >920 EH/s and topped 1 124 EH/s earlier this month.
✨ Summary
A confirmed breakout, resilient ETF demand, corporate accumulation and record network strength align for a push toward 92–100 k.
-------------------
Share your opinion in the comments and support the idea with a like. Thanks for your support!
BTCUPUSDT trade ideas

BTC Next Move - Bulltrap or Take-off?In todays overview, we will discuss the price action of BTC and what we could expect in the short-term.
What will we discuss?
- Bitcoin approaching key resistance
- Daily trendline break - But no higher high yet
- Stochastic RSI overbought on the daily timeframe
- Defining the daily range
- Downside targets within the range
- Final thoughts
-----------------------------------------------------------------------------------------------
Bitcoin Approaching Key Resistance
Bitcoin is now pressing up against a significant resistance zone in the $88,000 to $89,000 range. This area is dense with liquidity, and many stop-loss orders have likely accumulated just above the previous local wick. It's not uncommon in these scenarios for price action to briefly push higher, grabbing that liquidity and triggering those stops, before reversing direction. A short-term stop run followed by a move to the downside wouldn’t be surprising and would align with typical market behavior in these conditions.
-----------------------------------------------------------------------------------------------
Daily Trendline Break – But No Higher High Yet
On the daily chart, BTC has managed to break above a descending trendline that had previously capped price action. While that initial breakout was a promising sign for bulls, price has since been consolidating outside the trendline without yet printing a higher high. Until that happens, the overall market structure remains bearish on this timeframe. A confirmed higher high would be needed to shift the daily trend back to bullish.
-----------------------------------------------------------------------------------------------
Stochastic RSI Overbought on Daily Timeframe
The Stochastic RSI on the daily chart has been in overbought territory for more than a week, which is typically unsustainable for long periods. This kind of prolonged overbought reading often precedes a pullback. The key question is not if a correction will happen, but how deep it will go. Ideally for bulls, a minor pullback followed by a higher high would be constructive and could signal the beginning of a stronger upward move. But until then, caution is warranted.
-----------------------------------------------------------------------------------------------
Defining the Daily Range
Currently, Bitcoin is trading within a well-defined range between $75,000 and $88,000. This is the key zone that traders should be paying attention to. As long as price remains within this bracket, we are in a ranging market, not a trending one.
-----------------------------------------------------------------------------------------------
Downside Targets Within the Range
If price does get rejected at the resistance zone, downside targets to watch include support levels at $84,000, $80,000, and $75,000. These levels could provide bounce opportunities within the range. There’s no need to speculate on price moving significantly below $75,000 unless that level is cleanly broken. Similarly, upside targets beyond $89,000 shouldn’t be considered until we see a proper breakout and continuation.
-----------------------------------------------------------------------------------------------
Final Thoughts
We should treat the current market as range-bound until proven otherwise. That means respecting the range: moves into resistance zones near FWB:88K – GETTEX:89K are potential selling opportunities, while dips into support around $75K–$80K may be areas to look for buying setups. Until either support or resistance gives way, expect this chop to continue, and trade accordingly.
-----------------------------------------------------------------------------------------------
Thanks for your support.
- Make sure to follow me so you don't miss out on the next analysis!
- Drop a like and leave a comment!

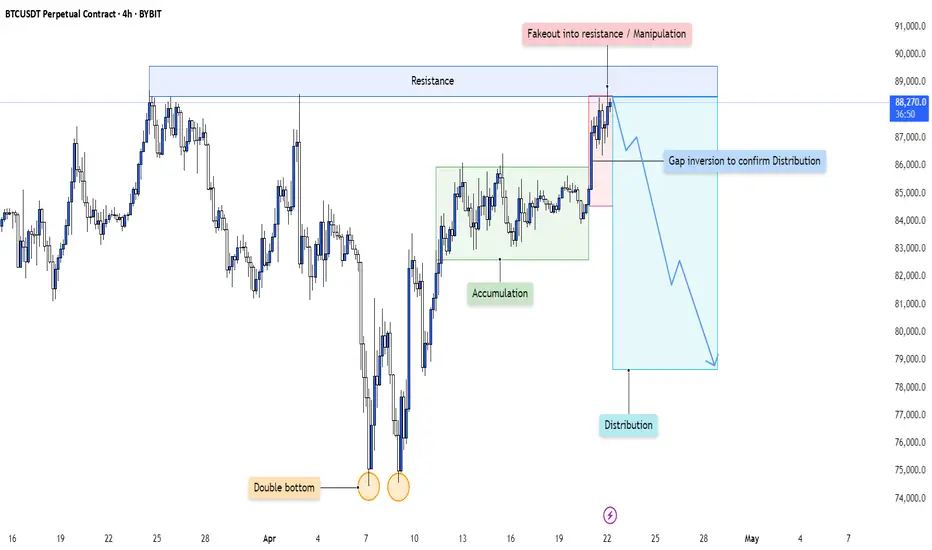
BTC - Distribution Confirmed After Accumulation Cycle CompletionThis 4H chart is a textbook illustration of how smart money cycles play out over time—starting with accumulation, leading into a sharp markup, and culminating in a deceptive distribution phase characterized by manipulation and false breakouts.
Let’s dissect each stage of this engineered move:
---
1. Accumulation Phase Following a Double Bottom
At the left of the chart, price forms a clear double bottom —a classic retail reversal signal.
- Smart money likely used this area to absorb sell-side liquidity, building long positions while retail traders expected further downside.
- This base formation set the foundation for the upcoming accumulation range , marked by sideways price action and multiple rejections from both highs and lows of the range.
The purpose of accumulation is simple: transfer supply from weak hands to strong hands. Every dip in this range allowed large players to fill bids without driving price too aggressively.
---
2. Sharp Markup and Resistance Interaction
Once positions were fully loaded, price launched into a strong impulsive move upward , confirming the transition from accumulation to markup.
- The move stalled at a clear horizontal resistance zone—marked as an area of prior supply and potential seller re-engagement.
- Price consolidated just below this resistance, building tension and liquidity in the form of breakout longs and stop orders from early shorts.
This led to the final stage of the cycle: distribution via manipulation.
---
3. Manipulation Above Resistance: The Fakeout
What followed was a classic fakeout above resistance .
- Price briefly broke above the key resistance area, attracting breakout buyers who assumed the trend would continue.
- In reality, this move served as a liquidity sweep and exit trap , allowing institutions to offload long positions accumulated earlier.
- The immediate rejection from this fakeout confirms a bull trap —a hallmark of distribution.
This is where smart money transitions from buyers to sellers while retail is left holding the bag.
---
4. Gap Inversion: Confirmation of Distribution
Post-fakeout, price creates a gap and immediately inverts back into the prior range , invalidating the breakout and forming a clear distribution schematic .
- The gap acts as a volume void or inefficiency , often revisited in reversal models.
- Once this area is rejected and price fails to reclaim the resistance zone, it becomes clear that distribution has been finalized.
- This breakdown marks the beginning of a markdown phase—typically faster and more violent than the markup.
The rejection confirms that price is now being delivered to the downside.
---
5. Narrative: From Accumulation to Redistribution and Collapse
This setup isn’t random—it’s narrative-driven:
- Double Bottom → Accumulation → Breakout → Manipulation → Distribution → Reversal
Each phase builds on the previous one, guided by smart money's intent to trap liquidity and maximize profit during transitions.
Now that distribution is confirmed, the expectation is continued downward delivery as price seeks out untapped liquidity and rebalances imbalances left behind during the markup.
---
Conclusion:
This 4H structure is a clear representation of the Wyckoff distribution model in action:
- Accumulation fuels markup.
- Breakout entices buyers.
- Manipulation traps them.
- Distribution unloads supply.
- Reversal completes the cycle.
The move down is not a random pullback—it is the deliberate continuation of a planned liquidity cycle . Expect further downside unless this structure is invalidated with a reclaim and break of the prior fakeout zone.
BITCOIN New Update (4H)Before anything else, we shouldn't forget that through multiple analyses shared from the bottom on higher timeframes, we knew Bitcoin was highly bullish.
The red zone from the previous analysis has been engulfed and cleared | a lot of sell orders have been absorbed, leading to a pumpy move. It’s better to wait for a pullback now.
The price has now reached a resistance zone, where a large number of sell orders have been absorbed, leading to a pumpy move.
Also, the diametric pattern is still visible, and after the completion of wave F | which has just occurred | a reversal is expected for wave G.
For risk management, please don't forget stop loss and capital management
Comment if you have any questions
Thank You

Bitcoin – Testing Major Resistance: 95k next target?Bitcoin is currently trading inside a significant resistance zone between $88,000 and $89,000. This area has acted as a strong supply zone in the past, evidenced by multiple rejections that led to notable sell-offs. The recent upward momentum that brought price back into this area was backed by a strong rally off the April lows, pushing through local structure and recovering critical levels. However, despite the strength of this move, price is now approaching a decision point where bulls need to prove continuation capacity or risk triggering another corrective leg.
Consolidation Structure
The current structure reflects a potential accumulation base forming below resistance, marked by a series of higher lows and a compression of volatility. This typically precedes a breakout, though it also heightens the risk of a sharp rejection should buyers fail to sustain pressure. The local trend remains bullish on the 4H timeframe, but the lack of follow-through above resistance so far suggests hesitation. Price is essentially coiling beneath a ceiling, building pressure for a breakout or breakdown move in the coming sessions.
Bullish Scenario
If Bitcoin is able to cleanly break above the $89,000 resistance level, the key confirmation will be a successful retest of this zone from above. This area, once flipped into support, would offer a strong launchpad for continuation toward the next key target at $95,000. This target aligns with the measured move projection from the recent range and also represents a psychological milestone that may attract momentum buyers. A confirmed breakout and retest would signal strength from bulls and invalidate the prior resistance structure, transitioning it into new support.
Bearish Scenario
Alternatively, if price fails to break above the resistance zone and prints another rejection, I expect a retracement to follow. The first major area of interest on the downside is the imbalance zone between approximately $84,000 and $85,500. This level also aligns with the 0.236 Fibonacci retracement, and given the inefficiency left behind from the recent rally, it serves as a logical short-term support area. A bounce here would not be surprising, particularly on the first touch. However, should price break below and close beneath this zone, it would indicate weakness and open the door for a deeper corrective move.
The next major downside target in that case would be the golden pocket between $79,500 and $80,500. This zone carries strong confluence: it’s formed by the 0.618–0.65 Fibonacci retracement, a previously unfilled price void (PVG), and the base of the recent rally. Price reaching this area would likely attract interest from both buyers looking for re-entry and shorts looking to cover. A reaction from this level could set the stage for a medium-term bounce or even a new accumulation phase.
Current Stance
At the moment, my stance is neutral-to-bullish while price remains within the resistance zone. I'm closely monitoring for a clean breakout and retest, which would trigger a long setup targeting the $95K area. Until that breakout occurs, caution is warranted due to the risk of rejection and retracement. If price breaks down from the current level, I will shift my focus to lower support zones, particularly the imbalance region and the golden pocket, for potential long opportunities or further confirmation of bearish momentum.
Conclusion
Bitcoin is at a pivotal point technically. The structure and momentum suggest the possibility of a bullish continuation, but confirmation through breakout and retest is essential. A failure to break and hold above resistance will likely initiate a retracement, with the imbalance zone serving as the first major test. If that zone fails, a trip toward the golden pocket at $80K becomes increasingly probable. This is a reactive zone-to-zone environment, and both breakout and breakdown scenarios offer actionable setups based on confirmation.
__________________________________________
Thanks for your support!
If you found this idea helpful or learned something new, drop a like 👍 and leave a comment, I’d love to hear your thoughts! 🚀
Make sure to follow me for more price action insights, free indicators, and trading strategies. Let’s grow and trade smarter together! 📈

Bitcoin Is Following Our Trading Plan Hello, Skyrexians!
As we told you new impulsive wave to the new ATH has been started below 80k for BINANCE:BTCUSDT and now price found some resistance. Next 2-4 weeks will be very difficult for traders and holders and we will explain you why.
On the 4h time frame we can see the new impulse which shall consists of 5 waves. Awesome oscillator tells us that this is the wave 3 inside this impulse and it can be over because of target area according to Fibonacci. The wave 4 can retrace to FWB:88K and it can happen very soon, but this time altcoins promised to remain strong. The next growth will happen to $94-95k in the wave 5. Dominance can reach our final target at 66%. The further correction to 0.61 Fibonacci below $85k will cause the atlseason and after that altcoins will grow in the very short period of time with the growing Bitcoin.
Best regards,
Skyrexio Team
___________________________________________________________
Please, boost this article and subscribe our page if you like analysis!

Phemex Analysis #75: Bitcoin (BTC) Breaking Out $90,000 Barrier!Bitcoin ( PHEMEX:BTCUSDT.P ) has demonstrated significant bullish momentum, decisively breaking through the critical $90,000 resistance level. This breakout follows a period of sustained accumulation and increasing institutional interest, signaling a potential continuation of the upward trend. The psychological significance of the $90,000 barrier being breached with strong volume suggests renewed investor confidence and could pave the way for further gains. Let's explore the possible scenarios for Bitcoin's price action following this significant breakout.
Possible Scenarios
1. Sustained Bullish Momentum
With the $90,000 resistance now acting as potential support, Bitcoin could experience sustained bullish momentum, targeting higher price levels.
Pro Tips:
Monitor volume confirmation on further upward movements. Strong volume indicates continued buying interest.
Identify potential new resistance levels, such as $95,000 and $100,000.
Consider entering long positions on pullbacks to the $90,000 support level, provided it holds.
Place stop-loss orders below the $90,000 level or a recent swing low to protect against a potential reversal.
2. Consolidation Above $90,000
Following the strong breakout, Bitcoin might enter a period of consolidation above the $90,000 level as the market digests the gains and establishes a new support zone.
Pro Tips:
Identify the range of consolidation, looking for clear support around $90,000 and a defined upper resistance.
Consider range-bound trading strategies within this consolidation, but be prepared for a potential breakout.
Phemex Grid Bots is one of the best tools to stay Profitable in Consolidate then Breakout scenario.
3. Potential Retest of $90,000
It's possible that Bitcoin could retrace to retest the $90,000 level as new support before continuing its upward trajectory. This is a common occurrence after significant breakouts.
Pro Tips:
Watch for strong buying pressure if the price retraces to the $90,000 level, indicating it's holding as support.
Look for bullish reversal candlestick patterns around the $90,000 zone.
Consider entering long positions on a successful retest with clear bullish confirmation.
Place stop-loss orders below the $90,000 level to manage risk in case the support fails.
Conclusion
Bitcoin's breakout above the $90,000 barrier is a significant bullish development. While sustained upward momentum is a strong possibility, traders should also be prepared for potential consolidation or a retest of the breakout level. By carefully monitoring volume, identifying key support and resistance levels, and implementing appropriate risk management strategies, traders can position themselves to capitalize on the potential opportunities presented by Bitcoin's current price action.
Pro Tips:
Elevate Your Trading Game with Phemex. Experience unparalleled flexibility with features like multiple watchlists, basket orders, and real-time adjustments to strategy orders. Our USDT-based scaled orders give you precise control over your risk, while iceberg orders provide stealthy execution.
Disclaimer: This is NOT financial or investment advice. Please conduct your own research (DYOR). Phemex is not responsible, directly or indirectly, for any damage or loss incurred or claimed to be caused by or in association with the use of or reliance on any content, goods, or services mentioned in this article.


Is the Altcoin Season Over?Is the Altcoin Season Over?
What's truly unfolding for Bitcoin is precisely the weekly analysis I've laid out for you. While many of you might be eagerly anticipating an extraordinary altcoin season, the harsh reality is that there isn't going to be one. Instead, we've been riding a Bitcoin-dominated season. And once the trend you see in the chart plays out, the market will essentially come to a close, paving the way for a heavy downward spiral for both altcoins and Bitcoin. It's a bitter truth, but it's the reality we're facing

BTC4 hours BTC is undergoing a mixed correction of wave 2. There is a possibility of an extension of the pattern after the end of the current 3.3.5 flat structure.

Update on BTC - Buy everything around 75K ! What happened with FOMC was a clear sign they want to Shakeout retail hard !
Sell here but buy everything at 75K
Buy BTC
Buy ETH
definitely buy DOGE dip
Buy ADA
& lastly Buy DYDX
Sell all your alts at 120K BTC
DCA on BTC until it bottoms and head for 140K
From 140K we might break the trend and move up to 160-180
But you can sell 10% Daily until that happens
Cycle Top would be 169K
Good luck

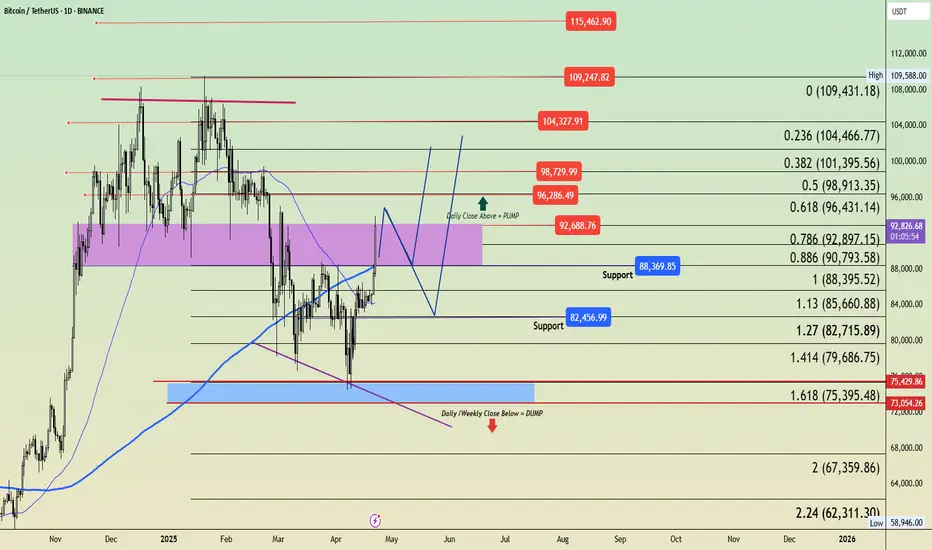
Here is the analysis of your BTC/USDT 1D chart. BTC/USDT – 1D Chart Analysis
Golden Cross Replay?
Two important moving averages in play:
50-day MA (red): ~84,341
200-day MA (green): ~88,546
Earlier in the chart (circled on the left), BTC broke above both MAs, starting a strong bullish rally towards $120K.
We are potentially seeing a repeat of that pattern now
Breakout Confirmation
The price broke out of the descending triangle pattern (black trendline) — a bullish signal.
Strong breakout volume (green arrow) indicates conviction.
A retest of the breakout level (yellow area) at ~$92,000–$93,000 as support could confirm continuation.
Key Levels
Support: FWB:88K –$90K
Breakout Zone: ~ GETTEX:92K
Target Zone: $110K–$120K range if momentum continues
Golden Cross-like structure forming again
Downtrend resistance broken
Retest at horizontal resistance in progress
Look for confirmation of holding above the yellow zone to target higher levels
@CRYPTOSANDERS always provides crisp chart alpha.
NFA – DYOR
Share your thoughts or setups!

cash on BTCits time for profit taking for some,
possible scenarios
atleast 200% can be made here
cleary there there was an inverse HnS with target until 96K the price is likey
to csmash that resisttant line and peak up yo 106K where the initial reversal began in Jan. could it be a triple top and continue decline below 60k OR make its way towards our weekly main target tagged below
good luck

BITCOINPresident Donald Trump's repeated public calls for immediate and preemptive Federal Reserve interest rate cuts have had a notable bullish impact on Bitcoin buyers in April 2025. His criticism of Fed Chair Jerome Powell for maintaining higher rates amid easing inflation and his threats to remove Powell have injected significant uncertainty into traditional markets, which has driven investors toward alternative assets like Bitcoin.
Shift in Market Sentiment: Trump's aggressive stance against the Fed and calls for rate cuts have fueled expectations of looser U.S. monetary policy, which typically boosts liquidity and risk appetite. This environment encourages investors to allocate more capital to risk assets, including Bitcoin, seen increasingly as a "digital gold" hedge amid macroeconomic uncertainty.
Safe-Haven Appeal Amid Market Volatility: As equity markets plunged due to trade war fears and political tensions, Bitcoin maintained resilience, benefiting from a flight to alternative stores of value alongside gold, which also rallied to record highs.
Speculative and Institutional Positioning: Both retail traders and institutional investors have been positioning for a potential Fed easing cycle, driving accumulation in Bitcoin ahead of anticipated rate cuts.
In essence, Trump’s rate cut rhetoric has energized Bitcoin buyers by raising expectations of easier U.S. monetary policy and increased liquidity, which historically supports higher crypto prices. This has translated into a rapid price rebound, higher trading volumes, and sustained bullish momentum in the Bitcoin market.

Chart Pattern Analysis Of Bitcoin.
After K0 break up the long-term downtrend line,
K1 tested under low volume.
K2 keeps breaking up to verify another bull run here.
I will try to buy it if the following candles fall back to test 86.5K-85.5K.
Long-85.9K/Target-91K/Stop-85K

#BTCUSDT – Momentum Builds, $93K in Sight… What’s Next?#BTCUSDT Update! 🚀
Bulls have delivered strong momentum, breaking above the FWB:88K zone and pushing up to $93K — a move we haven’t seen since early 2025. That’s a massive +10% daily candle on BTC, a clear sign of market strength.
Meanwhile, gold faced a sharp rejection from its ATH, dropping nearly $200 from $3500 to $3325 on the daily chart. This highlights a shift in liquidity and profit-taking—BTC is clearly the beneficiary. BITCOIN🔥
🔍 BTC Technical Breakdown:
BTC has now broken out above the daily resistance zone, including the 200-day MA, and is hovering just below the mid-term key area of GETTEX:92K –$93K.
This range previously served as solid support for nearly 90 days, from Nov 25, 2024, to Feb 25, 2025.
➡️ The Real Test Now:
Can the bulls flip this zone into support and drive us toward new ATHs?
The next few days will tell.
📌 My Personal Bias:
If momentum continues, I expect BTC to stall between $93K–$97K.
A pullback to FWB:88K would be a healthy retest of broken resistance.
If bulls hold that level, we could see a clean breakout continuation.
If not, BTC may revisit the $84K–$81K range before mounting another attempt upward.
This movement aligns with the Plan A I’ve followed since February and confirms our broader strategy:
Chart PLAN A&B Below!
💬 If you’re wondering what I’m doing right now…
You might ask:
✅ Should I keep my investment?
✅ Should I book some profits?
✅ Should I open a new position?
Here’s what I did:
My team and I secured half of our profits around GETTEX:87K – FWB:88K , and some between $91K–$93K.
We’re holding the rest and ready to buy again on any retrace—if price plays out as expected.
It’s part of our proven strategy: Secure profits, stay exposed, and prepare for the next wave.
📢 Public Trades Update:
🔹 Entry Avg: $79K - $78K
✅ Sold 25% at $85K
✅ Sold another 25% at $92,7XX
🟢 Still holding 50%
🔹 Entry Avg: $79,900 - $77,500
✅ Sold 35% at $81K
✅ Sold another 35% at $92,7XX
🟢 Holding the rest
📌 Short-term traders: Use tight SLs and focus on solid levels.
📌 Long-term investors: (This part is done).
💡 If you ignored our updates from $103K - GETTEX:98K and got stuck at the top, it's only a matter of time before the market pumps again—just ensure you can benefit from movements & dips
⚠️ Risk Management & Altcoins
🔸 Altcoins are still highly reactive to BTC’s retracements.
🔸 Stick to the plan, don’t trade emotionally, and keep FIAT ready.
📌 Final Thoughts – Stay Disciplined!
✅ Don’t FOMO if you missed our buy levels—we shared them early.
✅ Don’t chase resistance—wait for clear confirmation.
🔹 Execute smart, protect your capital, and stay patient.
Please keep in mind that this is not financial advice and the purpose of these charts is to provide an idea of coin movement, not buy or sell signals. The cryptocurrency market is highly volatile and not suitable for everyone, so be aware of the potential risks before making any investment decisions. The information presented here is a personal effort and is subject to success or failure, and we welcome constructive criticism.
Good luck to all.
🙏we ask Allah reconcile and repay🙏
Just a bearish thought following this huge pump for BTCParty pooper alert!!! I just want to give the bearish view for context here for anyone new in the group. Pulling a FIB gives us a golden pocket at approx 87k which is also confluent with the Value area low (VAL - 86,962) from the high range that is the yellow box. Don't forget to pay yourselves and have the capital if we do return to 87k... just my thoughts.... what do you think?????

If the resistance is broken, it will be launched to resistance 1I expect that the resistance in breaking the first resistance was completed successfully in the solution, there is no return to the back after it 2 and 3 exits. I expect with RSI a high percentage of success.

Bitcoin Potential DownsidesBINANCE:BTCUSDT Hey Traders, in today's trading session we are monitoring BTCUSD for a selling opportunity around 89,500 zone, Bitcoin is trading in a downtrend and currently is in a correction phase in which it is approaching the trend at 89,500 support and resistance area.
Trade safe, Joe.

BTC short squeeze....expect a major drop soonA lot of love for BTC under most times, but this looks like a classic short squeeze. Expect a big pull back soon when the hot air balloon pops!
Best of luck and always do your own due diligence!

Time for some correctionsHello, last week I said on both the weekly and 4-hour charts that Bitcoin would touch 91k. Bitcoin seems to have completed microwave 3 and now it is time for the start of microwave 4. I predict that Bitcoin will fall at least to 87,500 and then can rise and touch 95k with the start of microwave 5.

BTC LONG TERM HTF SWING BUYSweekly shift, daily bullish confirmation , we could wait for fundamental to cause the crashand panic to push price to fill our zone

SELL THE RALLIES Great oppurtunity to grab this move
Not finanacial advice
Risk and reward is what make a trader to professional trader so do consider that
Targets around 85k 84700
STOPS ABOVE 92K
