BTCUPUSDT trade ideas

My swingsight on bitcoin,possible area of target $120K to $140KFrom impulsive move to pullback all marked (rectangle/golden zones) were being respected.I am now expecting another impulsive move to the upside particularly on $120K to $140K.DYOR and TAYOR.

12/05/25 Weekly OutlookLast weeks high: $104,972.46
Last weeks low: $93,385.49
Midpoint: $99,178.97
Bitcoin climbs over 12% from weekly low to weekly high, an incredible achievement despite a mixed performance in Tradfi. A pattern we've seen since the $74,500 double bottom following Liberation day goes; A strong rally for a week, consolidation in a tight trading range for a week, then repeat. Should this pattern continue we should see consolidation between weekly high and $102,075 (0.75 line).
CPI & PPI take place this week on Tuesday and Thursday respectively, inflation is still a big talking point but baring a crazy print I would be surprised if these events move BTC. In the last few hours at time of writing The US has reduced tariffs on China to 30% for 90 days, China has reduced tariffs on the US down to 10%. To me this signifies the worst of the trade war narrative is behind us.
This week I will be tracking altcoins with strong fundamentals as BTC.D rolls over from its highest point since January '21, ETH has already had a strong breakout from the downtrend and with BTC at ATH levels with strong resistance this should be the time to see altcoin strength and play catch-up.
Good luck this week!

#BTCUSDT SELL CHART The chart you've shared is a 45-minute candlestick chart for BTC/USDT on Binance, with a technical analysis overlay suggesting a potential bearish move. Here's a quick breakdown:
Highlighted Zone (Top, around 104,348 USDT): This appears to be a resistance or supply zone where the price has reversed previously.
Highlighted Zone (Bottom, around 102,853 USDT): This is marked as a potential support or target zone.
Blue Arrows and Patterns: These indicate a projected bearish move, likely based on a harmonic or price action pattern such as a double top or head and shoulders.
Red and Green Box: This shows a risk-reward setup — red is the stop-loss zone (above resistance), green is the take-profit zone (near support).
This chart suggests the analyst is expecting a short-term decline toward the 102,800 range.
Would you like help analyzing this setup further or converting it into a trading plan?

BTC on the edge of two way📊 Bitcoin Macro Scenarios — What’s Next?
We’re at a critical junction for BTC. The chart outlines two high-probability paths:
🔴 Scenario 1 (Red): Bullish breakout toward $175K with an initial target near $146K, marking the final impulse wave of this cycle before a potential major correction.
🔵 Scenario 2 (Blue): Mid-term pullback to retest the IDM zone around FWB:65K , before resuming the larger uptrend into 2026.
Key Levels:
• First Target: $146,800
• End Point: $175,500
• IDM Reclaim Zone: ~$65,000
Below the chart, our custom Long Short Dom (VI+) indicator confirms increasing bullish pressure — but divergence zones are also forming ⚠️
This is a make-or-break region. Patience and positioning will be key.
📅 Eyes on Q2–Q3 2025 for confirmation.
🧠 What’s your take — do we rocket or retest?

Bitcoin - Buy to sell set-upImo Bitcoin is forming a big three drive pattern. So the next move is expected to hit $160k and after that there will be a crash to $61k. Happy trading!
NFA. DYOR

BTCUSD SELLGiven the resistance levels and the hidden divergence, it returned to the previous support level.

BITCOIN READY FOR 108K AND 113K.BTC HAS STARTED ITS UPWARD MOVE AND HIGHER CHANCES OF HITTING 108K AND 113K.
THIS can be a good chance to buy Btc.
1- Use stop.
2-Break even at 1 ratio 1 or half stoploss least.
3-Dont give market all profit nor book all profit put some at breakeven and let trade move.
4-If h4 fvg didnt work then wait for whole fvg to be filled and long again when filled.
Good luck guys.

Scenario #BTCUSDT long📉 LONG BYBIT:BTCUSDT.P from $104,353.0
🛡 Stop loss: $103,572.0
🕒 Timeframe: 1H
✅ Market overview:
➡️ The price confidently broke above $103,729 and held, confirming the uptrend.
➡️ The next target zone is $104,720–$105,090 — nearest movement objectives.
➡️ Volume increased during the impulse, indicating strong buyer presence.
➡️ A local support level formed around $103,729 — on a pullback, this zone may hold the price.
➡️ POC at $94,479 remains far below — the market has left the balance zone and is trading in an impulsive phase.
🎯 TP Targets BYBIT:BTCUSDT.P :
💎 TP1: $104,720.0
💎 TP2: $105,090.0
💎 TP3: $105,275.0
⚠️ Important: current structure BYBIT:BTCUSDT.P suggests possible correction (wedge breakdown), requiring caution or exit on key level loss.
⚠️ Despite the initial long from $104,353, a breakdown below $103,572 (stop loss) invalidates the long setup.
📢 If H1 closes below $103,572 — better to exit, scenario invalid.
🚀 Scenario BYBIT:BTCUSDT.P valid while holding above $103,729 — below that, correction likely toward lower targets!

Bitcoin for sell i like this potential sell for bitcoin because of the next reasons:
-Previous liquidity swept
-Forward volume gap / imbalance
-Change of character
-Harmonic pattern

BTCUSD STRONG BUY AREA BTCUSD strong buy area wait for market come these level and we will buy for swing trade at this we have trade to some scalping ( logic ) RBS level+tredline+liqudity
Stay tuned

BTCUSDT - Potential Long Setup Developing from FVG and Fib levelOverview:
Bitcoin (BTCUSDT) on the 1H timeframe is currently exhibiting a controlled retracement following a local top. This structure presents a potential opportunity for a long setup based on confluence between an FVG (Fair Value Gap) and key Fibonacci retracement levels. The chart highlights a likely scenario where price may continue to correct lower into a defined area of interest before resuming bullish momentum.
Market Context:
After a strong impulsive move upward, BTC appears to be in a corrective phase. The recent price action has formed a series of lower highs and lower lows, which is characteristic of a short-term downtrend within a broader uptrend context. This kind of pullback behavior is often necessary for healthy continuation to the upside and can offer high-probability entries for trend continuation traders.
Fair Value Gap (FVG):
A notable fair value gap has been identified in the 94,250–94,700 zone. This zone represents an inefficiency in the market where price rapidly moved without significant opposition, leaving behind a gap between wicks of adjacent candles. Price often returns to such areas to rebalance order flow before making its next decisive move.
Fibonacci Confluence:
The chart includes key Fibonacci retracement levels drawn from the recent swing low to swing high.
* The 0.618 Fibonacci retracement level lies just above the FVG, providing strong technical confluence.
* The 0.65 level is marked as the ideal entry zone and sits within the FVG, further validating it as a high-probability support region.
* The 0.786 level is also marked, and although deeper, it represents the final line of defense for this bullish scenario.
Anticipated Price Action:
A bullish projection is illustrated on the chart where price is expected to:
1. Continue declining toward the 0.65–0.618 Fibonacci confluence zone.
2. Wick into the FVG and reject from that level.
3. Form a short-term higher low structure and push back to reclaim prior structure highs.
4. Confirm bullish structure continuation with an impulsive breakout from the descending channel.
Market Structure and Liquidity Outlook:
The broader structure remains bullish on higher timeframes. The retracement into the FVG would serve the dual purpose of:
* Grabbing liquidity below recent lows.
* Mitigating unfilled buy-side inefficiency.
Such a development would suggest that institutional participants are filling long orders in the discounted price region, setting the stage for a potential continuation of the broader bullish trend.
Key Technical Zones:
* FVG Zone: 94,250 – 94,700
* Fibonacci Confluence: 0.618–0.65 retracement levels
* Liquidity Pool: Below current swing lows leading into the FVG
Conclusion:
BTCUSDT is approaching a critical decision zone. A move into the FVG combined with Fibonacci retracement confluence presents an attractive area for potential long entries. Confirmation of bullish reversal structure within this zone could offer a strong trade opportunity in alignment with the broader trend. Patience and precision will be key in waiting for the price to tap into this area and show intent to reverse.


BTC 1H Chart setupThis chart features BTC on a 1-hour timeframe with a 50-period SMA, RSI(14), and trend lines. Created for technical analysis and personal reference. Shared for transferring to another account.

Bitcoin Low Time FrameBitcoin create a double top formation in low time frame
if 101.5 can hold its great, maybe some consolidation and chop
but if we break 101.5 i think 98k is possible

Bitcoin | Short | Target 92kThis technical analysis is for informational and educational purposes only. It does not constitute financial advice. Remember to always research and consult with a professional before making investment decisions. Good luck! 📈💼🚀
Shark infested waters, Bitcoin in the 60k rangeAs the world prepares for a 200k btc run. Bitcoin is headed to Shark infested waters, where the deep money sharks are waiting to load up. All of this after a rejection the 100k range.
Trump news, india news, china news... doesnt matter.
The pump you saw from 77k to 100k was merely a lunch meeting for the rich.
The matrix has blinded you.

BTC TargetsIn my experience, my bitcoin targets for this cycle in consider to symmetrical movement could be one of the upper prices.

SHARE THE IDEA ABOUT BTCUSD BEARISH PATTERNCurrent Market Overview:
Price Action: Bitcoin has rallied approximately 40% from its April lows, reaching a high near $105,525 today.
Support Levels: Key support is identified around $100,000, with additional support near $92,000.
Resistance Levels: Immediate resistance is observed around $107,000, with a potential upside target near $120,000 if bullish momentum continues.
Bearish Pattern Analysis:
While the broader trend remains bullish, certain patterns indicate possible short-term bearish movements:
Head and Shoulders Formation: Some analysts have noted a potential head and shoulders pattern forming, which could signal a reversal if confirmed.
Momentum Indicators: The Relative Strength Index (RSI) is above 70, suggesting overbought conditions that might precede a pullback.

BITCOIN → Correction to the risk zone. Rise or fall?BINANCE:BTCUSDT has updated its local maximum to 97,900, the market structure is quite positive, but still depends on the fundamental background and the behavior of the S&P 500.
The fundamental reasons that influenced the growth are the improvement in the tariff situation in the US and relations with China. Bitcoin's growth strengthened as the SP500 index rose, with which it has a fairly high correlation. In the second half of this week, the price broke out of the two-week consolidation, breaking through the resistance level of 95,500 and updating the local maximum. A correction is forming within the local upward channel.
95,000 is the liquidity and risk zone. That is, if the bulls hold their defense above 95K during the retest, Bitcoin will continue to grow in the short and medium term. Otherwise, a break of 95K could trigger a drop to 92K-88K.
Resistance levels: 97,425, 99,475
Support levels: 95,500, 92,000
All eyes are on the 95.5K support level, below which a huge liquidity pool has formed. Growth may be influenced by a retest (false breakout of support) and an imbalance of forces in the market. But we need to be careful, as the market will react to economic data. BUT! A return of prices to the selling zone (below 95000 - 95500) and the inability to continue growth could trigger a correction and liquidation.
Best regards, R. Linda!

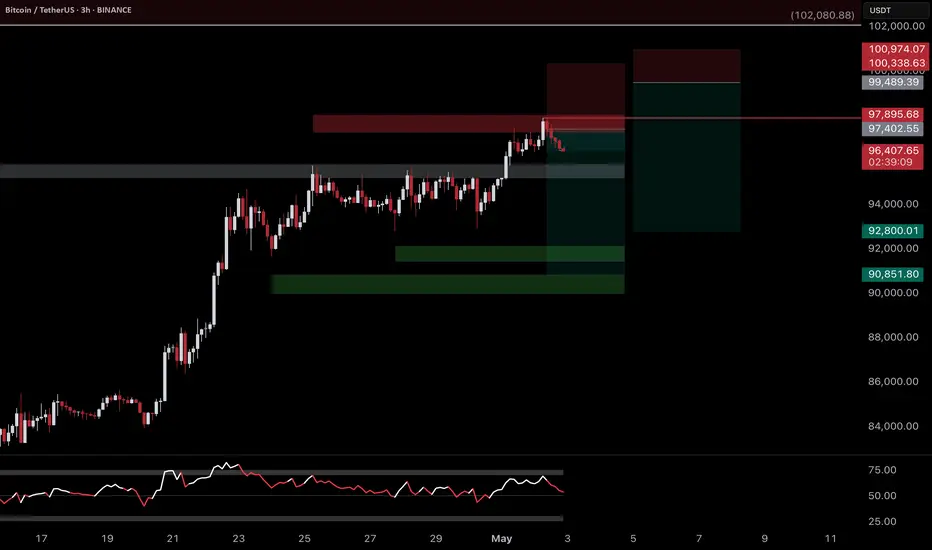
BTC Pulls Back Below POC — Short-Term Trend Still in ControlAfter rejecting from dynamic resistance, BTC is back under the point of control (POC). The short-term trend remains bearish, and bulls need to reclaim key levels to shift the tone.
Overview:
Bitcoin has slid back into the local range after failing to hold above a key resistance area. This rejection lined up with a bearish harmonic pattern and a swing failure at recent highs, leading to a clean pullback.
We’re now seeing price consolidate around the point of control (POC) from the move that started April 23rd — a level that’s been pivotal for both buyers and sellers.
Key Technical Insights:
Dynamic Resistance Holding Strong: Lower highs continue to form under this key trendline — bulls have yet to break structure.
POC Acting as Resistance: BTC is currently holding below the volume node — further rejection here increases the chance of range continuation.
Short-Term Trend Dominates: Lower highs and lower lows have formed a clean downtrend on lower timeframes. Without a shift, this could start spilling into higher timeframe momentum.
Market Context:
The lower-timeframe structure has held steady for over a week, and the failure to form a higher low is keeping downside pressure intact. Volume is concentrated at the POC, suggesting the market is at a decision point — resolve above it, or rotate toward the lower range.
Right now, the structure leans bearish until price breaks above the dynamic resistance or prints a higher low.
What to Watch Next:
If BTC continues to reject from the POC and dynamic resistance, expect further pressure to the downside and possible tests of range support. Reclaiming the POC would be the first signal of potential recovery — but until then, the short-term trend favors caution.

Bitcoin (BTC): Waiting For Re-Test To $92,000 AreaBitcoin has recently formed a fake BOS, which is now sending the price down and forming BOS on smaller timeframes, showing the dominance that sellers are holding currently.
For us to see a proper upward movement or any kind of movement at all, we need to reach some kind of major zone, which would be the area near $92K.
We expect the price to fall near this zone, and once we are there, we will be looking and monitoring for market structure development. If we see dominance from buyers, we go long, and if we see dominance from sellers, then we short there.
Swallow Academy

#BTCUSDT:Price Moving Well From $88,000 to $96,000,Next $128,000Bitcoin has moved well from our last idea of $88,000 to $96,000. However, a small correction is expected, which could be a good point to enter a swing trade. This could take the price to a new record high of around $128,000.
We have three targets, but each can be set based on your overview. The last three candles are not clear, so it’s best to wait for price to have a clearer indication of its next move.
We wish you the best and good luck in your trading journey. Thank you for your unwavering support! 😊
If you’d like to contribute, here are a few ways you can help us:
- Like our ideas
- Comment on our ideas
- Share our ideas
Team Setupsfx_
❤️🚀
