Millions Of Trades Liquidated —Bitcoin Flash Jump Beyond $100KMillions of people are about to get liquidated. The thing is that they set up their orders so that liquidation only happens above 100K and they think they will be able to close their position before Bitcoin reaches that level if it doesn't break down.
First, Bitcoin is not breaking down. Just notice that every time there is any type of bearish action it is quickly bought.
Second. No, no second that's all.
Bitcoin is set to grow and will do so in a flash. Rather than a flash crash, a flash advance.
Bitcoin always surprises so prepare because this is what will happen. Rather than going down as the majority actually expect, Bitcoin will break-up and do so strong, so strong that there will be no time to react. People will be caught in the shock and while they wait to look around and see what happens, Bitcoin will be moving up.
Instead of $100,000, it will go to $102,000 or $104,000 or higher just to make sure that all the over-leveraged are kicked out before additional growth.
This is just a friendly reminder.
Pray for the dead bears and people without a clue, they are about to lose everything, for them, it will be tough.
On our side though... Enjoy the profits as they come.
Namaste.
BTCUPUSDT trade ideas


BTCUSDT trading signal analysis- Bullish Channel as an corrective pattern in Short Time Frame
- Break of Structure
- RSI - Divergence
- Change of Characteristics
- Completed " 123 " Impulsive Waves

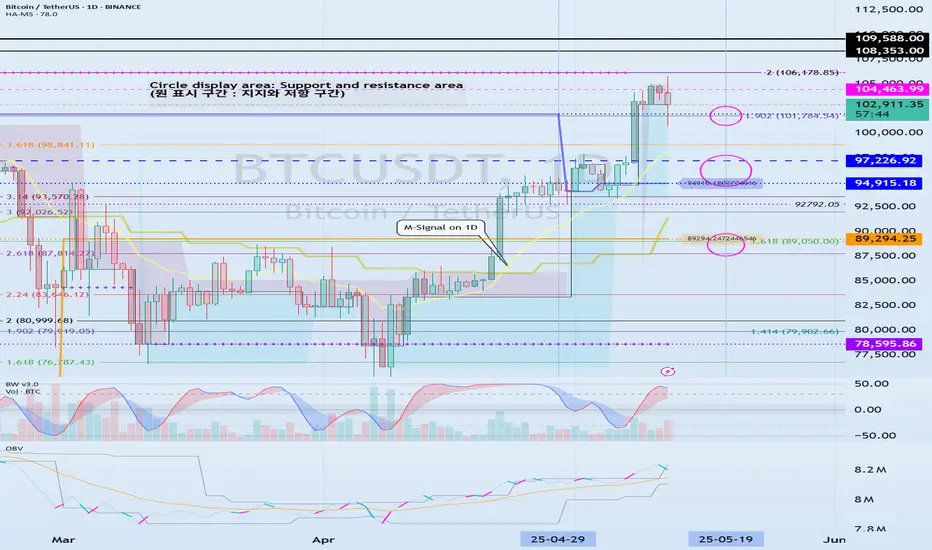
Important section: 101947.24-106133.74
Hello, traders.
If you "Follow", you can always get new information quickly.
Have a nice day today.
-------------------------------------
(BTCUSDT 1D chart)
It has touched the Fibonacci ratio 1.902 (101784.54) and is rising.
The key is whether it can receive support near the StochRSI 50 indicator (102971.99) and rise.
If not, it can fall to the 94915.18-97226.92 area.
Since the HA-Low indicator is formed at the 89294.25 point, it is important whether the price can be maintained above that point.
If the StochRSI indicator falls below the overbought range and then rises while moving sideways around the Fibonacci ratio range of 1.902 (101784.54) ~ 2 (106178.85), it is expected to renew the ATH.
Even if it falls more than expected, if it rises along the M-Signal indicator on the 1D chart, it is highly likely to renew the ATH.
----------------------------------------------------------
I will explain the newly added indicators, StochRSI 50, StochRSI 80, and StochRSI 20.
The disadvantage of interpreting the StochRSI indicator added as an auxiliary indicator is that it cannot determine the price movement.
Because of this, when interpreting the StochRSI indicator so far,
- Whether it is in the overbought or oversold zone,
- Whether StochRSI is above or below the 50 point,
we interpreted it as above.
Therefore, we added the price movement to the StochRSI indicator to check the movement more accurately.
-
The StochRSI 50 indicator is literally created when the StochRSI indicator passes the 50 point.
Therefore, we need to think about a response plan based on the price StochRSI 50 indicator.
-
The fact that StochRSI 80 is created means that the StochRSI indicator has risen above 80.
Therefore, in order to continue the upward trend, StochRSI must rise above 80.
If StochRSI 80 is not created and only StochRSI 20 is created, the upward trend will occur when the price is maintained above the StochRSI 50 indicator.
-
The fact that StochRSI 20 was created means that the StochRSI indicator has fallen below 20.
Therefore, in order to continue the downtrend, it must fall below StochRSI 20.
If StochRSI 20 is not created and only StochRSI 80 is created, the downtrend will occur when the price is maintained below the StochRSI 50 indicator.
-
Thank you for reading to the end.
I hope you have a successful trade.
--------------------------------------------------
- This is an explanation of the big picture.
I used TradingView's INDEX chart to check the entire range of BTC.
I rewrote the previous chart to update it by touching the Fibonacci ratio range of 1.902 (101875.70) ~ 2 (106275.10).
(Previous BTCUSD 12M chart)
Looking at the big picture, it seems to have been following a pattern since 2015.
In other words, it is a pattern that maintains a 3-year bull market and faces a 1-year bear market.
Accordingly, the bull market is expected to continue until 2025.
-
(Current BTCUSD 12M chart)
Based on the currently written Fibonacci ratio, it is displayed up to 3.618 (178910.15).
It is expected that it will not fall again below the Fibonacci ratio of 0.618 (44234.54).
(BTCUSDT 12M chart)
I think it is around 42283.58 when looking at the BTCUSDT chart.
-
I will explain it again with the BTCUSD chart.
The Fibonacci ratio ranges marked in the light green boxes, 1.902 (101875.70) ~ 2 (106275.10) and 3 (151166.97) ~ 3.14 (157451.83), are expected to be important support and resistance ranges.
In other words, it seems likely to act as a volume profile range.
Therefore, in order to break through this section upward, I think the point to watch is whether it can rise with support near the Fibonacci ratios of 1.618 (89126.41) and 2.618 (134018.28).
Therefore, the maximum rising section in 2025 is expected to be the 3 (151166.97) ~ 3.14 (157451.83) section.
To do that, we need to look at whether it can rise with support near 2.618 (134018.28).
If it falls after the bull market in 2025, we don't know how far it will fall, but considering the previous decline, we expect it to fall by about -60% to -70%.
So, if the decline starts near the Fibonacci ratio 3.14 (157451.83), it seems likely that it will fall to around Fibonacci 0.618 (44234.54).
I will explain more details when the downtrend starts.
------------------------------------------------------
Bitcoin (BTC): Liquidity Grab Happened, Bullish CME Got FilledBuyers showed a strong dominance during the Asian session, where we had strong candles forming, which filled the bullish CME gap and formed some sort of resistance zone.
As we had a stronger rejection near the resistance zone, now we are going to look for possible MSB in the current area, which would give us similar downward movement.
We are going to wait for MSB as long as we are below the liquidity line.
Swallow Academy

#BTC/USDT Bullish Crossover in Play!CRYPTOCAP:BTC Update: Bitcoin is currently holding support and showing signs of strength with a bullish EMA crossover — the 50 EMA crossing above the 100 EMA, which historically signals upward momentum based on past fractals.
The lower support zone is marked in blue, in case the price dips further.
Immediate resistance remains at the GETTEX:98K level — a confirmed close above this could trigger a move toward $103K.
Stay tuned for more real-time updates.
Do hit the like button if you like it, and share your views in the comments section.
Thank you
BTC/USDT Crypto Heist - Bullish Breakout Blueprint!🔥 Thief Trading Style: BTC/USDT Bullish Heist Plan 🔥
Greetings, Money Makers & Market Robbers! 🤑
Ready to execute a daring heist in the Bitcoin vs. Tether (BTC/USDT) crypto market? 📈 Our Thief Trading Style combines technical precision and fundamental insights to target a bullish breakout. Follow this charted strategy to ride the wave and exit before the risky Red Zone. Let’s grab those profits together! 💪🎯
---
📊 Trade Setup: The Heist Plan
- Market: BTC/USDT (Crypto) 🌐
- Bias: Bullish Breakout 🌟
- Timeframe: 1D (Swing Trade) ⏰
Entry 📈:
- Breakout Entry: Wait for a clean breakout above the Moving Average (MA) at 108000. Place Buy Stop orders just above 108000 to seize the momentum. 🚀
- Pullback Entry: For lower-risk entries, set Buy Limit orders at the recent 15M/30M swing low (e.g., 105000-106000) to catch pullbacks. 📍
- Trader Tip: Set a TradingView alert for the 108000 breakout to stay ahead of the move! 🔔
Stop Loss 🛑:
- Breakout Traders: After the breakout confirms, place your Stop Loss below the recent 1D swing low at 96000 to guard against reversals. ⚠️
- Pullback Traders: Tailor your Stop Loss to your risk appetite (e.g., 1-2% of account). Adjust based on lot size and multiple orders. 📏
- Risk Alert: This heist is high-stakes! Stick to disciplined position sizing to protect your capital.🔥
Target 🎯:
- Aim for 122000, near the risky Red Zone (an overbought area prone to consolidation or reversal). 🏴☠️
- Exit Strategy: Consider taking profits early if bearish signals (e.g., high volume, reversal candles) emerge near 122000. 💸
Scalpers 👀:
- Stick to Long-side scalps with tight trailing stops. Join swing traders for the full heist or scalp quick moves if your capital allows. 💰
---
📡 Why This Heist Has Potential
BTC/USDT is in a neutral trend with strong bullish prospects, driven by:
- Technicals: A breakout above the 108000 MA, backed by higher lows on the 1D chart, signals robust momentum. 📊
- Fundamentals: Institutional buying and positive crypto sentiment (check COT reports) fuel upside potential. 📰
- Seasonal Trends: Bitcoin often rallies in Q2, aligning with our setup. 📅
- Intermarket Factors: USD weakness and altcoin strength could lift BTC higher. 🌎
---
⚠️ Risk Management: Secure Your Gains
- News Caution: Skip new trades during major news events (e.g., CPI, FOMC) to avoid volatility spikes. 🗞️
- Trailing Stops: Use trailing Stop Loss to lock in profits as price nears 122000. 🔒
- Position Sizing: Limit risk to 1-2% of your account per trade for a safe heist. 🚨
---
💥 Power Up the Heist! 💥
Join our Thief Trading Style crew by liking, commenting, and following for more high-energy trade plans! 🚀 Your support strengthens our market raids, helping us profit with precision. Let’s conquer BTC/USDT together! 🤝🏆🎉
Stay Sharp: Another heist plan is on the horizon. Keep your charts locked and loaded, traders! 🐱👤😎
#BTCUSDT #Bitcoin #Crypto #Bullish #SwingTrading #Breakout

$BTC, Bitcoin update: what is going on?🚨 Bitcoin Update: We've just seen a decent correction on CRYPTOCAP:BTC followed by a strong pump.
I’ve warned about this already — this pump is not organic. It's largely driven by institutions and Michael Saylor, using leverage.
📉 A healthy price movement should look like a staircase: move up, consolidate, reset the daily MACD, then push higher again.
Each rally should be followed by a slight pullback — that’s how sustainable trends are built.
❌ But this natural cycle is being disrupted.
Saylor and ETFs keep buying the top to prevent corrections. Some laugh and call it incompetence, but I believe it’s strategic.
These players don’t care about making money on trades.
Their goal is to inflate the value of their companies (or stock value), which are now heavily tied to Bitcoin’s price.
That’s why they don’t want BTC to consolidate.
Every time there's weakness, they step in to buy, preventing any pullback and forcing the price through resistances and fair value gaps.
🤖 The problem? Bots — which represent +80%+ of the trading volume — are not wired this way.
They sell when BTC is overbought and buy when it's oversold.
But with institutions disrupting this cycle, exchanges end up selling BTC, and whales scoop it up — leading to lower supply on exchanges.
Exchanges then have to buy BTC back at higher prices, sometimes even at a loss — often by printing billions in Tether (USDT) to compensate.
🎈 This entire mechanism is inflating Bitcoin’s price, exactly what Bitcoin maximalists want.
But it also kills the chance for an altseason, which usually comes after Bitcoin tops out.
📊 So what’s next?
Ideally, we get a consolidation to around $91K to avoid a major bearish divergence.
If BTC breaks below $90K, we could see GETTEX:82K — but given current conditions, that’s unlikely.
On the chart, RSI is high on daioly, Williams indicator is turning bearish and MACD too. These are all signs of a most needed consolidation. But as I explained, this is cancelled at the moment.
💰 Can institutions push BTC to a new all-time high?
Yes — they basically have unlimited capital and the money printer will turn back on by September.
But once again, altseason is postponed.
#Bitcoin #BTC #CryptoMarkets #MichaelSaylor #ETF #BTCAnalysis #Altseason #CryptoPump #MarketManipulation #BTCUpdate #Tether #CryptoWhales #DailyMACD #TechnicalAnalysis #CryptoInsights #Web3

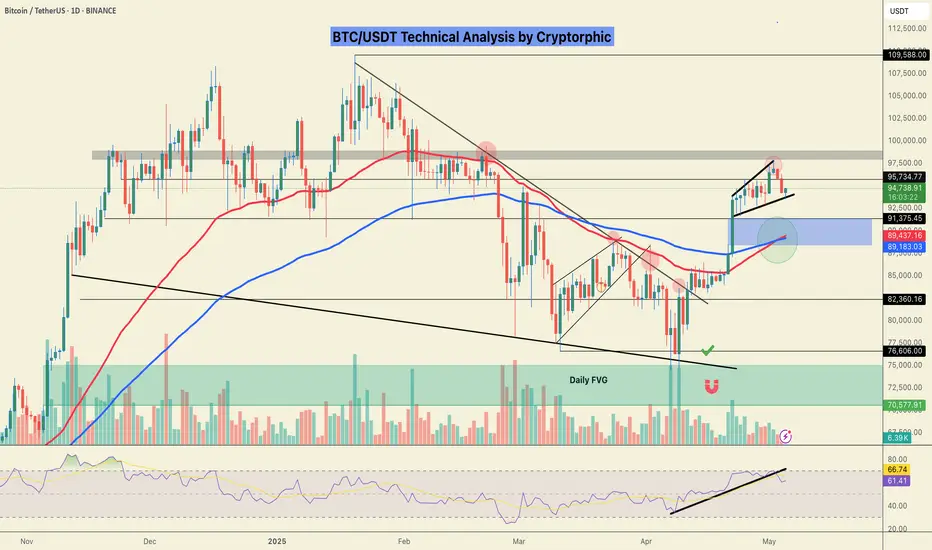
Very clear breakdown and retest !!BTC broke down the trendline and retested. I expect a downward PA, possibly up to 93kish.

BTC/USDT Weekly Analysis – Bullish Momentum ContinuesBitcoin continues to trade within a well-defined ascending green channel that started in early 2023. After a healthy consolidation near the midline of the channel, the price broke out of a wedge pattern, confirming renewed bullish momentum.
As long as BTC remains inside this channel and above key support levels, the trend remains bullish. Based on Fibonacci extension levels, the upcoming targets are:
$130,000 (1.618 extension)
$171,000 (2.618 extension)
$226,000 (3.618 extension)
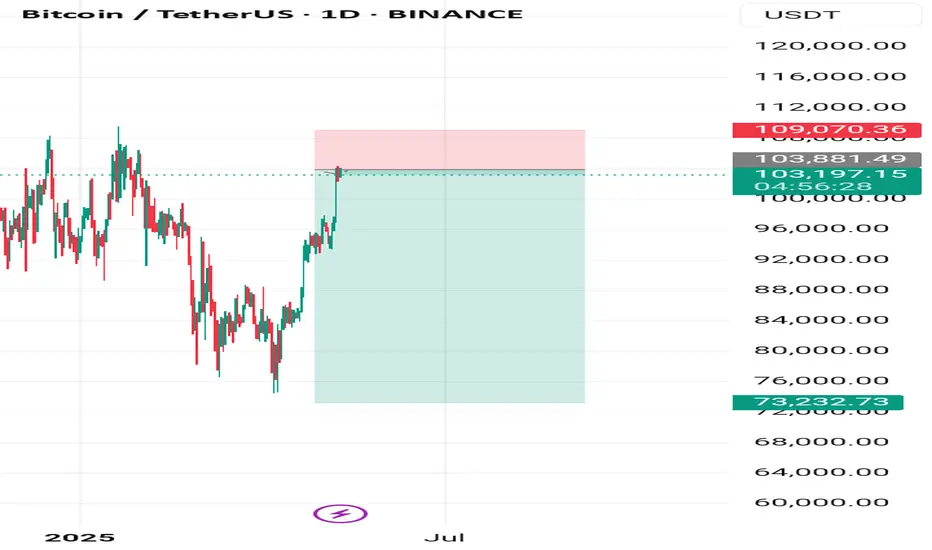
If Bitcoin breaks above the previous all-time high of $109,588, we could see a strong rally toward the $130K–$170K zone by Fall 2025.
Bearish scenario: A confirmed breakdown below the midline and $95K support could lead to a deeper correction.

Attention BTCUSDT may fall in next week!If BTCUSDT fails to break the 101,300 resistance, it could fall to 71,200 next week

Will Bitcoin Break This Resistance – Or Is It a Bull Trap?MARKETSCOM:BITCOIN is once again at a critical resistance level, and the crypto world is split.
Some believe we’re gearing up for a new all-time high (ATH), while others argue the top is already in—and this could be a classic bull trap in disguise.
The key lies in how price reacts to this zone.
• A breakout above $109K would confirm a new ATH and likely spark another leg up.
• But a strong rejection here might signal that the rally was a trap, echoing patterns we’ve seen in past cycles.
My Take: We’re at a make-or-break moment. Confirmation from this level will decide the next big move.
What’s your take—breakout or bull trap?
Please support this idea with a LIKE👍 if you find it useful🥳
Happy Trading💰🥳🤗

Bitcoin short from 103kBitcoin is close to breaking 100k barrier.
Once it does the next stop will be 103k. Trying to catch a short from that region where the target remains at around 95.2k .

DeGRAM | BTCUSD is continuing to rise📊 Technical Analysis
● Breakout above a multi-month triangle cleared the $95–98K zone. The price approached the long-term resistance line, steering price toward $108K.
💡 Fundamental Analysis
● Strategy bought 1,895 BTC and Semler Scientific added 167 BTC, marking a surge in corporate buying.
● Arizona passed legislation to invest up to 10% of $31.5B state assets in Bitcoin.
● New Hampshire governor signs crypto reserve bill into law.
● Metaplanet reaches 5,555 Bitcoin milestone with latest 555 BTC buy.
✨ Summary
Bullish breakout confirmed. Key levels: ~ GETTEX:92K support, ~$93–95K resistance, and $108K target. Strong institutional/state buying underpins the uptrend.
-------------------
Share your opinion in the comments and support the idea with a like. Thanks for your support!

Do you think I'm joking ???I might be wrong and this might never happen, but it might come true From a technical perspective!!!
REMEMBER
Give me some energy !!
✨We spend hours finding potential opportunities and writing useful ideas, we would be happy if you support us.
Best regards CobraVanguard.💚
_ _ _ _ __ _ _ _ _ _ _ _ _ _ _ _ _ _ _ _ _ _ _ _ _ _ _ _ _ _ _ _
✅Thank you, and for more ideas, hit ❤️Like❤️ and 🌟Follow🌟!
⚠️Things can change...
The markets are always changing and even with all these signals, the market changes tend to be strong and fast!!

Analysis of the Latest SignalsThe advancement of the Bitcoin Reserve Bill in many US states, such as Arizona's plan to allocate 10% of state assets to BTC, combined with the discussion on the regulatory framework at the White House Crypto Summit, may make policy clarity a catalyst for future market conditions. The market is watching this week's FOMC decision. If the rate - cut expectation heats up, it may promote the recovery of Bitcoin liquidity.
you are currently struggling with losses, or are unsure which of the numerous trading strategies to follow, at this moment, you can choose to observe the operations within our channel.
Trading Strategy:
buy@93500-94000
TP:95500-96000

Bitcoin takes a breatherGreetings and respect,
It appears that Bitcoin is entering a correction phase and may experience a decline in value towards the predetermined levels. Following this movement, careful monitoring of price action could present an opportunity to buy, aiming for a target of 113K.

BTCUSD SELL SETUP Here is the sell setup in btc logic h4 crt and mss on m15 entry from fvg sl on previous high

BITCOIN WILL GOING UPBTC bullish strong 📈💪
Candle break weakly Target 156k 🚨🚨🚨
target quarter 4 last year

Bitcoin short term Selling Opportunity Bitcoin could reverse from 103k to 109k level. Possible target could be 75k in 3-4 months . Those who do pyramiding after confirmation be get benefit of rally .109k is strong supply zone where seller will get aggresive and pull Price Down.
Disclaimer - Educational Purpose only
Bitcoin - Repeating History: 100k Next Target?Bitcoin is continuing to move with clean structure, driven by demand imbalances and breakout continuation setups. After the initial breakout from the mid-April range, price moved in a highly technical fashion, consolidating, breaking out, forming a fair value gap, and then retesting it before continuation. That exact structure looks like it's playing out again. Bitcoin just broke out of another multi-day consolidation and left behind a fresh 4h imbalance, suggesting the potential for another leg higher if it respects that zone on a pullback.
Consolidation Structure
The prior breakout came from a tight range just below $86,000. BTC spent several days compressing in that area, then broke out impulsively, creating a 4h FVG and retesting it cleanly. That retest held perfectly and launched a rally of nearly $10,000.
The current setup is structurally the same. BTC spent 8 days consolidating under $95,000, repeatedly testing the resistance without breaking it. It finally closed decisively above, leaving behind another fair value gap. The sequence is familiar, sideways accumulation, breakout, FVG left behind, and now a setup for retest.
Bullish/Bearish Scenarios
The bullish scenario is centered on a retest of the new 4h FVG, located between roughly $94,200 and $95,000. If price pulls back into that imbalance and buyers defend it, the setup for continuation is clean. Based on recent behavior, a successful retest here could easily carry BTC toward the $100,000 level.
If price instead breaks back below $94,000 and falls into the previous consolidation range, that invalidates the breakout structure. In that case, Bitcoin could either enter another range-bound phase or trap longs with a deviation. That would shift the focus to reassessing structure instead of chasing continuation.
Price Target and Expectations
The short-term upside target is $100,000. That level is both a psychological milestone and a likely liquidity magnet. From a structural perspective, it aligns with the last breakout leg, which moved over $9,000 after a similar retest setup. If buyers defend the FVG, there is not much in the way until $100,000.
The momentum behind the breakout supports that expectation. The move was impulsive, clear, and not showing signs of exhaustion. As long as structure holds, price is in a strong position to continue toward that key round number level.
Current Stance
This setup is not a breakout chase, it’s a retest setup. The breakout already happened, and the market left behind a fair value gap that now needs to be tested. If price pulls into the $94K to $95K zone and reacts strongly, that would confirm demand. That’s the moment to step in, with invalidation placed below the FVG and former resistance.
Until then, it's about staying patient and letting price come to the key level. The structure is clear, the plan is defined, and there’s no need to force a trade in the middle of the range.
Conclusion
Bitcoin looks like it’s repeating the exact same structure we saw earlier this month. Range, breakout, FVG, retest, that sequence played out before and led to a major leg higher. It’s playing out again now with nearly identical timing and behavior.
If the 4h imbalance holds, the next phase of this rally likely targets $100,000. The structure is clean, the behavior is technical, and there’s no reason to overcomplicate it. Let price do its thing, wait for the retest, and if the reaction is strong, follow the same playbook that’s already worked once this month.
___________________________________
Thanks for your support!
If you found this idea helpful or learned something new, drop a like 👍 and leave a comment, I’d love to hear your thoughts! 🚀
Make sure to follow me for more price action insights, free indicators, and trading strategies. Let’s grow and trade smarter together! 📈

Chart is speaking itself...For months, I've been saying Bitcoin is bullish, and few believed it. I hope you made good profits. Get ready, Bitcoin will hit $300K soon.
PREVIOUS ANALYSIS
Stay Awesome , CobraVanguard
