BTC, Do you recognize any similarities or differences?the purple trend line is one of the powerful vibrational trend , been a mighty resistance for the past year
So, Do you recognize the similarities
double top .....then
Break .....then
Retest
and Do you recognize any differences ???
yea I can see only one
the retest this time is a kind of Hard retest
what that means .....
it means if the price managed to break this awful trend ....
we gonna see
120 K
144 K
very easily
follow for more tips
and let's Boost this one 😉
BTCUPUSDT trade ideas

Will Bitcoin Break This Resistance ?BITCOIN is once again at a critical resistance level, and the crypto world is split.
Some believe we’re gearing up for a new all-time high (ATH), while others argue the top is already in—and this could be a classic bull trap in disguise.
The key lies in how price reacts to this zone.
• A breakout above $109K would confirm a new ATH and likely spark another leg up.
• But a strong rejection here might signal that the rally was a trap, echoing patterns we’ve seen in past cycles.
My Take: We’re at a make-or-break moment. Confirmation from this level will decide the next big move.
What’s your take—breakout or bull trap?

Hanzo : BTC 15m: Bullish Confirmed After Liquidity Trap DoneBias: Bullish
Time Frame: 15 Min
Entry Type: Post-Liquidity Grab Confirmation
Key Reasons for Entry:
Liquidity sweep below local support triggered retail stop-losses (classic trap).
Strong bullish reaction from a refined demand zone.
Entry based on Smart Money Concepts: Break of structure + order block confirmation.
Confluence with higher time frame support or key level.
Bullish engulfing / displacement candle shows clear intent.
Market in premium-to-discount transition zone.
Target: Next 15M supply zone or recent structural high
Risk-to-Reward: Minimum 1:3
Status: Waiting for confirmation / Entry triggered

BITCOIN BUY LIMIT Hello friends
If you are a risk taker, this position is for you...
Given the price growth, we expect a correction, so in the pullback we have identified important points to buy with capital and risk management and move towards the specified goals.
*Trade safely with us*

TradeCityPro | Bitcoin Daily Analysis #82👋 Welcome to TradeCity Pro!
Let’s dive into the analysis of Bitcoin and key crypto indicators. As usual, I’ll walk you through the futures triggers for the New York session.
⏳ 1-Hour Timeframe
As you can see, yesterday the price stabilized below 95370 and completed a downward leg to 93626, reacting exactly to the level I pointed out in the previous analysis.
✔️ I mentioned earlier that you could enter a short position after breaking 95370 — but remember, this position is against the higher timeframe trend, so the downward move will likely end once it hits the first support, since the market momentum remains bullish on larger timeframes.
💥 Currently, the price has reacted to 93626 and seems to be resting from the previous downward move. I believe a new range box may form between 95370 and 93626 — if that happens, I’ll go long on a break above 95370.
🔽 For short positions, given the bearish momentum in this timeframe, we can look to re-enter on a break below 93626 in the next retest.
📊 Watch volume and RSI today. The volume of red candles has been much higher than bullish ones, which increases the chance of a deeper correction. If you’re shorting, keep a tight stop-loss, take profits quickly, and treat it as a scalp trade.
📈 For long positions, since it’s against the short-term trend, you’ll need a wider stop — but if the correction ends and a new bullish leg begins, the trade may stay open longer.
🧩 As for RSI: as long as it stays below 50, market momentum is bearish. A break below 30 and entry into oversold increases the likelihood of more downside.
👑 BTC.D Analysis
Bitcoin dominance broke 64.77 yesterday and retraced to 64.60. If this downward move continues, we could see early signs of a trend shift.
✨ Important note: dominance has been in an uptrend on higher timeframes, so a break of 64.60 only confirms a short-term correction. Don’t take it as a trend reversal just yet.
💫 If dominance continues to drop and the market rises, altcoins could outperform Bitcoin. Conversely, if dominance rises again, Bitcoin will rally more than altcoins.
📅 Total2 Analysis
Total2 broke below 1.03 yesterday, retested it, and now looks set to continue downward. The next support is at 1.00 — if you’re already short, consider taking profits at that level.
☘️ We’ll get full trend reversal confirmation with a break below 1.00. For long positions, the 1.05 breakout is extremely important. I strongly recommend not missing that trigger if it happens.
📅 USDT.D Analysis
USDT dominance stabilized above 5.10 yesterday, moving further away from 4.99, and is now testing 5.19. A break above 5.19 would be a strong signal that a deeper market correction is starting.
🔑 On the flip side, a break below 4.99 is still the best and most important trigger to confirm the market’s return to a bullish trend.
❌ Disclaimer ❌
Trading futures is highly risky and dangerous. If you're not an expert, these triggers may not be suitable for you. You should first learn risk and capital management. You can also use the educational content from this channel.
Finally, these triggers reflect my personal opinions on price action, and the market may move completely against this analysis. So, do your own research before opening any position.

BTC Overextended: Awaiting the Perfect Pullback for a BuYBTC/USDT Analysis – 1D Timeframe
Bitcoin is currently looking overextended on the daily chart 📈, with price action pushing directly into a well-defined key resistance level 🚧. This area has historically acted as a strong supply zone, and with momentum appearing stretched, I’m anticipating a potential retracement in the near term.
My plan is to wait for BTC to pull back towards previous support zones Around the 61.8 Fibo level🛡️. I have a clear Point of Interest (POI) marked out, where I’ll be watching for price to react. If we see a bullish Break of Structure (BOS) on the pullback—I’ll be looking for a long entry from this area 🎯.
Key Levels to Watch:
Resistance: Current daily highs (where price is overextended) 🚩
Support/POI: Previous consolidation and demand zones below, which have shown strong buying interest in the past 🏦
Trade Plan:
- No FOMO entries at resistance! ❌
- Wait for a clean retrace into my POI
- Look for bullish confirmation (BOS) on lower timeframes before entering long ✅
- Manage risk accordingly and trail stops if the move plays out
Summary:
Patience is key here. I’m not interested in chasing price into resistance. Instead, I’ll let the market come to me and only act if my criteria are met. If BTC gives us the pullback and a bullish BoS, I’ll be ready to take the trade. Until then, I’m on the sidelines and monitoring price action closely 👀.
Disclaimer:
This analysis is for educational purposes only and does not constitute financial advice. Always do your own research and manage your risk appropriately. Trading cryptocurrencies involves significant risk and may not be suitable for all investors. 🚨

BTC at Crucial Retest Zone — Bearish Setup in Play!Price Action Alert on #BTC/USDT (4H Timeframe)
#Bitcoin recently broke down from a rising wedge, a classically bearish pattern. Alongside this, we've also identified a bearish RSI divergence, further validating potential downside momentum.
Key Observations:
🔺 Rising wedge breakdown confirmed
📉 Bearish divergence on RSI (4H)
🔁 Price is now retesting the broken wedge from below (a classic bear signal!)
⛔️ Still holding above a key horizontal support — watching for a clean break here for confirmation
📌 Bearish Trade Setup (Waiting for Confirmation):
Entry: Below key support zone (marked on chart)
Target 1: $84,300
Target 2: $75,000
Stop-loss: Above wedge breakout point (100,500)
💼 Always follow proper risk management!
🧠 Why This Matters:
The combination of pattern breakdown, bearish divergence, and a retest zone is a powerful signal — but patience is key. We wait for full confirmation (support break) before executing any short trade.
📣 What do you think — will #BTC break the support or bounce back? Drop your thoughts in the comments! 🗣️
If you found this analysis helpful, like, comment, and follow for more real-time setups! 🚀
#BTC #Bitcoin #CryptoAnalysis #PriceAction #Bearish #ShortSetup #RisingWedge #TechnicalAnalysis #CryptoTrading #TradingView

Mastering chart patterns - How to use them in trading!Chart patterns are visual formations created by the price movements of a financial asset—like a stock, currency, or cryptocurrency, on a price chart. Traders use these patterns in technical analysis to predict future market direction based on historical behavior. The main chart patterns are the reversal and continuation patterns.
-------------------------------
What will we discuss?
- Bullish reversal patterns
- Bearish reversal patterns
- Bullish continuation patterns
- Bearish continuation patterns
-------------------------------
Bullish reversal patterns:
Double bottom
A double bottom in trading is a bullish reversal pattern that signals the potential end of a downtrend and the beginning of an uptrend. It forms when the price of an asset falls to a low, bounces back up, then drops again to roughly the same low before rising once more. This creates a "W" shape on the chart.
How to trade it:
Before entering a trade, wait for the price to break back above the neckline with strong volume, as this indicates a potential bullish reversal. Once the breakout is confirmed, look for an entry on the pullback to the neckline.
Inverted head and shoulders
An inverted head and shoulders is a bullish reversal pattern that typically forms after a downtrend and signals a possible shift to an uptrend.
It consists of three parts:
* The left shoulder, where the price makes a low and then bounces.
* The head, which is a deeper low followed by another bounce.
* The right shoulder, a higher low similar in level to the left shoulder.
How to trade it:
Before entering a trade, wait for the price to break above the neckline with strong volume, as this confirms the pattern and signals a potential upward move. After the breakout, it's important to wait for a retest of the neckline to look for an entry. Traders typically place a stop-loss just below the right shoulder to manage risk.
Falling wedge
A falling wedge is a bullish chart pattern that often signals a potential reversal or continuation of an uptrend, depending on where it forms in a price trend.
It appears when the price is moving lower but within a narrowing range, creating two downward-sloping, converging trendlines. Both the highs and lows are falling, but the lower highs are coming down faster than the lower lows, which shows that selling pressure is losing strength over time.
How to trade it:
Wait for the falling wedge to break above the downward trendline and for the price to reclaim the most recent lower high. A breakout alone isn’t always reliable, sometimes the price moves briefly above the trendline without making a higher high, resulting in a fake-out. To confirm the move, wait for a clear higher high and then look to enter on the retracement that follows.
-------------------------------
Bearish reversal patterns
Double top
A double top is a bearish reversal pattern that signals a potential shift from an uptrend to a downtrend.
It forms when the price reaches a high, pulls back, then rallies again to the same or similar high but fails to break above it. This creates an "M" shape on the chart. The neckline is the support level at the low point between the two peaks. When the price breaks below this neckline with strong volume, it confirms the pattern and suggests that selling pressure is taking over.
How to trade it:
Before entering a trade, wait for the price to break below the neckline with strong volume, as this indicates a potential bearish reversal. Once the breakout is confirmed, look for an entry on the pullback to the neckline.
Head and shoulders
A head and shoulders is a bearish reversal pattern that typically forms after an uptrend and signals a potential shift to a downtrend.
It consists of three peaks:
* The left shoulder, where the price rises and then falls.
* The head, which is a higher peak followed by another decline.
* The right shoulder, a lower high that is roughly equal in height to the left shoulder.
How to trade it:
Before entering a trade, wait for the price to break below the neckline with strong volume, as this confirms the pattern and signals a potential downside move, After the breakout, it’s important to wait for a retest of the neckline to look for an entry. Traders typically place a stop-loss just above the right shoulder to manage risk
Rising wedge
A rising wedge is a bearish chart pattern that often signals a potential reversal or continuation of an downtrend, depending on where it forms in a price trend.
It appears when the price is moving higher but within a narrowing range, creating two upward-sloping, converging trendlines. Both the highs and lows are rising, but the highs are increasing at a faster rate than the lows. This suggests that buying pressure is weakening over time, and the market may be preparing for a downturn.
How to trade it:
Wait for the rising wedge to break below the upsloping trendline and for the price to reclaim the most recent high low. A breakout alone isn’t always reliable, sometimes the price moves briefly below the trendline without making a lower low, resulting in a fake-out. To confirm the move, wait for a clear lower low and then look to enter on the retracement that follows.
-------------------------------
Bullish continuation patterns
Bullflag
A bull flag is a continuation pattern that signals the potential for a price to continue moving upward after a brief consolidation or pullback.
It forms when the price experiences a strong upward move (the flagpole), followed by a period of consolidation or a slight downward movement (the flag). The flag typically slopes downward or moves sideways, and the consolidation phase usually occurs within two parallel trendlines, creating a rectangle or slight downward channel.
How to trade it?
Before entering a position, wait for the price to break above the downsloping trendline and establish a higher high. If the price doesn’t make a higher high, it could be a fake-out. Once a higher high is confirmed, look for an entry on the retracement. The target is typically the length of the flagpole projected upward from the breakout point.
Bullish pennant
A bullish pennant is a continuation pattern that indicates the potential for a price to continue its upward trend after a brief consolidation. It forms when a strong upward move (the flagpole) is followed by a period of consolidation, where the price moves within converging trendlines, creating a small symmetrical triangle or pennant shape. The consolidation typically shows lower highs and higher lows, and the pattern suggests that the market is taking a "breather" before continuing its upward momentum.
How to trade it?
Before entering a position, wait for the price to break above the downsloping trendline and establish a higher high. If the price doesn’t make a higher high, it could be a fake-out. Once a higher high is confirmed, look for an entry on the retracement. The target is typically the length of the flagpole projected upward form the breakout point.
Ascending triangle
An ascending triangle is a bullish continuation pattern that typically forms during an uptrend, signaling that the price is likely to continue moving higher.
It is characterized by a horizontal resistance line at the top, formed by a series of peaks at roughly the same price level, and an ascending support line at the bottom, formed by higher lows. This creates a triangle shape, where the price is gradually compressing between the horizontal resistance and the rising support.
How to trade it?
Before entering a position, wait for the price to break above the horizontal resistance level with strong volume. Once the breakout occurs, look for an entry on the retracement back to this area.
-------------------------------
Bearish continuation patterns
Bearflag
A bear flag is a bearish continuation pattern that suggests the price is likely to continue moving downward after a brief consolidation or upward pullback.
It forms when there is a strong downward move (the flagpole), followed by a period of consolidation or slight upward movement (the flag). The flag typically slopes upward or moves sideways, and the consolidation occurs within two parallel trendlines, creating a rectangular or upward-sloping channel. This pattern shows that, despite the short-term pullback, the overall downtrend remains intact.
How to trade it?
Before entering a position, wait for the price to break below the upsloping trendline and establish a lower low. If the price doesn’t make a lower low, it could be a fake-out. Once a lower low is confirmed, look for an entry on the retracement. The target is typically the length of the flagpole projected downward for the breakout point.
Bearish pennant
A bearish pennant is a bearish continuation pattern that signals a potential continuation of a downtrend after a brief consolidation.
It forms when there is a strong downward move (the flagpole), followed by a period of consolidation where the price moves within converging trendlines, creating a small symmetrical triangle or pennant shape. The consolidation typically shows lower highs and higher lows, indicating that the price is taking a pause before continuing its downward movement.
How to trade it?
Before entering a position, wait for the price to break below the upsloping trendline and establish a lower low. If the price doesn’t make a lower low, it could be a fake-out. Once a lower low is confirmed, look for an entry on the retracement. The target is typically the length of the flagpole projected downward for the breakout point.
Descending triangle
A descending triangle is a bearish continuation pattern that typically forms during a downtrend, indicating that the price is likely to continue moving lower after a period of consolidation.
The pattern is characterized by a horizontal support line at the bottom, formed by a series of lows at approximately the same price level, and a descending resistance line at the top, formed by a series of lower highs. The price contracts between these two trendlines, creating a triangle shape with a downward-sloping upper boundary and a flat lower boundary.
How to trade it?
Before entering a position, wait for the price to break below the horizontal support level with strong volume. Once the breakout occurs, look for an entry on the retracement back to this area.
-------------------------------
Thanks for your support.
- Make sure to follow me so you don't miss out on the next analysis!
- Drop a like and leave a comment!

Whether it can be supported and rise at 102429.56 is the key
Hello, traders.
If you "Follow", you can always get new information quickly.
Please also click "Boost".
Have a nice day today.
-------------------------------------
(USDT.D 1M chart)
If USDT dominance is maintained below 4.97 or continues to decline, the coin market is likely to enter an upward trend.
(BTC.D 1M chart)
However, I think that for the altcoin bull market to begin, BTC dominance must be maintained below 55.01 or continue to decline.
If USDT dominance falls and BTC dominance rises, most altcoins are likely to gradually move sideways or show a downward trend.
In other words, it is highly likely that only BTC will continue to rise.
-----------------------------------------
(BTCUSDT 1M chart)
Based on the current position, in order to continue the uptrend, the price must be maintained above the Fibonacci ratio of 1.902 (101784.54).
If not, it is likely to fall to around the Fibonacci ratio of 1.618 (89050.0).
If the uptrend continues, the point to watch is whether it can renew the new high (ATH) this time.
-
(1W chart)
It is rising after touching the 73499.86 area.
It is showing a large increase as it breaks through the HA-High indicator point of 97226.92 on the 1W chart.
Since the StochRSI indicator is expected to enter the overbought zone, it is highly likely that the future rise will be limited.
Therefore, the key is whether the price can be maintained above the left Fibonacci ratio of 1.902 (101784.54).
If it falls, you should check whether it is supported near 97226.92.
If it falls below 97226.92, you should check whether it is supported in the 1st and 2nd sections marked on the chart.
You should check where the StochRSI 80 indicator is formed when the next candle is created.
The StochRSI 80 indicator on the 1M chart is formed at the 102429.56 point.
Therefore, we need to check whether the StochRSI 80 indicator point on the 1W chart is formed around the 102429.56 point.
-
(1D chart)
Since the StochRSI indicator on the 1D chart is located below the midpoint, we need to focus on finding a buying point.
With this rise, the StochRSI indicator is expected to rise above the midpoint.
If the StochRSI indicator is located above the midpoint, we need to focus on finding a selling point.
Therefore, the point of interest is whether the price can be maintained around the right Fibonacci ratio 1.902 (101784.54) as we pass through the next volatility period around May 19.
-
Among the interpretation methods of the OBV indicator, there is an interpretation method that there is a possibility of an increase or decrease when the previous high or low is broken.
This time, it showed an upward break through the upper line of the OBV and broke through the lower line of the previous OBV.
In other words, it showed an upward break through the A section.
If this upward break through the B section is continued, it is expected to renew the ATH.
-
Thank you for reading to the end.
I hope you have a successful transaction.
--------------------------------------------------
- This is an explanation of the big picture.
I used TradingView's INDEX chart to check the entire section of BTC.
I rewrote the previous chart to update it by touching the Fibonacci ratio section of 1.902 (101875.70) ~ 2 (106275.10).
(Previous BTCUSD 12M chart)
Looking at the big picture, it seems to have been following a pattern since 2015.
In other words, it is a pattern that maintains a 3-year bull market and faces a 1-year bear market.
Accordingly, the bull market is expected to continue until 2025.
-
(Current BTCUSD 12M chart)
Based on the currently written Fibonacci ratio, it is displayed up to 3.618 (178910.15).
It is expected that it will not fall again below the Fibonacci ratio of 0.618 (44234.54).
(BTCUSDT 12M chart)
I think it is around 42283.58 when looking at the BTCUSDT chart.
-
I will explain it again with the BTCUSD chart.
The Fibonacci ratio ranges marked in the light green boxes, 1.902 (101875.70) ~ 2 (106275.10) and 3 (151166.97) ~ 3.14 (157451.83), are expected to be important support and resistance ranges.
In other words, it seems likely to act as a volume profile range.
Therefore, in order to break through this section upward, I think the point to watch is whether it can rise with support near the Fibonacci ratios of 1.618 (89126.41) and 2.618 (134018.28).
Therefore, the maximum rising section in 2025 is expected to be the 3 (151166.97) ~ 3.14 (157451.83) section.
To do that, we need to look at whether it can rise with support near 2.618 (134018.28).
If it falls after the bull market in 2025, we don't know how far it will fall, but considering the previous decline, we expect it to fall by about -60% to -70%.
So, if the decline starts near the Fibonacci ratio 3.14 (157451.83), it seems likely that it will fall to around Fibonacci 0.618 (44234.54).
I will explain more details when the downtrend starts.
------------------------------------------------------

BTC Trade Plan 11/05/2025Dear Traders,
It seems that the fifth bullish wave of Bitcoin is forming, and the previous high will soon be broken. Since wave 5 is the final wave of a bullish cycle, I expect a sharp reversal to the downside from any price level. The targets for wave 5 are between 114 and 130.
If you enjoyed this forecast, please show your support with a like and comment. Your feedback is what drives me to keep creating valuable content."
Regards,
Alireza

Bitcoin - time to take SL of Buyers adn SellersBitcoin - time to take SL of Buyers adn Sellers
Price reached key resistance POC of a range - i expect a pullback
key zone for long is VWAP + VAH

TradeCityPro | Bitcoin Daily Analysis #81👋 Welcome to TradeCity Pro!
Let’s get into the analysis of Bitcoin and the key crypto indices. As usual, I’ll review the futures triggers for the New York session.
⏳ 1-Hour Timeframe
As you can see, Bitcoin has continued its correction down to the 95370 level and is currently testing this zone.
✔️ If the price breaks below this level and moves further down, we will start to see signs of a trend reversal. However, for short positions, I personally prefer to wait for a confirmed trend reversal.
📈 For long positions today, if the price pulls back to the 95370 zone, you can consider entering. Confirmation of the pullback can be taken from lower timeframes through candlestick signals or structural breaks.
📊 Market volume increased during the last corrective leg, which could raise the probability of a break below 95370.
👑 BTC.D Analysis
Moving on to Bitcoin dominance — the range between 64.77 and 64.91 still holds, with price fluctuating within.
⚡️ A breakout above 64.91 would confirm the continuation of the uptrend. A break below 64.77 could suggest a deeper correction.
📅 Total2 Analysis
Looking at Total2, the 1.03 support has broken and price is now moving downward. If this trend continues, it could drop to lower support levels.
⭐ However, if the break below 1.03 turns out to be a fakeout, price could rebound and head back toward 1.05.
📅 USDT.D Analysis
Finally, USDT dominance has closed above 5.10 today and may be starting its bullish leg.
💥 If this upward move continues, the market could experience a broader sell-off. Should Bitcoin triggers activate, this would be a good context to consider short positions.
❌ Disclaimer ❌
Trading futures is highly risky and dangerous. If you're not an expert, these triggers may not be suitable for you. You should first learn risk and capital management. You can also use the educational content from this channel.
Finally, these triggers reflect my personal opinions on price action, and the market may move completely against this analysis. So, do your own research before opening any position.

BTC NEW UPDATE (4H)This analysis is an update of the analysis you see in the "Related publications" section
Bitcoin has not yet reached our zone, but it has formed a correction of the same degree as the previous ones and has also created a support area. The diametric pattern could potentially shift into a symmetrical one, and Bitcoin may even reach the 100K–105K zone.
We should keep a close eye on the 100K level for now, as it also serves as a psychological resistance.
For risk management, please don't forget stop loss and capital management
Comment if you have any questions
Thank You

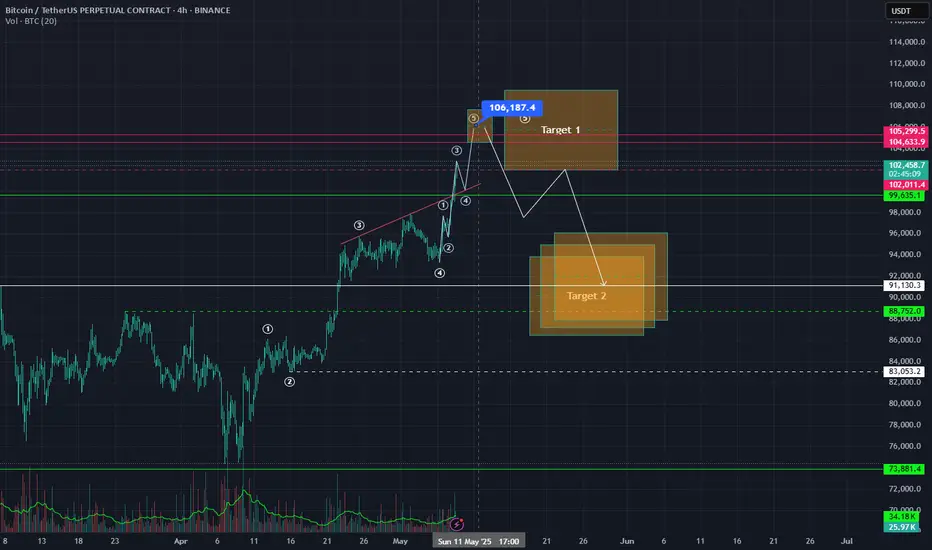
Bitcoin on the road to $105k and beyond...So Bitcoin has finally flipped from bearish in April to bullish in May 25.
As per Elliott Wave theory, it has been printing a clear Wave 1 from the bottom below (aprox. @$74.500).
At the time of this post, btc is @ the impressive price of $102.289.
I has clearly made a subwave 1, 2, 3, 4 and its on its way of finishing up subwave 5.
Thing is... this looks as a non stop movement for the time being.
That´s how BULLISH everyone hast turned.
My projection is that the whole swing should finally end somewhere between $104.600 - $105.300 (even if it could push a bit higher, such as $106.200 or so). Yes, it could go even further and then $107k, 109 and 110 would be open. But it seems fare reaching.
I rather stick to the former:
Wave 1 would end at around $104.600 - $105.300, and Wave 2 correction could take us somewhere between $93.500 and $88.750 (give or take).
It´s game! Let´s see how this finally plays out...
Bias: BULLISH
Is $BTCUSDT going to 91k ??This BINANCE:BTCUSDT chart reveals that Bitcoin has been trading within a clear ascending channel. This pattern typically suggests bullish momentum, with price making higher highs and higher lows. However, the most recent price action shows a decisive break down below the lower trendline of this channel. This breakdown suggests a potential shift in the short-term bias from bullish to bearish.
The setup strongly suggests a short trading opportunity. The breakdown from the ascending channel, coupled with the potential supply zone above, provides a bearish setup.
Entry: A potential entry point would be a retest of the broken lower trendline of the channel or within the highlighted red supply zone.
Target 1: The immediate target is the horizontal purple support level around 96,000.
Target 2: If the 96,000 support breaks, the next target would be the stronger horizontal yellow support level around 91,000.
Kindly support this analysis to enable it reach to other people, and do comment your thoughts.

BTC Local Top in? $92000 in the next few days....After retracing more than 78.6% from the 74k low, a BTC local top appears to be in. Expecting prices to fall to the local support of GETTEX:92K initially...

#BTC reaches the red target zone📊#BTC reaches the red target zone✔️
🧠From a structural perspective, the goals of the long structure we built in the blue resistance zone have been fully achieved, so we need to be vigilant against the occurrence of a pullback, and do not chase the rise in the sell zone! We should look for short opportunities in the sell zone.
➡️The concerns in the previous post still exist, because this week is not over yet, we need to observe whether the closing price of the weekly candlestick chart can stabilize above the blue resistance zone. Only when it stabilizes above the resistance zone, the blue resistance zone will turn into a support zone. Then look for long trading opportunities in the support zone.
⚠️Note that if we set a new record high, we also need to wait patiently for a pullback to appear before participating in a new long trade.
🤜If you like my analysis, please like 💖 and share 💬 BITGET:BTCUSDT.P

Bitcoin and its RALLYBTC lately has gain 37% back of this value after the crash to 74k, what a great swing coming back to 102k, no one beleiving.
Im starting a short position around this level into 90k

Bitcoin (BTC): Aiming For ATH | Waiting Patiently Before EntryBitcoin had a small sign of weakness yesterday, where on smaller timeframes we formed a nice MSB and now we are retesting the broken zone. This would be an ideal shorting position BUT we are seeing the optimism on markets and we still aim for that ATH zone to be tested before seeing any kind of proper downward movement.
So we wait!
Swallow Academy

Bitcoin - now or never, sell in May go away! (crash soon)As long as Bitcoin is below the 0.618 FIB retracement and below the POC on the volume profile, Bitcoin is in a bear market, and we have a great opportunity to sell not only Bitcoin but also altcoins in general. Have you ever heard of the sentence - "Sell in May, go away?" That's exactly what you should do on Bitcoin if we take historical data into consideration. May is still a pretty good month for Bitcoin, but not in the case of bear markets. What we can see in the picture is that Bitcoin is extremely weak during the summer and very bearish in September! So you want to sell in May and buy in October.
From a technical point of view, the current price of Bitcoin is below the 0.618 FIB retracement of the previous February/March drop. A very strong resistance is ahead, so selling into this cloud may be very wise. Of course you want to sell at resistance and buy at support, not the opposite way. Right now I expect a drop to 85k also because the current uptrend created a pretty significant FVG, and these types of FVGs tend to be filled quickly.
Write a comment with your altcoin + hit the like button, and I will make an analysis for you in response. Trading is not hard if you have a good coach! It is not a trade setup, as there is no stop-loss or profit target. I share my trades privately. Thank you, and I wish you successful trades!

BTC Breaks 100K: Trend Analysis & Trading AdviceFrom the 4-hour K-line chart of BTC, the bullish power in the market has been overwhelming. There have been six consecutive bullish candles. Not only has it successfully broken through the important defense line of the 100,000 mark, but it has also continued to rise with increasing trading volume after the breakthrough, indicating a strong bullish momentum.
The MACD indicator has been diverging above the zero axis, and the fast and slow lines are extending upward at an angle of 45 degrees. The RSI indicator remains in the overbought area above 70 without showing any obvious signs of turning down, which validates the strong characteristics of the current market trend.
When observed from the 1-hour time frame, the market is also dominated by bulls. The price has been steadily moving above the middle band of the Bollinger Bands. Although there have been pullbacks, each pullback has found effective support at the previous high, forming a standard bullish arrangement of higher highs and higher lows, and continuing to maintain an upward trend.
BTCUSD
buy@100300-100800
tp:101500-102500
Investment itself is not risky; it is only when investment is out of control that risks occur. When trading, always remember not to act on impulse. I will share trading signals every day. All the signals have been accurate without any mistakes for a whole month. No matter what gains or losses you've had in the past, with my help, you have the hope of achieving a breakthrough in your investment.


Downside for bitcoin around the cornerLooking for a retrace to between 96-97.5k
-Hourly closure above red horizontal line = idea invalidated
-Drop will increase in volatility below red box zone marked on chart
Happy trading!
