More upside for BitcoinHi traders,
Last week the price Bitcoin came a little bit lower then expected (updated wavecount).
But after the finish of the correction it went up again for (grey) wave 5.
Now we could see a little more upside to finish this wave and after that we could see a bigger correction.
Let's see what the market does and react.
Trade idea: Wait for a change in orderflow to bullish, an impulse wave up and a small correction down on a lower timeframe to trade (short term) longs.
If you want to learn more about trading FVG's with wave analysis, please make sure to follow me.
This shared post is only my point of view on what could be the next move in this pair based on my analysis.
Don't be emotional, just trade your plan!
Eduwave
BTCUPUSDT trade ideas

BTC to create a low and then a new ATH!BTC may go low around 95k before pushing for a new ATH. This analysis is based on past price action as seen in red lines and previous circles. It confirms to the basic market structure analysis of HH, HL and HH.
However, do note that past price actions do not indicate certainty of future price. DYOR

BTC...any sh&t bag holders? Seeing BTC pump, most likely short sellers getting squeezed, seems like the champgne effect will kick in anytime soon. Short term profit traders do not buy at the top and will sell BTC very quickly and moreso when trading algorithms are involved.
Be super careful with BTC FOMO, when it crashes it goes down hard! Crypto bros will be going back to rice and beans diet very soon.....

Kingbtc3.4hWelcome to kin btc. Bitcoin can be considered to have a multi-day range between 100,800 and 105,000, with a shadow moving up to 106,000 and then experiencing a price decline towards 95,630. However, if the daily candle closes above 106,000, we should expect a move towards 139,500. However, in general, we expect a price decline. This is just a possibility.

Bitcoin Weekend Retracement 3%Weekend is the only time right now to be short, retail in on and insti are off! CRYPTOCAP:BTC big shorts can happen during weekends, once we dont have inflows and retails take loads of shorts positions. hashtag#Bitcoin hashtag#Short

Can BTC reach new high?Notable news about BTC:
A sudden sell-off in cryptocurrency markets late Monday wiped out earlier gains, with over $500 million in long positions liquidated as Bitcoin (BTC) retreated from weekend highs. The downturn followed easing U.S.-China trade tensions, which appeared to shift investor sentiment away from risk assets.
According to Coinglass, more than $530 million in leveraged long positions were liquidated over the past 24 hours. Bitcoin-related futures accounted for nearly $200 million of that total, while Ether (ETH) products saw around $170 million in liquidations.
Liquidations occur when an exchange forcefully closes a trader’s leveraged position due to a drop in collateral value, typically triggered by sharp market moves. This mechanism kicks in when traders can no longer meet the required margin to sustain their open positions.
Technical analysis angle
As analyzed earlier after the price of BTC breaking the 96k landmark has returned to the period over 100k
Currently, the BTC price is still passing in the 105k resistance stage and the important trend of the trend of increasing at 98k
About 98k continues to consume the trend of this currency
With the current news and price lines, it will still be supporting the increase in the trend
==> Comments for trend reference. Wishing investors successfully trading

TradeCityPro | Bitcoin Daily Analysis #80👋 Welcome to TradeCity Pro!
Let’s dive into the Bitcoin analysis and key crypto market indicators. As usual, I’ll review the triggers for the New York futures session.
⏳ 1-Hour Timeframe
Yesterday, price made a bullish move and broke the 97139 zone, but later it turned out to be a fake breakout, and now it’s moving downward.
🔍 It’s likely that this downward move is just a pullback toward the SMA99 zone, and price may bounce back up afterward. If SMA99 breaks, deeper corrections down to 95370 are possible.
✔️ In my view, as long as price stays above the 95370 zone, Bitcoin remains in an uptrend. Only once price drops below this level can we start identifying potential bearish triggers.
📈 For now, we need to wait for more structure to develop before entering any positions. The 97139 level still remains a strong bullish trigger, but it’s best to wait for a reaction to it first so we can pinpoint the exact line, and then enter upon its breakout.
⚡️ Nothing more to add about Bitcoin for now — it’s Saturday, a weekend, and the chances of ranging price action are high.
👑 BTC.D Analysis
Looking at BTC dominance, yesterday it made a slight corrective move and pulled back to 64.77, where it seems to have found support.
📊 The next bullish trigger is the breakout of 64.91. Overall, the trend is still bullish, so if you're considering multi-day or swing positions, Bitcoin remains a better choice than altcoins.
📅 Total2 Analysis
Turning to the Total2 chart, this index was rejected from the 1.05 resistance once again yesterday and failed to hold above it. Until that changes, altcoins likely won’t see any significant upward momentum.
🔑 For downside movement in Total2, the trigger remains a break below 1.03.
📅 USDT.D Analysis
Now to Tether dominance — yesterday, this index finally closed a candle below the 4.99 level, but it was a fakeout, and it moved back above, once again preventing the broader market from turning bullish. This fakeout could inject bearish momentum into the market, potentially leading to deeper corrections.
⭐ For now, the 4.99 level still serves as a strong trigger for a bearish USDT dominance and thus a bullish signal for the market. A break above 5.10, however, would be a solid trigger for USDT dominance to trend higher.
❌ Disclaimer ❌
Trading futures is highly risky and dangerous. If you're not an expert, these triggers may not be suitable for you. You should first learn risk and capital management. You can also use the educational content from this channel.
Finally, these triggers reflect my personal opinions on price action, and the market may move completely against this analysis. So, do your own research before opening any position.

BTCUSDT SHORTHere’s the translation for your analysis:
"The price here is a good level to open a sell position. The future buy and sell levels I've marked are based on the perspective it creates for us, but for now, it's just a viewpoint."
ITS POSSIBLE SCENARIO FOR BTCUSDT.

Bitcoin vs. Saylor: The Power and Danger of fanatical promotionToday I want to talk about Michael Saylor and his influence on many crypto minds and, to some extent, the movement of Bitcoin’s price.
It’s very important to understand who we’re listening to, who we’re following, and whether this person has hidden motives we don’t see due to lack of information or unwillingness to get it — due to our stubborn desire to see only what confirms our own fantasies and thoughts and serves our expectations.
Let’s turn on our reason and objectivity and face the facts.
Michael Saylor is a well-known figure in the crypto world. He promotes the idea of eternal Bitcoin growth and actively buys it to support his words. When the price drops, he even suggests his readers sell their organs, which, to me, is too much.
Let’s move to the facts — everything is Googleable, and promptable.
Facts:
📈 Hype of 2000
In 2000, he rode the dot-com hype with his company MicroStrategy. MicroStrategy was promoted as a pioneer in business analytics and data management software, and he saw himself solely as a visionary of the new economy.
The boom was sky-high — just read about the dot-com era. Stocks of new tech companies were soaring, and it was enough to say “software” and “I see the future.”
In 1998, MicroStrategy successfully held an IPO. In 2000, at the peak of the dot-com boom, the company’s stock reached an incredible $333 per share in March.
He skillfully used the hype, and here was his 2000 narrative:
Digital transformation: Saylor claimed the world was entering a new era where data would become the main asset of companies, and MicroStrategy — the key tool for processing and analyzing it.
Unlimited growth: In the dot-com era, Saylor pushed the idea that tech companies like MicroStrategy would grow exponentially, ignoring traditional financial constraints.
The future is now: Saylor created the feeling that MicroStrategy wasn’t just following trends but shaping them, offering solutions that would define the future of business.
At the same time, he was building a cult around himself, cultivating the image of a genius entrepreneur.
⚠️ Financial reporting scandal
The U.S. Securities and Exchange Commission (SEC) launched an investigation into MicroStrategy. The company overstated revenues, which led to a stock crash (from $333 to $86 in one day) and a loss of investor trust. The stock kept falling and dropped to $0.4 (–100%!).
The SEC filed charges against Michael Saylor personally (CEO), as well as CFO Mark Lynch and the chief accountant. They were accused of intentionally misrepresenting financials to keep stock prices high.
SEC investigation results:
In December 2000, the SEC concluded the investigation, and MicroStrategy agreed to settle without admitting guilt:
* The company paid a $10M fine.
* Saylor, Lynch, and other executives paid personal fines.
* Saylor agreed to pay $8.28M in “disgorgement” (unjust enrichment) and a $350K fine — a total of about $8.63M.
* MicroStrategy committed to revising its reporting and implementing stricter internal controls.
In addition to the SEC settlement ($11M from leadership, including $8.63M from Saylor), MicroStrategy faced shareholder class-action lawsuits, which were settled for $10M.
No executives were criminally charged, but the company’s and Saylor’s reputations suffered greatly.
In other words, Michael didn’t have any moral hesitation about faking company profits during losses. But investors and journalists started asking questions — and the SEC came knocking.
Let’s call it what it is: Saylor committed fraud, using hype, promising endless growth, and creating a cult around himself as a “financial genius and visionary.”
Michael went quiet, and the media tone shifted quickly — from super-visionary to one of the biggest losers and scammers.
To give him credit, he managed to keep the company alive and kept a low profile until 2020, like a mouse. 20 years — a generation change and a new hype cycle.
And what does a tech visionary do? Of course — jump into the new wave. A chance to restore his image — probably more important to him than money.
🟠 Bitcoin Era, 2020
Before 2020, Saylor was a Bitcoin skeptic. In 2013, he even tweeted that “Bitcoin’s days are numbered” and compared it to gambling.
But in 2020, he changed his position after deeply studying crypto. His mission: to protect capital and restore his image as a prophet — and he decided to buy Bitcoin.
But his own money seemed insufficient, so he turned to borrowing.
Here’s how the scheme works:
1.MicroStrategy issues stocks and bonds
📈 They sell new MSTR shares → get cash.
💵 They issue bonds (debt papers) → investors give them money at interest.
2. They use that money to buy Bitcoin
🟧 All the raised funds go into BTC purchases.
They don’t sell. Just hold. Never lock in profit.
3. If BTC rises → MSTR stock price rises
MSTR becomes a kind of "BTC ETF."
📊 BTC growth = MicroStrategy’s market cap growth.
🔁 Then they repeat the cycle.
Stock price up → issue more shares/bonds → buy more BTC → repeat.
📌 The catch:
They use other people’s money (debt) to buy BTC.
They sell almost nothing.
They bet BTC will grow faster than interest on the debt.
So as long as the price goes up — everything is fine.
Let’s admit: his fanaticism, aggressive marketing, and bold statements have helped Bitcoin.
But the main question: will the inevitable market correction wipe out this belief in endless growth?
🔍 His personality
It’s crucial for us as traders and investors to understand who really runs the company or project. The personal traits of leaders are useful information that gives us insight and a behavioral map.
We need to research not only products and financials, but also the psychological types of those making the decisions.
Saylor’s aggressive marketing and loud statements are part of his personality.
He fed off the hype around his persona more than any growing bank balance.
And there’s nothing wrong with that — until you start deceiving people to keep attention on yourself.
For example, in the 2000s, *Forbes* noted that Saylor “sold the dream” of a new economy where traditional profit metrics didn’t matter.
It attracted investors — but didn’t reflect reality. Forbes hinted that his desire to maintain the genius image may have led to accounting manipulation.
Saylor created an "expectations bubble" that burst.
His desire to prove he’s a genius led to a disconnection from reality.
He often talks about himself as a genius and visionary (sounds like a grandiose ego).
He positions himself as the savior of capital through BTC (messiah complex).
He publicly mocks “weak hands” and traditional investors (shows superiority).
He never admits mistakes, even after losing billions (denial and overconfidence).
He repeats his ideas again and again (manic fixation on being right).
His speech is like a manifesto, not a dialogue. He doesn’t converse — he proclaims.
I don’t sense greed in him. I sense emptiness that demands a cult.
He doesn’t live for money — he is obsessed with the idea.
And that’s the problem — there’s no objectivity here. It feels more like revenge after the humiliation and downfall of 20 years ago.
He’s smart — no doubt. But it’s not just intelligence. It’s cold messianism.
Obsession, not passion.
Psychotype: Grand strategist with a humiliation trauma
Trait Behavior
Narcissistic core “I’m special, my vision is above all.”
Obsession with greatness “I must be the truth, not just be right.”
Hyper-rationality “I survive through logic, not feelings.”
Psychological armor “I won’t show weakness. If I break, I disappear.”
Fanatical visionary “My idea is supreme. I don’t need to be humble.”
💸 More facts:
In 2024, Michael paid a FWB:40M fine for tax evasion.
The accusation:
He didn’t pay income tax in D.C., while actively living there — yachts, property, planes, frequent visits.
His tax returns didn’t reflect reality, and the investigation used GPS, Instagram, flight data, banking, and other digital traces.
Saylor didn’t admit guilt but agreed to settle for around $40M.
His personal wealth is mostly in MicroStrategy shares (9.9% or ~$8.74B by end of 2024).
Theoretically, he can sell them — but he must file a report within two days.
Current status:
MicroStrategy owns 555,450 BTC
Average purchase price: ~$68,550
Total purchase cost: ~$38.08B
Unrealized profit: ~$14.7B
And remember — Saylor’s slogan: Forever HODL.
📉 But the key point:
The company’s current debt is $7.24B.
All is good — as long as the price rises.
Analysts estimate BTC would have to fall to ~$20K before MSTR is forced to liquidate.
But if BTC nears the break-even zone, fear might hit shareholders first — triggering stock sell-offs.
If MSTR shares fall — which is likely during a BTC crash — bondholders, especially those with convertible bonds (which make up most of the debt), might demand repayment.
That could force Saylor to sell BTC.
Because in a crypto winter, buyers for MSTR stock or bonds may disappear.
So BTC could fall — not because of actual sales, but from fear of those sales.
This is my main concern with Saylor’s oversized influence on the market.
🐍 A bit of “reptilian” theory
What if BlackRock *planned* to use Saylor’s hands to push Bitcoin and concentrate large amounts in one basket — then take it from him?
Among the main bondholders are big institutions:
* Allianz Global Investors
* Voya Investment Management
* Calamos Investments
* State Street
These bonds are usually unsecured and non-convertible, making them attractive to investors who want Bitcoin exposure without direct ownership.
In case of default, bondholders have priority over the company’s assets — including BTC reserves.
🏛 State Street Corporation
Public company traded on NYSE.
Its biggest shareholders: Vanguard Group and BlackRock .
If so — they could end up holding as much BTC as Satoshi.
BlackRock’s IBIT holds ~500K BTC.
MicroStrategy holds ~500K BTC.
🤔 Questions to reflect on:
* Is industry leader fanaticism good for the development of crypto?
* What is Michael Saylor really doing? Avenging the past? Or truly in love with the technology?
* What risks does a whale with media influence and fanaticism and pockets full of Bitcoin and debt pose to the market?
Waiting for your thoughts in the comments, dear traders! Hugs! 🤗

Lingrid | BTCUSDT Short-Term PULLBACK After Momentum ExhaustionBINANCE:BTCUSDT is showing signs of distribution after failing to break through the $96,400 resistance zone. The structure still respects the upward trendline, but bearish divergence and fading momentum hint at a deeper correction. As long as BTC stays below this resistance, the risk of a pullback to the $91,000 level remains elevated.
📈 Key Levels
Sell trigger: Rejection below $96,400
Buy zone: $91,000
Target: $91,000
Bullish breakout: Only on strong close above $96,400
💡 Risks
Bitcoin is still holding trendline support, so aggressive shorts are risky without confirmation.
If bullish volume picks up near $91,000, price may bounce fast.
Macro catalysts or ETF news can flip sentiment in minutes.
Traders, if you liked this idea or if you have your own opinion about it, write in the comments. I will be glad 👩💻

Continued Bitcoin AnalysisAccording to the exact analysis, Bitcoin fell to the specified range and is currently on an upward path. You can follow the rest of the analysis in the main analysis updates.
Sasha Charkhchian

OLD BUT GOLD! Warning BTC next recession!In the previous article [ BTC may slightly decrease before the next move ] we pointed out the risk volatility of BTC in the ~96k range. So far, the BTC price analysis is going quite well as expected (not 100% accurate):
- The price increased to touch 109k5 and formed a resistance zone.
- Then the price dropped sharply and locked the 96k zone and headed to key level the 70k zone but stop at 74k7.
- Next, price is recovering very well to the 97k zone
- Please note that the analysis is for reference only, the BTC price movement is similar to the image, but not 100% correct, the price move up and down through the zone while moving. This analysis is based on personal technical analysis, not investment advice! => please consider your skills before making a decision!
The main content of this article will be the current price movement after recovering to the 97k area. The price tends to increase, but the upward force is much weaker , currently the price has created a form of resistance at the 97k area. In my personal opinion, this weakness can reverse at any time => ending the recovery phase into a downtrend phase. If this analysis is correct, we will look at the price of the nearest important support zone at 83k (move 1), if this price cannot be maintained, the price may continue to decrease further to the 70k area (move 2).
Everyone wants the price to rise and make good profits, but from a technical analysis perspective, we need to be objective to avoid buying or increasing positions in risky areas or maybe buying more in cheaper areas. I am not a fortune teller, this analysis will be wrong when the price breaks the 97k resistance and increases further. Trade safe!
The key support and resistance levels in this article are used from the BBND script.

BTC is heading towards 109-112With this idea we can buy the smallest possible volume to probe, because the current price is at the 2.618 profit level. If the price goes up, we will also make profit with a small volume of buying. I still prefer the price to return to where it started to increase, take all the liquidity and then increase strongly, however this is unlikely but not impossible.
BTC Short Setup IdeaFollowing the recent impulsive move, we’ve seen a significant number of short liquidations. There’s a high probability of a correction toward the accumulated liquidity near the lows. Additionally, keep an eye on the CME gap between $91,920 and $93,440 — a potential magnet for price.
The impulse itself shows signs of weakness, and there's a noticeable bearish divergence on the RSI, suggesting downward momentum. Price is currently testing a strong resistance area, corresponding to the 0.786 Fibonacci retracement level from the entire correction since the ATH. Moreover, the RSI has entered overbought territory.
I recommend starting to look for short entries from this zone, supported by these technical signals. As always, proper risk management is essential.
Looking forward to hearing your thoughts and feedback on this idea!

Strong resistance or a rebound from the upswing to resistance agStrong resistance or a rebound from the upswing to resistance again, trying again

BTC - TO THE MOON?Just some basic things to look out for here:
- we are currently inside the last supply zone (imbalance, orderblock, bad highs). Just treat it as a zone but look for distributive PA. Obviously momentum is on the bull side, so be very picky with short entries. Idea is that the high holds just like the previous range between 50-75k.
- if that short/sell signal fails, getting on board on bullish ltf momentum above the bad highs is a good way to play some short squeeze or bigger impulse. Obviously gonna be a crowdy trade, so get in when other longs get stopped.
- Pullback into first support: the poc of the weekly range we just reclaimed. It was the first rejection after getting back in, so we assume some shorts are still trapped here and would like to get out. Again treat it as a zone, poc differ on each trading pair because the volume is different everywhere. Coinbase poc is a bit higher, perp poc like this a bit lower.

BTCUSDT:Sharing of the Latest Trading StrategyAll the trading signals today have resulted in profits!!! Check it!!!👉👉👉
Today, the price of Bitcoin has broken through the level of $100,000. Bitcoin's upward performance remains strong. In terms of trading operations, one can simply open a long position following the trend. Pay attention to the support within the range of $98,000 - $100,000. Wait for a pullback and then open a long position.
Trading Strategy:
buy@98500-99500
TP:100500-101500
The signals in the Signature have brought about continuous profits, and accurate signals are shared every day. Hurry up and click to get them!
👇 👇 👇 Obtain signals👉👉👉

$BTC Finally $100K Surprised and Take Profit Done✨ CRYPTOCAP:BTC Surprise Finally Touch $100K Milestone again, All Take Profit and bonus Done.
💫 From Breaking News:
• Arizona Bitcoin Bill: Crucial SB 1373 Advances for State Bitcoin Reserve
• New Hampshire Becomes First to Approve Bitcoin Reserve—Will Other States Follow?
First introduced in January, HB 302, gives officials the ability to allocate state funds to both precious metals, and specific digital assets with a market capitalization of over $500 billion. That means Bitcoin, which, as of this writing, has a market cap of roughly $1.9 trillion per TradingView, is a prime candidate.
The newly enacted law states that any digital assets obtained must be kept using high security custody protocols. This can be done directly in a state managed multisignature wallet, via a qualified financial institution custody, or by investment in U.S. regulated exchange traded products (ETPs). Dennis Porter, CEO and Co-Founder of Satoshi Action, said:
“Satoshi Action drafted the model, New Hampshire engraved it into law, and now every treasurer nationwide can follow that roadmap. HB 302 proves you can protect taxpayer money, diversify reserves, and future-proof state treasuries all while embracing the most secure monetary network on Earth. New Hampshire didn’t just pass a bill; it sparked a movement.”
#Write2Earn #BTC #BinanceSquareFamily #MarketRebound #SUBROOFFICIAL
Disclaimer: This article is for informational purposes only and does not constitute financial advice. Always conduct your own research before making any investment decisions. Digital asset prices are subject to high market risk and price volatility. The value of your investment may go down or up, and you may not get back the amount invested.

#BTC how will it develop next?📊#BTC how will it develop next❓
🧠From a structural point of view, we are currently moving near the weekly resistance zone. We can only judge that we have successfully broken through the resistance zone when the closing price of the weekly candlestick chart is higher than the blue resistance zone, so we still need to remain vigilant before this condition is met.
➡️If we continue to break through the previous high, it means that the bullish power is still continuing, but the breakthrough is near the gray resistance zone, so wait patiently for the opportunity of a pullback before considering participating in long trades.
➡️I am not considering participating in short trades at present, because short trades are still counter-trend trades. I will only look for short trade opportunities after breaking the inflection point 93340 to establish a short structure or the price rises to the red target zone.
⚠️The Federal Reserve interest rate decision will be announced today, and we will wait patiently for the signal of market structure to appear.
Let's see👀
🤜If you like my analysis, please like💖 and share💬
BITGET:BTCUSDT.P

BITCOIN short setup ALL trading ideas have entry point + stop loss + take profit + Risk level.
hello Traders, here is the full analysis for this pair, let me know in the comment section below if you have any questions, the entry will be taken only if all rules of the strategies will be satisfied. I suggest you keep this pair on your watchlist and see if the rules of your strategy are satisfied. Please also refer to the Important Risk Notice linked below.
Disclaimer

Nice trade set up yesterday, watch these Trades for the weekWe got a delicious deviation from range low yesterday giving us an easy 9x.
Can we get in on a continuation long up to supply?

DeGRAM | BTCUSD held the support📊 Technical Analysis
● BTC is holding a well‑defined rising channel; the latest dip rebounded off the mid‑line/101 K zone (labelled “optimal buying”).
● A compact bull flag within that zone implies continuation toward the channel’s ceiling and the 108 K supply band.
💡 Fundamental Analysis
● Hong Kong spot‑BTC ETFs logged five consecutive inflow sessions, lifting combined AUM above $650 M and reducing tradable supply.
● US retail‑sales miss and dovish Fed commentary weighed on the dollar, improving risk appetite for crypto.
✨ Summary
Channel mid‑line defence, steady HK ETF demand and a softer USD support a long view: accumulate 101‑102 K, target 104.5 K → 108 K, cut if price closes below 97.4 K.
-------------------
Share your opinion in the comments and support the idea with a like. Thanks for your support!

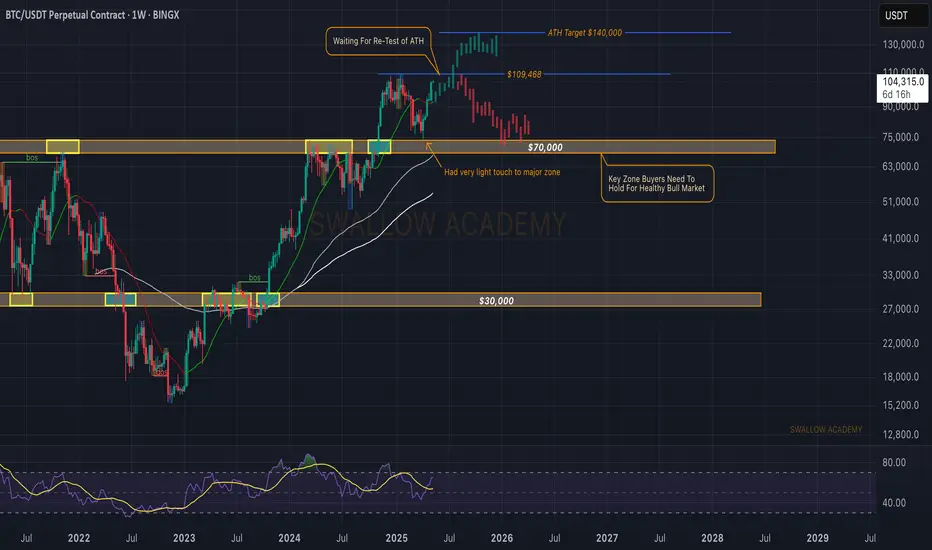
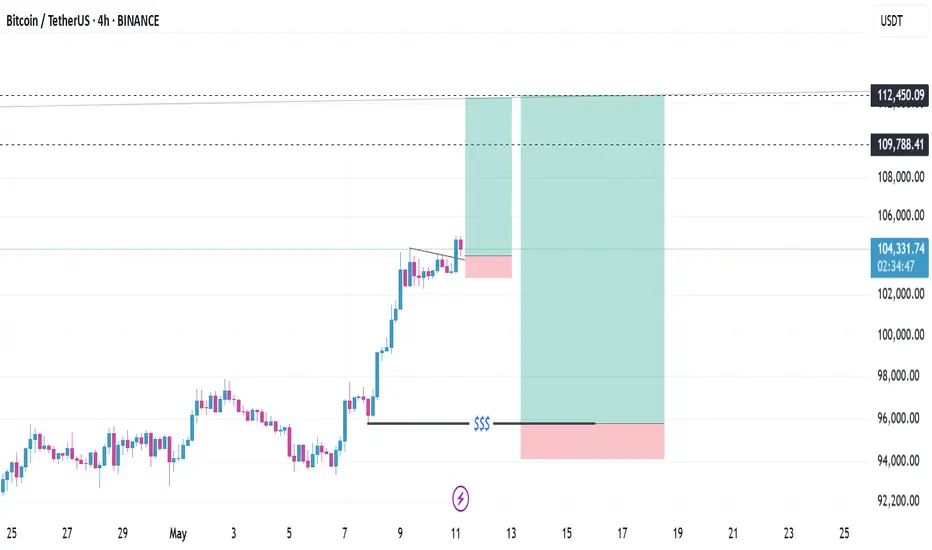
Bitcoin (BTC): Waiting For Re-Test of ATH This WeekBitcoin still holds current zones pretty well, where, with a possibility of a bloody start to the week, buyers still show dominance, pushing the price to the ATH area.
Now, despite that we are looking for the upward movement here, we are starting also to see small but strong sell-side moves (candles with strong bodies), so we are looking for the ATH to be touched and then we are expecting to see proper sell-side movement, where we want to see the liquidity hunting to start!
Swallow Academy