Current $BTC Analysis: target 100k
Price is currently testing the major descending trendline.
A breakout and weekly close above the trendline would confirm a strong bullish continuation and mark the beginning of a new upward wave.
Breaking the trendline = bullish confirmation.
Failure to break = possible short-term pullback before another attempt.
🎯 Next Target Levels After Breakout:
1 : $118,476
2 : $136,753
3 : $161,132
BTCUSDT.5L trade ideas

BTC daily time frame bearish divergence BITSTAMP:BTCUSD BTC bullrun looks like exhausted and slowing down. Today bearish divergence signal appeared on my really accurate indicator what suggest BTC chart slowly will be moving down for correction make higher low. I'm expecting that whales makes one more pushup to around 100k for capitalise their profits and execute short positions with grab liquidity from supply zone there. Of course that only my thoughts and it could goes different but pay attention on it

BTC – Waterfall?Price rejecting after Friday's blow-out.
Flow wise it's not that sellers stepped in, more like the one or few buyers that were buying with no regard for price, finally stopped buying. Price is mean reverting here, looking for balance again.
Notice how H4 trend stopped supporting price, and now became resistance over the weekend, after which price flushed for the first time.
A correction to mid-high 80s would be very healthy and the best case scenario for bulls imo. Reset momentum and positioning a bit while making a higher low.
If we yearly open and local lows hold here, we can look for a short setup.
Also note that the highs are pretty bad, a push into +95k might trigger a lot of short stops and give us a quick move above the highs. Be careful with getting or staying bullish there, unless price is slow grinding up above the high, it is very likely just a fake-out.

BTCUSDT 4H – Correction Before Breakout | Targeting $98KI'm seeing a potential bullish continuation pattern forming on the BTC/USDT 4H chart. After a strong upward trend, price is currently in a consolidation zone with a likely correction toward the $95,600–$96,000 area, which aligns with both pivot support and the rising trendline.
Key points from my analysis:
Support zone: $95,600–$96,000 (confluence of pivot point and ascending trendline)
Resistance targets:
R1: $97,272
R2: $98,050
R3: $99,308
Momentum: Stochastic RSI near overbought → suggests short-term pullback, then potential continuation.
Volume: No major distribution, bullish momentum remains intact.
📈 I expect a minor dip followed by continuation to R2 or R3, provided the $95,600 support holds.
Stop-loss idea: Below $94,756 (S1)
Take-profit zones: Partial at GETTEX:98K , rest near $99.3K
------------ManOf87_Pro Indicator--------------------
A powerful trading tool combining ATR-based trend detection, Fibonacci pivots, Fair Value Gaps (FVG), engulfing patterns, and multi-factor confirmations (MA, RSI, Bollinger Bands, volume, Z-Score, ROC).
*Buy Signal: Triggers when the trend shifts bullish (price exceeds ATR-based short stop), with strong buy signals requiring additional trend, momentum, and volume confirmation.
*Sell Signal: Triggers when the trend turns bearish (price falls below ATR-based long stop), with strong sell signals needing similar confirmations.
-Ideal for trend-following and breakout strategies, customizable for various markets and timeframes.

BTC (Post Weekly Close Update)BTC has seen a weekly close above the 93700 support, suggesting bullish strength and likely continuation if this level holds on the weekly. We remain bullish as long as 93700 is maintained; a drop below it would be the first SOW on the HTF, potentially targeting 89K–90K, and possibly 1D OB at 83K–85K. Technically, this remains a LH until the 99500 SH is convincingly reclaimed, ideally on a weekly close.
On the daily, however, we’ve observed the first SOW, closing below the SH at 95K after a rejection from the 1D supply zone, refined into MTF HOBs, where whales initially sold off aggressively. This isn’t alarming, but it warrants attention. With the SPX at resistance, the DXY at support, USDT.D closing the weekly well above the SL at 5.03, and TOTAL at resistance, these are signs of caution, in my view, despite the series of bullish news we’ve seen. That said, with the HTF remaining bullish, we’ll focus on exploiting LTF and MTF moves. The FOMC meeting on Wednesday could certainly bring volatility in the markets, particularly as BVOL24H and BVOL7D, as mentioned in the last update, are at support.👀
To further examine the weakness, note the contrast between the two horizontal ranges (grey boxes). The first range saw a BO followed by impulsive PA, smashing through the 90K key level. In contrast, the second range produced a BO but encountered an HTF supply, resulting in a notably weaker bounce compared to the first BO from the lower range. This could potentially manifest as a deviation if the price closes below the RL, making the 8D HOB at 89K–90K our next target.
On the LTF/ MTF, we’ve also seen a break below the TL, with the other resistance TL being respected, indicating further weakness. Although we haven’t yet seen HTF weakness, I believe a scalp-sized short from the 11H OB, refined into a 2H HOB at 95500 SH, makes sense with a tight invalidation, or from the MTF level around 97500, if provided. If the daily closes above 95500 again, I might consider a scalp long into the 1D supply for a potential DT or even the 100K psychological level.


DeGRAM | BTCUSD is continuing to rise📊 Technical Analysis
● Breakout above a multi-month triangle cleared the $95–98K zone. The price approached the long-term resistance line, steering price toward $108K.
💡 Fundamental Analysis
● Strategy bought 1,895 BTC and Semler Scientific added 167 BTC, marking a surge in corporate buying.
● Arizona passed legislation to invest up to 10% of $31.5B state assets in Bitcoin.
● New Hampshire governor signs crypto reserve bill into law.
● Metaplanet reaches 5,555 Bitcoin milestone with latest 555 BTC buy.
✨ Summary
Bullish breakout confirmed. Key levels: ~ GETTEX:92K support, ~$93–95K resistance, and $108K target. Strong institutional/state buying underpins the uptrend.
-------------------
Share your opinion in the comments and support the idea with a like. Thanks for your support!

Unlock Trading Success with Multi-Timeframe MasteryIn trading, particularly in the Forex market, a well-defined strategy is crucial for consistent profitability. One of the most effective techniques used by successful traders is multi-timeframe (MTF) analysis. By examining price action across different timeframes (e.g., daily, 4-hour, 1-hour), traders gain a clearer understanding of market structure, trend direction, and optimal entry/exit points. This article explores how MTF analysis works, its benefits, and practical steps to implement it in your trading.
🔍1. Analyzing a Pair Across Multiple Timeframes for Clearer Trend Direction
The foundation of MTF analysis lies in identifying the major and minor trends. By analyzing at least two timeframes, traders can align their strategies with the broader market direction while fine-tuning entries on shorter timeframes.
⚡The High Wave Cycle (HWC) Approach
To begin, determine your High Wave Cycle (HWC), which depends on your trading strategy and timeframe. For instance:
If you trade on the daily timeframe, your HWC might be the monthly chart.
If you trade on the 1-hour timeframe, your HWC could be the weekly chart.
The HWC helps you identify the major trend. For example, on the daily chart, you might analyze the trend using Dow Theory, pinpoint key support and resistance levels, and identify trendlines or patterns. This gives you a clear picture of the market’s broader direction.
Once the HWC is defined, give it significant weight when analyzing lower timeframes for trade setups. For instance, if the daily chart (HWC) shows a downtrend, you’d prioritize bearish setups on the 1-hour chart, even if a minor uptrend appears.
Example: SOLUSDT Trade Setup
Consider a scenario where the 1-hour chart shows a strong uptrend. The price breaks a key resistance level and a descending trendline, suggesting a potential long position.
However, checking the daily chart..
(HWC) reveals a clear downtrend. According to Dow Theory, a major trend reversal requires a confirmed break above the previous high (e.g., $150). Since this hasn’t occurred, the market remains bearish.
In this case, MTF analysis guides your strategy:
Reduce position size to lower risk, as you’re trading against the major trend.
Take profits early, as the price could reverse at any moment.
Avoid overtrading by limiting the number of positions until the trend change is confirmed.
This approach ensures your trades are aligned with the bigger picture, minimizing losses from false signals.
🎯2. Spotting Entries and Exits by Confirming Trends Across Timeframes
MTF analysis not only enhances risk management but also improves the precision of your entries and exits. By confirming signals across timeframes, you can filter out noise and focus on high-probability trades.
Example: Bitcoin (May 15, 2021)
Let’s rewind to May 15, 2021, during Bitcoin’s post-bull run correction. On the daily chart (HWC), the price formed lower highs and lows, breaking a key support level, signaling a bearish trend and a potential exit for long positions. This indicates that spot traders should sell, and swing traders on lower timeframes should focus exclusively on short positions.
On the 1-hour chart, you might spot a minor pullback, tempting a long trade. However, MTF analysis reminds you to align with the daily downtrend, so you’d only consider short setups. This disciplined approach prevents you from trading against the major trend, improving your win rate.
📊The Medium Wave Cycle (MWC) for Added Clarity
Between the HWC and lower timeframes lies the Medium Wave Cycle (MWC), which provides an intermediate perspective. For example, if your HWC is the daily chart, the MWC might be the 4-hour chart. The MWC helps confirm the major trend’s strength or detect early signs of reversals before zooming into lower timeframes for entries. By checking the MWC, you can filter out noise and ensure your trades align with both the major and intermediate trends.
💡Conclusion
Multi-timeframe analysis is a game-changer for traders seeking consistency and precision. By combining the major trend from your HWC, the intermediate perspective from your MWC, and minor trends on lower timeframes, you can make informed decisions, manage risk effectively, and time your trades with confidence.
Start by defining your HWC and MWC, analyzing the major trend, and aligning your entries and exits with multiple timeframes. Pick a pair, test this strategy on a demo account, and share your results in the comments below! With practice, MTF analysis will give you a tactical edge in navigating the markets.
🤍 btw im Skeptic :) & If you found this article helpful, don’t forget to like, share, and follow for more insights and trading strategies! <3

The Hidden Power of the Silver Bullet Strategy - Full GuideIntroduction
The Silver Bullet Strategy is a high-probability intraday trading technique popularized within the Smart Money Concepts community. It focuses on taking precision trades during specific times of the day when liquidity is most active. Mastering this strategy can help traders consistently capture high-quality setups with minimal risk.
In this guide, we will cover:
- What the Silver Bullet Strategy is
- Key Times to Watch
- Entry Models
- Target Setting
- Risk Management
- Real Chart Examples
---
What is the Silver Bullet Strategy?
The Silver Bullet Strategy is based on trading within a "window" of high-probability price action, typically during key liquidity times. It looks to capture moves after liquidity sweeps, order block mitigations, and Fair Value Gap (FVG) plays.
Key Principles:
- Focuses on high-probability windows (New York session especially)
- Waits for a liquidity grab and displacement
- Entries are often on FVGs, OBs, or MSS points
---
Silver Bullet Timing Windows
Timing is crucial to this strategy. The "Silver Bullet" typically occurs in these windows (New York time):
- First Window: 10:00 AM - 11:00 AM (New York)
- Second Window: 2:00 PM - 3:00 PM (New York)
These times capture major moves post-liquidity sweeps or reversals after news/market manipulation.
---
Silver Bullet Entry Model
The classic sequence for a Silver Bullet setup:
1. Identify Liquidity Sweep: Look for price to grab liquidity above a swing high or below a swing low.
2. Look for Displacement: A strong move away from the sweep, creating a Fair Value Gap (FVG) or Breaker Block.
3. Entry in FVG or OB: Enter on a retracement into the FVG or Order Block after displacement.
4. Confirmation: Use lower timeframe MSS or BOS to confirm the reversal.
Liquidity sweep and FVG at the 5m:
MSS + Displacement candle at the 1m:
So all 4 steps completed!
Example Entry Checklist:
- Liquidity sweep
- Strong displacement creating an FVG
- Price retraces into FVG or OB
- MSS/BOS confirmation
- Execute trade with tight stop-loss
---
Where to Set Targets
Targets should be logical based on market structure:
- First Target: Recent internal liquidity (equal highs/lows)
- Second Target: External liquidity zones (major swing highs/lows)
- Optional: Use 1R/2R/3R scaling based on risk-to-reward goals
---
Risk Management for Silver Bullet Trades
Golden Rules:
- Risk less than 1% per Silver Bullet setup
- Set stop-loss beyond the liquidity sweep (not too tight, not too loose) or above FVG
candle
- Stick to one or two trades per window maximum
- Avoid revenge trading outside the windows
---
Common Mistakes to Avoid
- Trading outside the specified time windows
- Entering without a confirmed sweep and displacement
- Overleveraging because the strategy "looks easy"
- Ignoring higher timeframe bias (HTF context is still critical!)
Pro Tip: Combine Silver Bullet entries with SMT Divergences, MSS, and IFVGs for maximum confluence.
---
Final Thoughts
The Silver Bullet Strategy is one of the cleanest ways to approach intraday trading. By mastering liquidity concepts, timing, and precision entries, traders can catch powerful moves with strong risk-to-reward setups.
Be patient, wait for your window, and always trade with discipline.
Happy Sniping!
Bitcoin at Daily Resistance — Reversal Incoming?Bitcoin is currently perched at a critical inflection point, with price action stalling at a major daily supply zone and 0.618 Fibonacci resistance. This region has acted as a key decision point in recent months, and now stands as a potential trigger for the next leg down.
If Bitcoin confirms rejection from this level, it could mark the beginning of the C-leg in a broader ABC corrective structure. The implications are clear: a move back toward the 0.618 Fibonacci support could unfold quickly, especially if price fails to maintain a foothold above this resistance.
This area is also the upper boundary of a descending channel that’s held since November 2024 — a structure that’s added considerable technical confluence and credibility to the current bearish outlook.
From a trader’s lens, we are still trading at resistance until proven otherwise. Without a clean breakout and hold above this range, the bias remains to the downside. A confirmed breakout above would invalidate the bearish thesis, but until then, risk is skewed toward further downside as the market digests recent gains.

BTC | WHY Bitcoin is BULLISH | 2021 Fractal5 reasons why I say BTC is on it's way to a new ATH (All Time High) :
✅1️⃣ Support zone reclaimed
BTC has successfully reclaimed the support zone ABOVE the neckline resistance, a topic that I've been discussing over the past two weeks. If you'll recall, I pointed out either 70k or 90k. We have our answer:
✅2️⃣ Trendlines
Trendlines are BULLISH as BTC continues to make highger lows, a key indication of bullish sentiment even when a pullback is present:
✅3️⃣ Moving Averages
BTC has reclaimed ALL moving averages in the daily, a bullish indication:
✅4️⃣ Trend Based Indicators
A bullish flash in the weekly is a strong sign:
✅5️⃣ Fractal
It's possible that BTC plays out similarly to the previous ATH fractal from 2021:
________________________
BINANCE:BTCUSDT

BTCUSDT trading signal analysis- Bullish Channel as an corrective pattern in Short Time Frame
- Break of Structure
- RSI - Divergence
- Change of Characteristics
- Completed " 123 " Impulsive Waves

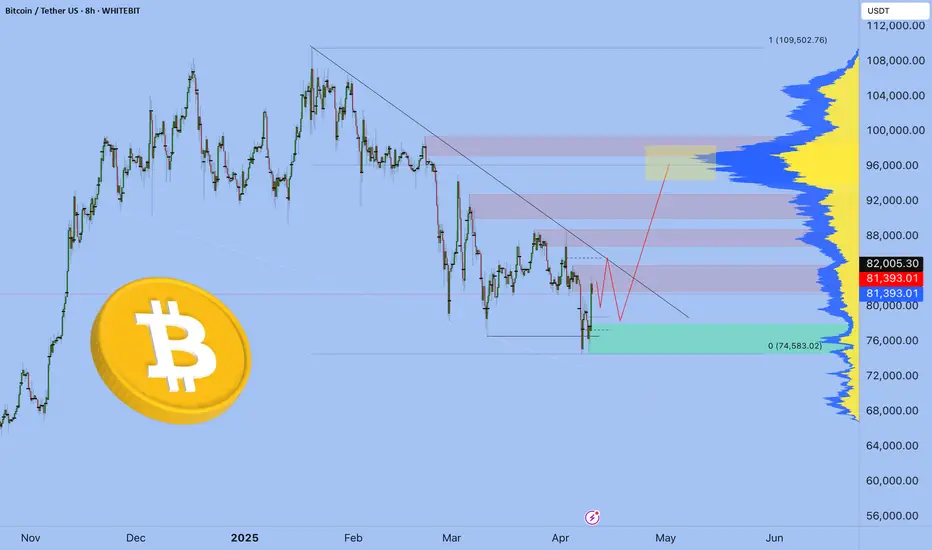
Has Bitcoin Begun Its Final D-Leg Correction?Bitcoin could be starting the final stage of a larger corrective pattern — known as the D-leg — which often follows major trends in the market. This kind of structure typically forms after a big move up, and signals that the market might need a deeper reset before continuing higher.
Recently, Bitcoin was rejected from a key resistance zone around $98,300, which aligns with several technical indicators including a major daily support/resistance flip, the 0.618 Fibonacci retracement, and the Point of Control (a price level with the most traded volume). This rejection has sparked concerns that a local top may already be in for this cycle.
Why This Matters:
If Bitcoin fails to hold its current support levels, we could see a continuation to the downside, with targets potentially reaching sub-$60K levels. This aligns with a broader corrective pattern some analysts call an ABCD structure — where the D-leg often marks the final leg down before the next larger trend can begin.
This scenario becomes more likely if the current support zone breaks down, which would confirm a shift in market structure. Until then, there’s still room for price to range or attempt another retest of the highs, but caution is warranted.
What’s Next:
Watch for a breakdown below the recent lows — this would strongly suggest the D-leg is underway.
A confirmed breakdown would likely lead to a longer correction over the coming weeks or months.
However, if Bitcoin reclaims resistance above $98,300, this bearish outlook could be invalidated and the structure may reset.
Right now, we’re at a major decision point in the market. While the signs are stacking in favor of a deeper pullback, it’s important to wait for price to confirm with structure and volume before acting on it.

BTC at Crucial Retest Zone — Bearish Setup in Play!Price Action Alert on #BTC/USDT (4H Timeframe)
#Bitcoin recently broke down from a rising wedge, a classically bearish pattern. Alongside this, we've also identified a bearish RSI divergence, further validating potential downside momentum.
Key Observations:
🔺 Rising wedge breakdown confirmed
📉 Bearish divergence on RSI (4H)
🔁 Price is now retesting the broken wedge from below (a classic bear signal!)
⛔️ Still holding above a key horizontal support — watching for a clean break here for confirmation
📌 Bearish Trade Setup (Waiting for Confirmation):
Entry: Below key support zone (marked on chart)
Target 1: $84,300
Target 2: $75,000
Stop-loss: Above wedge breakout point (100,500)
💼 Always follow proper risk management!
🧠 Why This Matters:
The combination of pattern breakdown, bearish divergence, and a retest zone is a powerful signal — but patience is key. We wait for full confirmation (support break) before executing any short trade.
📣 What do you think — will #BTC break the support or bounce back? Drop your thoughts in the comments! 🗣️
If you found this analysis helpful, like, comment, and follow for more real-time setups! 🚀
#BTC #Bitcoin #CryptoAnalysis #PriceAction #Bearish #ShortSetup #RisingWedge #TechnicalAnalysis #CryptoTrading #TradingView

Bitcoin Breaks Wedge! Correction Coming Before Next Leg? After Trump said in the press conference, " Better go out and buy stocks now ." The SPX500 index started pumping , and as I said in the ideas of the last few days, Bitcoin ( BINANCE:BTCUSDT )'s correlation with this index has increased. Bitcoin also started pumping.
Yesterday's Bitcoin pump succeeded in failing the Ascending Broadening Wedge Pattern , generally, if the reversal pattern fails, it will play a continuation role .
Bitcoin is moving between the Support zone($100,270-$97,700) and the Resistance zone($109,588-$105,865) . The question is whether Bitcoin will touch the Support zone($100,270-$97,700) again and move towards the Resistance zone($109,588-$105,865) or will it continue its upward trend.
In terms of Elliott Wave theory , it seems that Bitcoin has completed microwave 3 of the main wave 5 . We can expect an even Time Correction on Saturday and Sunday when trading volume is low . There is also a possibility that microwave 4 of the main wave 5 in Cumulative Long Liquidation Leverage($101,838-$101,432) will be completed.
One of the reasons I think we should wait for a correction is the USDT.D% ( CRYPTOCAP:USDT.D ) chart, which we used as a guide in previous ideas .
USDT.D% has reached Monthly Support(1) and a Heavy Support zone(4.73%-4.50%) , which I believe is unlikely to be broken within in first attack , and I expect an increase to the Fibonacci lines on the chart.
I expect Bitcoin to start rising again after a correction .
Cumulative Short Liquidation Leverage: $105,114-$104,100
Note: If Bitcoin touches $97,500, we should expect further declines.
Please respect each other's ideas and express them politely if you agree or disagree.
Bitcoin Analyze (BTCUSDT), 2-hour time frame.
Be sure to follow the updated ideas.
Do not forget to put a Stop loss for your positions (For every position you want to open).
Please follow your strategy and updates; this is just my Idea, and I will gladly see your ideas in this post.
Please do not forget the ✅' like'✅ button 🙏😊 & Share it with your friends; thanks, and Trade safe.

Here's a simply analysis on BTC.BTC Update:
BTC faced rejection after reaching $97.8k, and with the current price at $94.4k, it is now in Retest Range 1 between $92.5k and $94.5k. This range has previously shown multiple rebounds, but when compared with the RSI, the chances of further rejection appear higher.
In another scenario, if BTC fails to hold Retest Range 1, we may see it pulling back or retesting levels around $87k.
Be cautious with multiple long positions for now and always trade with a proper stop-loss.
Regards,
Dexter

$BTC support zoneCRYPTOCAP:BTC has broken out of a falling wedge and is now consolidating above the key $91K support zone.
- Eyes are now on the All-Time High at $ 109 K.
- Once that breaks, a price discovery rally toward $ 120k+
It is highly likely. 🧠
- The chart looks.
DYRO, NFA

Bitcoin update 10.04.2025 - BTC - 98k in May🔥 The Markets Are on Fire — and We Know Who Lit the Match.
The last few weeks have been pure chaos.
Markets are crashing, confidence is shaking, and crypto is confused.
And let’s not pretend we don’t know who’s behind it.
Donald Trump.
Even a Korean guy selling panda souvenirs on the street told me:
“This Trump is ruining everything.”
And he’s not wrong.
Billions wiped. Positions wrecked.
But here’s the thing — this isn’t random. This is tactical drama.
Trump sees himself as a master negotiator, and here’s how he plays the game:
🎭 The Trump Cycle (Get Ready for the Loop)
Pressure — tariffs, chaos, media hysteria. We’ve seen it.
Relaxation — 90-day delays, fake calm.
Talks — and boom, “positive developments.”
Good News —
• “Bitcoin added to U.S. reserves.” in MAY?
• “Americans to receive new stimulus.”
• “China’s our friend again!”
Charm & Flirt Mode — improving global relations, smiling at cameras.
More good news — stock markets fly, crypto rips and everyone screams, “New bull run!”
And then?
💥 Back to pressure.
📆 September 2025 is the punchline.
That's when this cycle hits the weaker economies like a freight train:
✅ Broken supply chains
✅ Collapsing currencies
✅ Defaults
✅ And where there’s chaos — there’s war. Expect escalation in fragile regions like the Middle East.
✅ Crude oil falling to 40$
Markets will top on pure euphoria.
The reversal begins when everyone’s drunk on hopium and “good news”.
💼 My Plan? Ruthlessly Simple:
🔹 May I will participate in the first Offline/Online International Crypto Trading Cup 2025 by WhiteBIT
🔹Jun-August -Euphoria in the market
🔹 September - Take profits
🔹 Either short — or sip something cold on a quiet beach. But we will see
We’ve officially entered the Turbulence Zone.
The following 10 years will be insane — for those who adapt, evolve, ride the trends, and harness AI and tech.
If not?
You get left behind.
It’s not the strongest who survive — it’s the fastest to adapt.
Best regards, EXCAVO
BTC NEW UPDATE (4H)This analysis is an update of the analysis you see in the "Related publications" section
Bitcoin has not yet reached our zone, but it has formed a correction of the same degree as the previous ones and has also created a support area. The diametric pattern could potentially shift into a symmetrical one, and Bitcoin may even reach the 100K–105K zone.
We should keep a close eye on the 100K level for now, as it also serves as a psychological resistance.
For risk management, please don't forget stop loss and capital management
Comment if you have any questions
Thank You

DeGRAM | BTCUSD Holds the Accumulation Zone📊 Technical Analysis
● BTC rebounded off rising‐channel boundary and has formed a base in the $93K–95.3K accumulation zone. A decisive break above ~$95,700 would confirm a fresh leg to $98,000.
● Higher lows and tightening range signal building bullish pressure for an impulsive move toward the channel top.
💡 Fundamental Analysis
● Spot BTC ETFs logged ~$675 M of net inflows on May 2.
✨ Summary
Rising‐channel support + sustained ETF demand favor a short‐term long bias: targets GETTEX:98K → $100K; view invalidated below $91,500.
-------------------
Share your opinion in the comments and support the idea with a like. Thanks for your support!

Whether it can be supported and rise at 102429.56 is the key
Hello, traders.
If you "Follow", you can always get new information quickly.
Please also click "Boost".
Have a nice day today.
-------------------------------------
(USDT.D 1M chart)
If USDT dominance is maintained below 4.97 or continues to decline, the coin market is likely to enter an upward trend.
(BTC.D 1M chart)
However, I think that for the altcoin bull market to begin, BTC dominance must be maintained below 55.01 or continue to decline.
If USDT dominance falls and BTC dominance rises, most altcoins are likely to gradually move sideways or show a downward trend.
In other words, it is highly likely that only BTC will continue to rise.
-----------------------------------------
(BTCUSDT 1M chart)
Based on the current position, in order to continue the uptrend, the price must be maintained above the Fibonacci ratio of 1.902 (101784.54).
If not, it is likely to fall to around the Fibonacci ratio of 1.618 (89050.0).
If the uptrend continues, the point to watch is whether it can renew the new high (ATH) this time.
-
(1W chart)
It is rising after touching the 73499.86 area.
It is showing a large increase as it breaks through the HA-High indicator point of 97226.92 on the 1W chart.
Since the StochRSI indicator is expected to enter the overbought zone, it is highly likely that the future rise will be limited.
Therefore, the key is whether the price can be maintained above the left Fibonacci ratio of 1.902 (101784.54).
If it falls, you should check whether it is supported near 97226.92.
If it falls below 97226.92, you should check whether it is supported in the 1st and 2nd sections marked on the chart.
You should check where the StochRSI 80 indicator is formed when the next candle is created.
The StochRSI 80 indicator on the 1M chart is formed at the 102429.56 point.
Therefore, we need to check whether the StochRSI 80 indicator point on the 1W chart is formed around the 102429.56 point.
-
(1D chart)
Since the StochRSI indicator on the 1D chart is located below the midpoint, we need to focus on finding a buying point.
With this rise, the StochRSI indicator is expected to rise above the midpoint.
If the StochRSI indicator is located above the midpoint, we need to focus on finding a selling point.
Therefore, the point of interest is whether the price can be maintained around the right Fibonacci ratio 1.902 (101784.54) as we pass through the next volatility period around May 19.
-
Among the interpretation methods of the OBV indicator, there is an interpretation method that there is a possibility of an increase or decrease when the previous high or low is broken.
This time, it showed an upward break through the upper line of the OBV and broke through the lower line of the previous OBV.
In other words, it showed an upward break through the A section.
If this upward break through the B section is continued, it is expected to renew the ATH.
-
Thank you for reading to the end.
I hope you have a successful transaction.
--------------------------------------------------
- This is an explanation of the big picture.
I used TradingView's INDEX chart to check the entire section of BTC.
I rewrote the previous chart to update it by touching the Fibonacci ratio section of 1.902 (101875.70) ~ 2 (106275.10).
(Previous BTCUSD 12M chart)
Looking at the big picture, it seems to have been following a pattern since 2015.
In other words, it is a pattern that maintains a 3-year bull market and faces a 1-year bear market.
Accordingly, the bull market is expected to continue until 2025.
-
(Current BTCUSD 12M chart)
Based on the currently written Fibonacci ratio, it is displayed up to 3.618 (178910.15).
It is expected that it will not fall again below the Fibonacci ratio of 0.618 (44234.54).
(BTCUSDT 12M chart)
I think it is around 42283.58 when looking at the BTCUSDT chart.
-
I will explain it again with the BTCUSD chart.
The Fibonacci ratio ranges marked in the light green boxes, 1.902 (101875.70) ~ 2 (106275.10) and 3 (151166.97) ~ 3.14 (157451.83), are expected to be important support and resistance ranges.
In other words, it seems likely to act as a volume profile range.
Therefore, in order to break through this section upward, I think the point to watch is whether it can rise with support near the Fibonacci ratios of 1.618 (89126.41) and 2.618 (134018.28).
Therefore, the maximum rising section in 2025 is expected to be the 3 (151166.97) ~ 3.14 (157451.83) section.
To do that, we need to look at whether it can rise with support near 2.618 (134018.28).
If it falls after the bull market in 2025, we don't know how far it will fall, but considering the previous decline, we expect it to fall by about -60% to -70%.
So, if the decline starts near the Fibonacci ratio 3.14 (157451.83), it seems likely that it will fall to around Fibonacci 0.618 (44234.54).
I will explain more details when the downtrend starts.
------------------------------------------------------

Bitcoin and its RALLYBTC lately has gain 37% back of this value after the crash to 74k, what a great swing coming back to 102k, no one beleiving.
Im starting a short position around this level into 90k

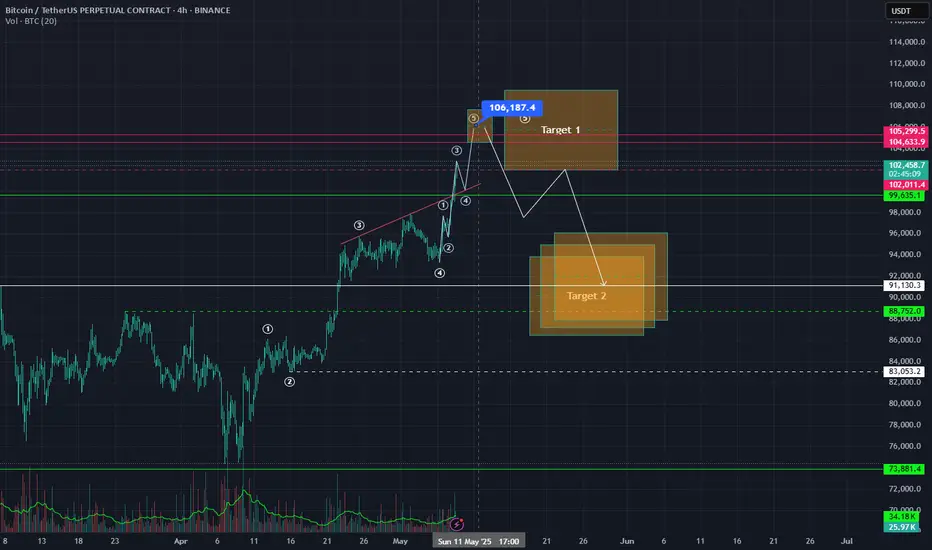
Bitcoin on the road to $105k and beyond...So Bitcoin has finally flipped from bearish in April to bullish in May 25.
As per Elliott Wave theory, it has been printing a clear Wave 1 from the bottom below (aprox. @$74.500).
At the time of this post, btc is @ the impressive price of $102.289.
I has clearly made a subwave 1, 2, 3, 4 and its on its way of finishing up subwave 5.
Thing is... this looks as a non stop movement for the time being.
That´s how BULLISH everyone hast turned.
My projection is that the whole swing should finally end somewhere between $104.600 - $105.300 (even if it could push a bit higher, such as $106.200 or so). Yes, it could go even further and then $107k, 109 and 110 would be open. But it seems fare reaching.
I rather stick to the former:
Wave 1 would end at around $104.600 - $105.300, and Wave 2 correction could take us somewhere between $93.500 and $88.750 (give or take).
It´s game! Let´s see how this finally plays out...
Bias: BULLISH