Bitcoin - No one expect this move! 20% this week (plan here)Whales are preparing a huge trap for the retail traders, and you probably already know that the trap is this massive falling wedge! Falling wedge patterns are usually bullish, right? But not if they occur at the end of a trend. You probably want to trade wedges that are at the start of a trend. What's more, everyone is watching and buying into this wedge, which brings so much questions - will all retail traders get REKT again? Most likely yes, as usual. You want to do pretty much the opposite of what the majority of retail traders do to be a profitable trader.
You probably already know that Bitcoin is manipulated and controlled by the banks and huge institutions. They control the price and development. Do not be fooled that some average Joe geek from Florida eating McDonald's controls the development. Whales need liquidity to buy because their orders are so huge; they need time to buy as much Bitcoin as possible. That's why they need to push the price down to take all stop losses from retail traders.
The price is below the 20, 50, 100 and 200 daily moving averages - that's a huge downtrend! Also, on the chart we can see a huge previous rectangular range between 108k and 91k. It does make sense if the price will test this range before continuing to the downside. To me, this is indeed a risky speculation. I definitely don't want to speculate on that, because sooner or later Bitcoin will crash to 67k! I don't trust this falling wedge at all! Please tell me, what about you?
Write a comment with your altcoin, hit the like button, and I will make an analysis for you in response.
BTCUSDT trade ideas

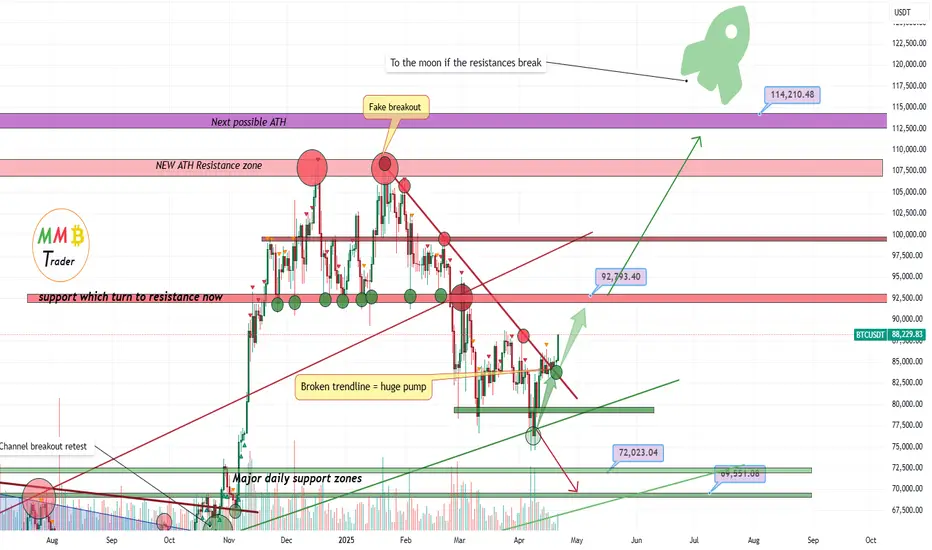
Bitcoin Broke falling trendline and retest complete= Heavy pump As we can see the red trendline is already broken and porice is going to test 92K resistance zone and soon after that the resistance there will also break and we are looking for bull market now again and rise and gain for Spots in upcoming weeks.
DISCLAIMER: ((trade based on your own decision))
<<press like👍 if you enjoy💚
BTC - Is this rally sustainable and what to expect?In the past two days, Bitcoin has experienced an impressive surge in price, exploding from around 85k to over 94k, showing strong bullish momentum. This rapid movement has certainly caught the attention of many traders and investors. However, while the price action has broken through previous lower highs, signaling a potential shift in market sentiment, it's crucial to approach this rally with caution.
Although the recent price increase indicates that bullish momentum is in play, it's important not to overlook the possibility of a short-term pullback or consolidation. The market has shown volatility before, and while breaking the lower-high structure is a positive sign, it doesn’t necessarily guarantee sustained upward movement.
In this analysis, I will dive deeper into the current price action and what it means for BTC short-term outlook. We’ll explore the factors to watch in the coming days and the potential risks that could challenge the bullish trend.
------------------------------------------
What will we discuss:
- Golden Pocket fibonaccy with resistance
- Point of Control
- Stochastic RSI
- The deathcrosses
------------------------------------------
Golden Pocket fibonaccy with resistance
The golden pocket Fibonacci zone (0.618–0.65), measured from the highs to the lows on the higher timeframe, is located between 96,450 and 97,580. This area aligns with a key resistance level that previously triggered a strong move down in BTC. The golden pocket often acts as a strong rejection zone, and bears are likely to try defending this level again. So be careful on how price will move into this level and how it reacts.
------------------------------------------
Point of control (POC)
The Point of Control (POC) for the entire trading range from November to the present is located precisely at 96,450. This level is particularly significant as it aligns with multiple technical factors, creating a strong confluence zone. Not only does it coincide with a well-established resistance area that previously initiated a sharp move to the downside, but it also sits within the golden pocket Fibonacci.
The POC marks the price level where the highest volume of trading activity has occurred during this entire range, indicating a strong area of interest for both buyers and sellers. High-volume nodes like this often act as magnets for price and tend to offer either strong support or resistance depending on the context. In this case, with the POC positioned within a broader resistance zone, it becomes an even more formidable barrier.
------------------------------------------
Stochastic RSI
The Stochastic RSI on the daily timeframe is currently in the overbought zone, where it has remained for approximately 10 consecutive days. This prolonged stay in overbought territory suggests that bullish momentum may be weakening and the indicator is beginning to show signs of exhaustion.
Typically, when the Stochastic RSI hovers in this upper range for an extended period without a meaningful pullback, it signals that a reversal or at least a slowdown in the prevailing trend could be imminent. The oscillator appears to be running out of steam, and barring a sudden surge in buying pressure, it is likely to start curling downward in the coming days or within the next week.
This could imply a shortterm correction is luring.
------------------------------------------
Deathcrosses this cycle
A deathcross is a bearish technical indicator (lagging) that occurs when a shorter-term (50-day MA) crosses below the longer-term (200-day MA).
Deathcross 1
At the time of the first death cross, the price of BTC had already formed a local low before the crossover occurred. Following the death cross, BTC experienced what is commonly referred to as a "death cross rally" — a counterintuitive move where price rallies shortly after the bearish signal.
This rally was significant, as it broke short-term market structure to the upside and eventually found support at the 50-day MA, the same level that previously acted as resistance. That support held, even during a brief rejection, and marked a key shift in momentum.
From there, BTC continued its upward move and eventually went on to make new highs, effectively invalidating the immediate bearish expectations typically associated with a death cross.
Deathcross 2
The second death cross in this cycle occurred after Bitcoin had already established a local low and began moving back upward toward the death cross. Initially, BTC struggled to break above the 50-day MA, but it eventually managed to push through.
However, this time, during the subsequent correction, Bitcoin was unable to hold the 50-day MA as support. Instead, it formed a higher low, indicating a shift in market dynamics and suggesting that the selling pressure may have been weakening. This higher low marks a crucial point in the price structure, as it hints at potential bullish momentum building, despite the earlier bearish signal from the death cross.
Deathcross 3
This time, the low was established right at the moment of the death cross, and BTC began to move upward immediately after the crossover occurred. After initially struggling to break above the 50-day MA, BTC surged higher and managed to surpass both the 50-day and 200-day MA.
Currently, BTC is facing strong resistance at these levels. The question now is whether BTC will correct and find support at the 50-day MA once again, as it did during the first instance, or if it is aiming to form a higher low, similar to the second occurrence.
In both scenarios, Bitcoin has historically experienced a pullback after a few days of upward movement, so a correction at this point would not be surprising.
------------------------------------------
Thanks for your support.
- Make sure to follow me so you don't miss out on the next analysis!
- Drop a like and leave a comment!

Ultimate Guide to Liquidity Sweeps: Trading Smart Money MovesIn the world of Crypto and other financial markets, liquidity sweeps are deliberate price moves designed to capture liquidity sitting above or below key price levels. These moves are not random, they are orchestrated by large players who need to fill significant orders efficiently. By pushing price into zones where stop-losses and pending orders accumulate, these entities access the liquidity required to open large positions without causing excessive slippage.
Liquidity sweeps offer sharp insights into market structure and intent. Understanding how they work and recognizing them in real-time can significantly enhance a trader’s edge, especially in environments dominated by algorithmic and smart money behavior.
Defining the Liquidity Sweep
A liquidity sweep is characterized by a quick push through a well-defined support or resistance level, typically a recent high or low, followed by a swift reversal. These zones are hotspots for stop orders placed by retail traders, such as long stop-losses placed under swing lows or short stops above recent highs. When these stops are triggered, they act as liquidity pools.
Large players anticipate these zones and use them to enter positions. The sweep creates an illusion of breakout or breakdown, luring reactive traders in, only for the price to reverse direction once the necessary liquidity is absorbed. This mechanism reveals the strategic manipulation often present in efficient markets.
Structure and Behavior of a Sweep
The process typically starts with the market forming a recognizable range, often between a defined high and low. Price then consolidates or slowly trends toward one edge of the range, building tension. As the market reaches that boundary, a sudden surge beyond the level occurs, this is the sweep. Importantly, price does not sustain above or below the level. Instead, it quickly retraces, printing a rejection wick or reversal pattern.
Following the reversal, the market often resumes its original trend or begins a new leg in the opposite direction of the sweep. For traders, this offers a clear point of entry and invalidation, allowing for precise trade setups.
Bullish Scenario, Sweep of Lows
When Bitcoin approaches a prior low, especially one that marked a swing point or a support level, many traders place their stop-losses just below that low. This creates a pocket of sell-side liquidity.
In a bullish liquidity sweep, price will spike below this prior low, often triggered by a news event, a large market order, or a sudden increase in volatility. The market will quickly wick below the level, triggering stop-losses and perhaps inviting new short positions. However, instead of continuing lower, price snaps back above the broken level and begins to climb.
This reversal indicates that large players were absorbing liquidity at the lows and are now positioned long. Traders can look for bullish confirmation via engulfing candles, reclaim of the low, or a fast return into the previous range.
Bearish Scenario, Sweep of Highs
Conversely, when Bitcoin grinds higher toward a prior swing high or resistance level, traders anticipating a breakout may enter early, while others have stop-losses on short positions resting above the level.
A bearish liquidity sweep occurs when price spikes above the prior high, triggering those buy stops and breakout entries. Almost immediately, the market reverses, showing rejection at the highs. This action signals that buy-side liquidity has been used by larger players to enter short positions.
Once price fails to hold above the breakout level and begins to drop, the sweep is confirmed. Traders aligned with this read may look for bearish structure to form, such as a lower high, and enter short with a defined invalidation above the sweep.
Common Pitfalls and Misinterpretations
One of the most frequent mistakes traders make is confusing a sweep for a breakout. Liquidity sweeps are often mistaken for the beginning of a new trend leg, leading to premature entries that quickly get reversed.
Another pitfall is ignoring the broader market context. Liquidity sweeps are most reliable when they occur at logical levels aligned with higher time frame bias. Without that alignment, the sweep may simply be part of a choppy, indecisive range.
Lack of confirmation is also an issue. Entering trades immediately after a wick without seeing structure reclaim, volume shift, or candle confirmation can lead to unnecessary losses.
Confirming a Valid Sweep
To increase confidence in a sweep setup, traders should watch for several confirming behaviors. Volume often spikes during the sweep itself, followed by a drop in volatility as the market reverses. Divergences on momentum indicators like RSI or OBV can also support the idea of an exhausted move.
Most importantly, the reaction after the sweep matters more than the sweep itself. If price fails to reclaim the swept level or continues trending, the move was likely a true breakout, not a manipulation.
In high-probability sweeps, price often reclaims the level and begins forming structure in the opposite direction. Watching for breaker blocks, fair value gaps, or inefficiencies being respected in this phase can also strengthen the case for entry.
Conclusion
Liquidity sweeps are one of the clearest footprints left behind by smart money. While they can be deceptive in the moment, with enough practice and context awareness, they become one of the most powerful tools in a trader’s arsenal.
The key lies in understanding that these moves are engineered, not accidental. Recognizing where the market is likely hunting liquidity, and how it behaves after collecting it, can dramatically improve your ability to enter trades with precision, confidence, and clear invalidation.
__________________________________________
Thanks for your support!
If you found this guide helpful or learned something new, drop a like 👍 and leave a comment, I’d love to hear your thoughts! 🚀
Make sure to follow me for more price action insights, free indicators, and trading strategies. Let’s grow and trade smarter together! 📈

Mastering Candlestick Patterns - How to use them in trading!Introduction
Candlesticks are one of the most popular and widely used tools in technical analysis. They offer a visual representation of price movements within a specific time period, providing valuable insights into market trends, sentiment, and potential future price movements.
Understanding candlestick patterns is crucial for traders, as these formations can indicate whether a market is bullish or bearish, and can even signal potential reversals or continuations in price. While candlesticks can be powerful on their own, trading purely based on candlestick patterns can be challenging and risky.
-----------------------------------------------------------------------------------------------
What are we going to discuss:
1. What are candlesticks?
2. What are bullish candlestick patterns?
3. What are bearish candlestick patterns?
4. How to use candlestick patterns in trading?
-----------------------------------------------------------------------------------------------
1. What are candlesticks?
A candlestick in trading is a visual representation of price movement in a specific time period on a chart. It is a fundamental element used in technical analysis to study market trends, determine price levels, and predict potential future price movements. A single candlestick consists of four main components: the open, close, high, and low prices for that time period.
Here’s how a candlestick works:
- The Body: The rectangular area between the open and close prices. If the close is higher than the open, the body is green, indicating a bullish (upward) movement. If the close is lower than the open, the body is red, signaling a bearish (downward) movement.
- The Wick (high and low of the candle): The thin lines extending above and below the body. These represent the highest and lowest prices reached during the period. The upper wick shows the highest price, while the lower wick shows the lowest price.
- The Open Price: The price at which the asset began trading in that time period (for example, the start of a day, hour, or minute depending on the chart timeframe).
- The Close Price: The price at which the asset finished trading at the end of the period.
-----------------------------------------------------------------------------------------------
2. What are bullish candlestick patterns?
What is a Hammer Candlestick Pattern?
A hammer candlestick pattern has a small body near the top of the candle and a long lower wick, typically two to three times the length of the body. There is little to no upper wick. This formation shows that during the trading session, sellers managed to push the price significantly lower, continuing the downward momentum. However, buyers eventually stepped in with strong demand and drove the price back up near the opening level by the close.
What is an Inverted Hammer?
An inverted hammer has a small body near the bottom of the candle with a long upper wick, usually at least two to three times the size of the body, and little to no lower wick. This unique shape resembles an upside-down hammer, hence the name.
What is a Dragonfly Doji?
A dragonfly doji has a unique shape where the open, close, and high prices are all at or very close to the same level, forming a flat top with a long lower wick and little to no upper wick. This gives the candle the appearance of a "T," resembling a dragonfly.
What is a Bullish Engulfing?
A bullish engulfing candlestick consists of two candles. The first candle is bearish, indicating that sellers are still in control. The second candle is a large bullish candle that completely engulfs the body of the first one, meaning it opens below the previous close and closes above the previous open. This pattern reflects a clear shift in market sentiment. During the second candle, buyers step in with significant strength, overpowering the previous selling pressure and reversing the momentum. The fact that the bullish candle completely engulfs the previous bearish candle indicates that demand has taken over, signaling a potential trend reversal.
What is a Morning Star?
The morning star consists of three candles. The first is a long bearish candle, indicating that the downtrend is in full force, with strong selling pressure. The second candle is a small-bodied candle, which can be either bullish or bearish, representing indecision or a pause in the downtrend. Often, the second candle gaps down from the first, indicating that the selling pressure is subsiding but not yet fully reversed. The third candle is a long bullish candle that closes well above the midpoint of the first candle, confirming that buyers have taken control and signaling the potential start of an uptrend.
-----------------------------------------------------------------------------------------------
3. What are bearish candlestick patterns?
What is a Shooting Star?
A shooting star has a smal body near the low of the candle and a long upper wick, usually at least twice the size of the body, with little to no lower wick. This shape shows that buyers initially pushed the price higher during the session, continuing the upward momentum. However, by the close, sellers stepped in and drove the price back down near the opening level.
What is a Hanging Man?
A hanging man has a distinct shape, with a small body positioned near the top of the candle and a long lower wick, usually at least twice the length of the body. There is little to no upper wick. The appearance of this candle suggests that although there was strong selling pressure during the session, buyers managed to bring the price back up near the opening level by the close. Despite the recovery, the long lower wick shows that sellers were able to push the price down significantly at one point. This introduces uncertainty into the uptrend and can indicate that bullish momentum is weakening.
What is a Gravestone Doji?
A gravestone doji has a distinctive shape where the open, low, and close prices are all at or near the same level, forming a flat base. The upper wick is long and stretches upward. This shape resembles a gravestone, which is where the pattern gets its name.
What is a Bearish Engulfing?
A bearish engulfing candlestick pattern is a two-candle reversal pattern that typically appears at the end of an uptrend and signals a potential shift from bullish to bearish sentiment. The first candle is a smaller bullish candle, reflecting continued upward momentum. The second candle is a larger bearish candle that completely engulfs the body of the first one, meaning it opens higher than the previous close and closes lower than the previous open. This indicates that bears have taken control, overpowering the buyers, and suggests a potential downside movement.
What is an Evening Star?
An evening star is a bearish candlestick pattern that typically signals a potential reversal at the top of an uptrend. It consists of three candles and reflects a shift in momentum from buyers to sellers. The pattern starts with a strong bullish candle, showing continued buying pressure and confidence in the upward move. This is followed by a smaller-bodied candle, which can be bullish or bearish, and represents indecision or a slowdown in the uptrend. The middle candle often gaps up from the first candle, showing that buyers are still trying to push higher, but the momentum is starting to weaken. The third candle is a strong bearish candle that closes well into the body of the first bullish candle. This candle confirms that sellers have taken control and that a trend reversal could be underway. The more this third candle erases the gains of the first, the stronger the reversal signal becomes.
-----------------------------------------------------------------------------------------------
4. How to use candlestick patterns in trading?
Candlestick patterns are most useful when they appear at key levels, such as support, resistance, or significant trendlines. For instance, if a bullish reversal pattern like a hammer or bullish engulfing forms at a support level, it may indicate that the downtrend is losing momentum, and a reversal could be coming.
Trading based on candlestick patterns alone can be risky. To improve your chances of success, always seek additional confirmation from other technical analysis tools. Here are some common ones:
- Support and Resistance Levels: Look for candlestick patterns that form near key support or resistance levels. For instance, if the price reaches a support zone and a bullish reversal candlestick pattern forms, this may suggest a potential upward reversal.
- Fibonacci Retracement: Use Fibonacci levels to identify potential reversal zones. If a candlestick pattern appears near a key Fibonacci level (such as the Golden Pocket), it adds confirmation to the idea that the price may reverse.
- Liquidity Zones: These are areas where there is a high concentration of buy or sell orders. Candlestick patterns forming in high liquidity zones can indicate a stronger potential for a reversal or continuation.
- Indicators and Oscillators: Incorporating indicators like the Relative Strength Index (RSI), Moving Averages, MACD, or Stochastic RSI can help confirm the momentum of the price. For example, if a candlestick pattern forms and the RSI shows an oversold condition (below 30), this could indicate a potential reversal to the upside.
It’s crucial to wait for confirmation before entering a trade. After a candlestick pattern forms, it’s important to wait for the next candle or price action to confirm the signal. For example, if you spot a bullish reversal candlestick like a hammer at support, wait for the next candle to close above the hammer’s high to confirm that buyers are in control and a reversal is likely.
-----------------------------------------------------------------------------------------------
Thanks for your support.
- Make sure to follow me so you don't miss out on the next analysis!
- Drop a like and leave a comment!

unpublished Bitcoin navigator BTC update 21.04.2024
I just realized I posted a private chart yesterday.
I'll republish it so that the entire @TradingView community can see it
Click👇🏻
So, after deep analysis
Which, surprisingly, coincides with my previous publications.
I won't add them to this post.
The base case scenario is to reach BTCUSD 96-98
Why?
1. Need to reach the highest volume level of the year
In May, and with a high probability, a correction down to the level I have indicated with the yellow box
At least 4 out of 5 models point to this
The models are these transparent dotted lines that are barely visible.
And then ATH
Interesting Question, where is ATH?
I have shown on the chart a dashed line that tapers off the two previous peaks. I have seen many times how this line did not work and was broken by a big Liquidating candlestick up and down, so graphically, you can guess my conservative targets.
When writing this text, I wondered what could explain the fall in the price of Bitcoin after adding it to the reserve, other than speculation and liquidity gathering, and I have no other answers. But in this case, when they start releasing news about the Bitcoin reserve, they will buy it en masse, after this official announcement. Some time will pass, and a 20% drop, then most of the industry will be disappointed and start blaming Trump - he failed again, even with the Bitcoin reserve. So after that, we should quickly rise on this emotion.
Best regards EXCAVO

Bitcoin – Testing Major Resistance: 95k next target?Bitcoin is currently trading inside a significant resistance zone between $88,000 and $89,000. This area has acted as a strong supply zone in the past, evidenced by multiple rejections that led to notable sell-offs. The recent upward momentum that brought price back into this area was backed by a strong rally off the April lows, pushing through local structure and recovering critical levels. However, despite the strength of this move, price is now approaching a decision point where bulls need to prove continuation capacity or risk triggering another corrective leg.
Consolidation Structure
The current structure reflects a potential accumulation base forming below resistance, marked by a series of higher lows and a compression of volatility. This typically precedes a breakout, though it also heightens the risk of a sharp rejection should buyers fail to sustain pressure. The local trend remains bullish on the 4H timeframe, but the lack of follow-through above resistance so far suggests hesitation. Price is essentially coiling beneath a ceiling, building pressure for a breakout or breakdown move in the coming sessions.
Bullish Scenario
If Bitcoin is able to cleanly break above the $89,000 resistance level, the key confirmation will be a successful retest of this zone from above. This area, once flipped into support, would offer a strong launchpad for continuation toward the next key target at $95,000. This target aligns with the measured move projection from the recent range and also represents a psychological milestone that may attract momentum buyers. A confirmed breakout and retest would signal strength from bulls and invalidate the prior resistance structure, transitioning it into new support.
Bearish Scenario
Alternatively, if price fails to break above the resistance zone and prints another rejection, I expect a retracement to follow. The first major area of interest on the downside is the imbalance zone between approximately $84,000 and $85,500. This level also aligns with the 0.236 Fibonacci retracement, and given the inefficiency left behind from the recent rally, it serves as a logical short-term support area. A bounce here would not be surprising, particularly on the first touch. However, should price break below and close beneath this zone, it would indicate weakness and open the door for a deeper corrective move.
The next major downside target in that case would be the golden pocket between $79,500 and $80,500. This zone carries strong confluence: it’s formed by the 0.618–0.65 Fibonacci retracement, a previously unfilled price void (PVG), and the base of the recent rally. Price reaching this area would likely attract interest from both buyers looking for re-entry and shorts looking to cover. A reaction from this level could set the stage for a medium-term bounce or even a new accumulation phase.
Current Stance
At the moment, my stance is neutral-to-bullish while price remains within the resistance zone. I'm closely monitoring for a clean breakout and retest, which would trigger a long setup targeting the $95K area. Until that breakout occurs, caution is warranted due to the risk of rejection and retracement. If price breaks down from the current level, I will shift my focus to lower support zones, particularly the imbalance region and the golden pocket, for potential long opportunities or further confirmation of bearish momentum.
Conclusion
Bitcoin is at a pivotal point technically. The structure and momentum suggest the possibility of a bullish continuation, but confirmation through breakout and retest is essential. A failure to break and hold above resistance will likely initiate a retracement, with the imbalance zone serving as the first major test. If that zone fails, a trip toward the golden pocket at $80K becomes increasingly probable. This is a reactive zone-to-zone environment, and both breakout and breakdown scenarios offer actionable setups based on confirmation.
__________________________________________
Thanks for your support!
If you found this idea helpful or learned something new, drop a like 👍 and leave a comment, I’d love to hear your thoughts! 🚀
Make sure to follow me for more price action insights, free indicators, and trading strategies. Let’s grow and trade smarter together! 📈

Bitcoin - Who Will Take Control: Bulls or Bears?Bitcoin is currently exhibiting a prolonged phase of sideways movement, trading within a clearly defined consolidation range. After a sharp move to the upside earlier this month, price has stalled and started to range between the resistance zone near $86,000 and support around $82,000. This type of price action typically suggests indecision in the market, where neither buyers nor sellers are in full control.
The candles within this range are relatively choppy, with many wicks on both sides, further reinforcing the idea that this is a low-conviction environment. It reflects a battle between opposing market participants, and historically, such consolidations often precede strong directional moves. Until this range is broken, price is likely to continue moving sideways with potential for false breakouts and low-probability trade setups.
The Consolidation Range
The current consolidation is outlined with clear visual zones. The upper boundary acts as resistance and is highlighted in red, while the lower boundary, acting as support, is marked in green. The range itself is filled in blue, representing the broader area of indecision and price balance.
This consolidation is not minor—it has held for several days with multiple rejections from both the resistance and support levels. The more time price spends within a range like this, the more significant the breakout is likely to be. Liquidity builds up at the highs and lows of these ranges, and eventually one side will be taken out, leading to an expansion move.
Bullish Breakout Scenario
If Bitcoin manages to break and close decisively above the resistance zone, this would signal a potential shift in market sentiment toward the upside. A breakout above this level is likely to trigger stop-loss orders from short-sellers and attract breakout traders entering long positions.
The chart suggests that if this bullish breakout occurs, price will likely target the liquidity resting above recent swing highs, which are marked by the black horizontal lines. These levels represent areas where traders may have placed their stop orders, making them attractive targets for a price sweep. Following this, Bitcoin could enter a new trend phase, potentially setting up a continuation of the larger bullish structure that preceded the consolidation.
It is important, however, to wait for confirmation. A clean breakout followed by a retest or strong follow-through volume would provide greater confidence in a bullish continuation. Entering prematurely could result in being caught in a false breakout, especially in a ranging market like this.
Bearish Breakdown Scenario
Alternatively, if price breaks below the support zone with conviction, this would be a clear bearish signal. A move below the lower boundary of the range would imply that the buyers have been exhausted and that sellers have regained control.
In this scenario, the expectation is that price will seek out the inefficiencies and untested price action below, particularly the yellow zone marked on the chart. This area likely represents a previous gap or imbalance—zones where price moved rapidly in the past and did not spend much time. Such zones often act as magnets for price once a breakdown occurs, as the market seeks to fill in that inefficiency.
This bearish move could lead to a significant drop, potentially targeting levels as low as the upper $70,000s or even lower, depending on how strong the selling pressure becomes. Much like the bullish scenario, it's critical to watch for confirmation. A candle close below support with strong volume would be an ideal trigger for this bearish thesis.
No-Trade Zone and Strategy
Until Bitcoin breaks out of this range in either direction, there are no clear high-probability trades. Entering within the range is inherently risky due to the lack of momentum and high chance of reversals. Whipsawing price action can easily trigger stop-losses and create frustration for traders trying to anticipate moves before confirmation.
The most prudent approach in this situation is patience. Let the market show its hand. Once a breakout occurs, whether to the upside or downside, the path forward becomes more defined and trade setups with favorable risk-to-reward ratios will emerge. For now, this is a textbook no-trade zone—ideal for observing and planning, not for forcing entries.
Conclusion
Bitcoin is currently at a critical juncture. The ongoing consolidation is a precursor to a larger move, and while the direction is not yet confirmed, the zones of interest are clearly mapped out. A breakout above resistance will suggest a bullish continuation, targeting liquidity above recent highs. A breakdown below support will imply a bearish move toward the inefficiencies and untested price areas below.
In markets like this, discipline is key. The goal is to avoid getting chopped up in the range and instead position yourself on the right side once momentum returns. The next breakout will likely set the tone for the coming days or even weeks—so patience now could lead to greater reward later.
__________________________________________
Thanks for your support!
If you found this idea helpful or learned something new, drop a like 👍 and leave a comment, I’d love to hear your thoughts! 🚀
Make sure to follow me for more price action insights, free indicators, and trading strategies. Let’s grow and trade smarter together! 📈

Which altcoins hold the potential to conquer the crypto market?Have you ever heard of ISO 20022?
Do you know what this standard is all about?
Which tokens have adopted or are compliant with this standard?
ISO 20022 is an international standard for the exchange of financial data between financial institutions, banks, corporations, and other entities. Developed by the International Organization for Standardization (ISO), its purpose is to provide a universal language for financial messaging on a global scale.
Hello✌
Spend 3 minutes ⏰ reading this educational material. The main points are summarized in 3 clear lines at the end 📋 This will help you level up your understanding of the market 📊 and Bitcoin💰.
🎯 Analytical Insight on Bitcoin: A Personal Perspective:
Bitcoin is currently near a strong trendline and a solid daily support level. I’m expecting it to break the $90,000 mark, a key psychological level, within the next few days. My main target is at least a 7% increase, reaching $90,500.
📈
Now , let's dive into the educational section, which builds upon last week's lesson (linked in the tags of this analysis). Many of you have been eagerly waiting for this, as I have received multiple messages about it on Telegram.
🔍 What Is ISO 20022 and Why Should Traders Care?
Have you come across ISO 20022 and wondered what it really means in the world of finance and crypto? It’s not just a technical standard—it could be a major bridge between traditional finance and blockchain-based assets.
🌐 A Global Standard for Financial Messaging
ISO 20022 is an international protocol developed by the International Organization for Standardization. It defines a universal language for exchanging financial data between institutions—banks, governments, payment networks, and corporations.
💡 Key Features of ISO 20022
• Uses XML-based message formatting—both machine and human-readable
• Covers multiple financial areas: payments, securities, trade, treasury, and cards
• Highly flexible and extendable to future innovations
• Designed to reduce processing errors and boost interoperability worldwide
📈 Why It’s Becoming a Big Deal
With increasing digitization, the global financial system is shifting toward unified communication standards. Major infrastructures like SWIFT are already migrating to ISO 20022 to future-proof their operations.
🪙 The Crypto Connection
Some cryptocurrencies have been developed to align with ISO 20022 standards. This means they have the potential to integrate directly into regulated financial systems—making them more likely to be adopted by banks and governments.
✅ ISO 20022-Compliant Cryptocurrencies (As of 2024)
• XRP (Ripple)
• XLM (Stellar)
• XDC (XinFin)
• IOTA
• ALGO (Algorand)
• QNT (Quant)
• HBAR (Hedera Hashgraph)
🤝 Why Compliance Matters
If traditional finance fully adopts ISO 20022, only tokens that meet its criteria will likely be considered for official integration. This could have huge implications for utility, regulation, and long-term value.
🧠 Strategic Insight for Investors
Incorporating ISO 20022-compliant assets into your portfolio isn’t just about trends—it’s about positioning yourself for future financial system evolution. These tokens may play a key role in bridging the gap between DeFi and TradFi.
However , this analysis should be seen as a personal viewpoint, not as financial advice ⚠️. The crypto market carries high risks 📉, so always conduct your own research before making investment decisions. That being said, please take note of the disclaimer section at the bottom of each post for further details 📜✅.
🧨 Our team's main opinion is: 🧨
ISO 20022 is a global financial messaging standard designed to streamline data exchange between banks and institutions. It's becoming crucial as traditional systems like SWIFT adopt it for greater efficiency. Several cryptocurrencies, including XRP, XLM, and ALGO, are ISO 20022-compliant, positioning them for future integration with mainstream financial systems. This compliance could lead to wider adoption by banks and governments, making them more valuable long-term. 🚀
Give me some energy !!
✨We invest countless hours researching opportunities and crafting valuable ideas. Your support means the world to us! If you have any questions, feel free to drop them in the comment box.
Cheers, Mad Whale. 🐋

Top Altcoins Choice —Your Pick (Session 3—2025)When Bitcoin grows, the Altcoins grow. It is easy to know when the Altcoins will be growing if Bitcoin is moving up with momentum, but what happens when Bitcoin isn't doing anything, just sideways?
When the Altcoins grow, Bitcoin grows. It is easy to know what will happen to Bitcoin by tracking the Altcoins market. Right now, many Altcoins are breaking bullish three digits green on the day. This is the first time since August and November 2024, before a major bullish impulse. This type of action reveals that the Altcoins market is set to grow.
» When the Altcoins grow, Bitcoin grows. The Altcoins are starting to grow now, which means that Bitcoin will do the same. This is now confirmed.
Top Altcoins Choice —Your Pick (Session 3)
The market is turning bullish and this is no longer my speculative opinion, this is now a confirmed fact. You can always go to any Cryptocurrency exchange and look at the list of trading pairs, sort the listing to show the top earners first and you have your proof. Whenever there are many pairs, true projects not scam coins, growing 2-3 digits green, that means that the market is bullish.
See for yourself and tell me what you see. Knowing this, let me do an analysis for you, which one is your favorite Altcoin pair? What is your TOP Choice? Which Altcoin will you pick?
Leave a comment with the trading pair you want me to look at. Make sure to add some questions; What would you like to know about the project in question and the chart? What is your trading strategy? Are you trading short-term or long-term? Are you a reporter, a writer, a reader or a trader?
Are you serious about Crypto or just passing by?
How long have you been in this market?
Have you been successful before?
Do you use mindfulness for trading?
Do you process stress through exercise, eating, fasting, drugs or meditation?
What method do you use to handle the stress that comes from engaging the market?
What are your goals?
Share some information together with your pair so that I can do a personalized analysis based on what you want.
I will respond your comment with a published analysis or an analysis on the comment reply. One condition though, the trading pair must be available on this TradingView platform with at least 6 months of data for the analysis to be viable.
Let's find some great Altcoins. The BTC pairs are in a great situation right now and great prices are still possible but not for long.
The time is now, which one will be Your Top Altcoin Choice?
See you in the comments section below.
Thanks a lot for your continued support.
Namaste.

Bitcoin Bearish Or Bullish 100K Comment —Scientific StudyDo you see bearish or bullish write a comment... Just do it!
How long is it going to take you? 1 minute.
Ok, what do you see?
The chart as it is now, do you see it bearish or bullish?
Leave a comment tell me what you see... Go ahead. If 100 people leave a comment we can make an independent study. A scientific study, will you participate yes?
Will Bitcoin move above $100,000 this same week?
Go ahead, write a comment what do you think? Bullish or bearish; will Bitcoin move above 100K?
I will not reveal my bias until the end.
The levels are mapped on the chart. Weak support, main support, strong support and untouched support.
» The 0.618 is the strong support level that remains untouched.
» The 0.5 is the main support.
» The 0.382 is weak support, it was pierced.
— The weak support was pierced but Bitcoin recovered above this level so it is no longer weak.
— The main support was challenged twice and it holds.
— The strong support is far away and it remains untouched.
Bottom, Bitcoin's price is trading high in relation to all-time history; Bitcoin's technicals are really strong. Bitcoin's fundamentals are also strong.
Bitcoin will continue growing but will it move above $100,000 this week leave a comment what do you think?
It is an experiment so you have to participate.
If this one time, one time only how long have you been reading forever do it now if it is ok, one minute won't do harm it can be great scientific experiment will you participate?
Are you willing yes?
I think Bitcoin can move above 100K but this is not certain nothing is. It is 100% certain that 2025 will be a strong year and the entire Cryptocurrency market will turn green.
So, there is nothing certain? How are you certain that everything will grow?
Leave a comment-thanks a lot for your continued support.
Namaste.

Bitcoin - Trap the Breakouts, Ride the PullbackBitcoin has been trading in a clearly impulsive structure, showing bullish intent after reclaiming previous consolidation zones. Recently, price action has driven into a significant area of interest, approaching the highs set on the 4-hour timeframe. These highs have not yet been swept, making them a likely target for liquidity grabs. Given the market's recent strength, it's reasonable to anticipate that market makers and larger participants may aim to run these stops to fuel a deeper retracement or set the stage for further upside.
The higher timeframes continue to favor bullish structure overall, with price making higher highs and higher lows. However, within this bullish context, the market has left behind notable inefficiencies, particularly an untapped imbalance zone just below current price levels. These inefficiencies typically act as magnets, especially when preceded by strong directional moves, making them key zones of interest for potential pullbacks.
Consolidation Structure and Key Zones
After bottoming out near the $77,000 to $78,000 area in early April, Bitcoin has steadily climbed, forming intermediate accumulation structures and minor consolidations before each breakout leg. During the recent surge, price left behind a unified imbalance zone roughly between $89,000 and $91,000, which remains untouched. This area is highly relevant, as price has not yet returned to rebalance it.
Just below that sits a previous strong support zone in the $82,000 to $84,000 region, which provided a solid base for the current leg higher. An additional lower imbalance zone lies slightly above $80,000, offering a potential secondary demand area in case the primary zone fails.
Liquidity and Imbalance Zone
The current expectation is for Bitcoin to complete a sweep of the 4H swing high, tapping into the resting buy stops above. These types of moves often serve as traps for breakout buyers, allowing institutions to offload positions into demand and prepare for a retracement. Once the liquidity is taken, the next logical move would be a return toward the unfilled imbalance zone highlighted on the chart.
This zone not only represents technical inefficiency, but also aligns with the concept of fair value. Price often returns to these areas to find willing buyers, rebalance supply-demand discrepancies, and establish a base before continuing in the prevailing direction. Given the strength of the previous rally, a healthy retracement into this zone would still maintain overall bullish market structure.
Bullish Scenario
If the price sweeps the high and retraces into the $89,000 to $91,000 zone, we want to see signs of absorption and bullish structure forming within this region. Confirmation may come in the form of bullish order blocks, internal BOS (break of structure), or a clear rejection wick indicating buyers are stepping in. Should these conditions be met, this zone provides a compelling long opportunity, with upside targets set toward previous highs and potential extension levels above $96,000.
Bearish Contingency Plan
In the event that the unified imbalance fails to hold, attention shifts to the next key zones. The first is the minor imbalance closer to $85,000, which could offer a short-term bounce. Failing that, the broader support zone at $83,000 highlighted on the chart, becomes a more significant area to watch. This zone previously acted as the springboard for the current rally and may provide the structural support necessary for a larger bullish continuation.
Conclusion
This setup reflects a classic smart money concept, liquidity engineering followed by a return to inefficiency. The trade idea rests on the premise that markets rarely move in a straight line and often seek to rebalance themselves after aggressive trends. By allowing price to sweep the highs, fill the imbalance, and re-establish support, we can position ourselves with the trend in a favorable risk-reward context. The bias remains bullish, but execution depends on price reaction at key levels and confirmation of intent.
__________________________________________
Thanks for your support!
If you found this idea helpful or learned something new, drop a like 👍 and leave a comment, I’d love to hear your thoughts! 🚀
Make sure to follow me for more price action insights, free indicators, and trading strategies. Let’s grow and trade smarter together! 📈

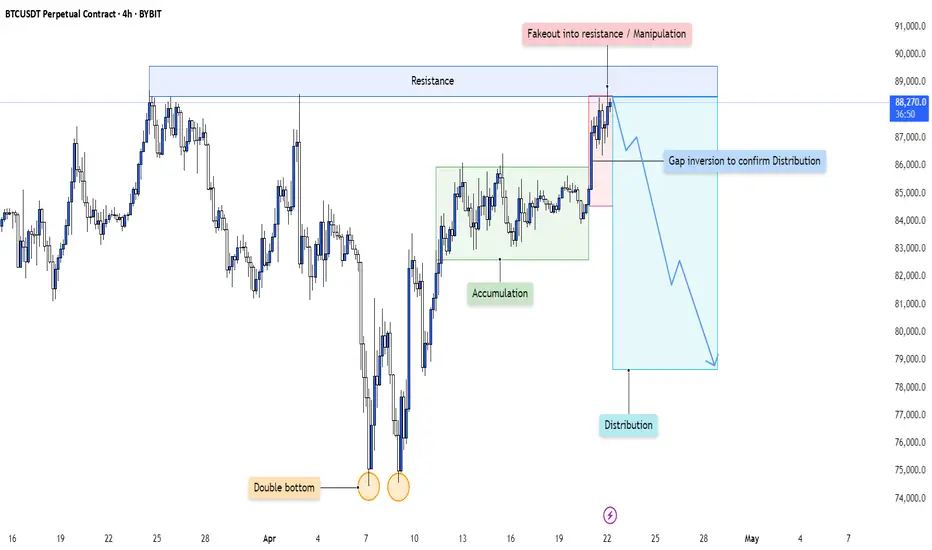
BTC - Distribution Confirmed After Accumulation Cycle CompletionThis 4H chart is a textbook illustration of how smart money cycles play out over time—starting with accumulation, leading into a sharp markup, and culminating in a deceptive distribution phase characterized by manipulation and false breakouts.
Let’s dissect each stage of this engineered move:
---
1. Accumulation Phase Following a Double Bottom
At the left of the chart, price forms a clear double bottom —a classic retail reversal signal.
- Smart money likely used this area to absorb sell-side liquidity, building long positions while retail traders expected further downside.
- This base formation set the foundation for the upcoming accumulation range , marked by sideways price action and multiple rejections from both highs and lows of the range.
The purpose of accumulation is simple: transfer supply from weak hands to strong hands. Every dip in this range allowed large players to fill bids without driving price too aggressively.
---
2. Sharp Markup and Resistance Interaction
Once positions were fully loaded, price launched into a strong impulsive move upward , confirming the transition from accumulation to markup.
- The move stalled at a clear horizontal resistance zone—marked as an area of prior supply and potential seller re-engagement.
- Price consolidated just below this resistance, building tension and liquidity in the form of breakout longs and stop orders from early shorts.
This led to the final stage of the cycle: distribution via manipulation.
---
3. Manipulation Above Resistance: The Fakeout
What followed was a classic fakeout above resistance .
- Price briefly broke above the key resistance area, attracting breakout buyers who assumed the trend would continue.
- In reality, this move served as a liquidity sweep and exit trap , allowing institutions to offload long positions accumulated earlier.
- The immediate rejection from this fakeout confirms a bull trap —a hallmark of distribution.
This is where smart money transitions from buyers to sellers while retail is left holding the bag.
---
4. Gap Inversion: Confirmation of Distribution
Post-fakeout, price creates a gap and immediately inverts back into the prior range , invalidating the breakout and forming a clear distribution schematic .
- The gap acts as a volume void or inefficiency , often revisited in reversal models.
- Once this area is rejected and price fails to reclaim the resistance zone, it becomes clear that distribution has been finalized.
- This breakdown marks the beginning of a markdown phase—typically faster and more violent than the markup.
The rejection confirms that price is now being delivered to the downside.
---
5. Narrative: From Accumulation to Redistribution and Collapse
This setup isn’t random—it’s narrative-driven:
- Double Bottom → Accumulation → Breakout → Manipulation → Distribution → Reversal
Each phase builds on the previous one, guided by smart money's intent to trap liquidity and maximize profit during transitions.
Now that distribution is confirmed, the expectation is continued downward delivery as price seeks out untapped liquidity and rebalances imbalances left behind during the markup.
---
Conclusion:
This 4H structure is a clear representation of the Wyckoff distribution model in action:
- Accumulation fuels markup.
- Breakout entices buyers.
- Manipulation traps them.
- Distribution unloads supply.
- Reversal completes the cycle.
The move down is not a random pullback—it is the deliberate continuation of a planned liquidity cycle . Expect further downside unless this structure is invalidated with a reclaim and break of the prior fakeout zone.
BTC Pumped Hard – Is It Time for a Pullback to Fill CME GAP!?Bitcoin ( BINANCE:BTCUSDT ) started pumping after the pullback, as I expected in my previous post , I hope you were able to take profits.
Bitcoin is trading in the upper areas of the Heavy Resistance zone ($95,000-$88,500) , near the Resistance lines and the upper line of the ascending channel .
Also, we can see the Regular Divergence(RD-) between Consecutive Peaks .
From the Elliott Wave theory perspective , it seems that Bitcoin has completed the main wave 3 and we can expect the completion of the main wave 4 today .
I expect Bitcoin to correct in the next few hours and drop to the targets I have specified on the chart and fill the CME Gap($93,465-$91,415) .
Cumulative Short Liquidation Leverage: $95,700-$94,542
Cumulative Long Liquidation Leverage: $92,666-$91,415
Cumulative Long Liquidation Leverage: $90,276-$89,160
Note: If Bitcoin can break the upper line of the ascending channel, we should wait for the next pump.
Please respect each other's ideas and express them politely if you agree or disagree.
Bitcoin Analyze (BTCUSDT), 1-hour time frame.
Be sure to follow the updated ideas.
Do not forget to put a Stop loss for your positions (For every position you want to open).
Please follow your strategy and updates; this is just my Idea, and I will gladly see your ideas in this post.
Please do not forget the ✅' like '✅ button 🙏😊 & Share it with your friends; thanks, and Trade safe.

TradeCityPro | Bitcoin Daily Analysis #67👋 Welcome to TradeCity Pro!
Let’s move on to the analysis of Bitcoin and key crypto indicators. In this analysis, as usual, I want to review the New York futures session triggers for you.
✔️ Yesterday, the price was rejected from the 85,550 area, and today could be a sensitive and important day for the market.
⏳ 1-Hour Timeframe
In the 1-hour timeframe, I mentioned yesterday that the 85,126 trigger had been activated and if the price pulled back to this area and broke above 85,550, we could witness a bullish move and the start of an upward wave. But that didn’t happen—the price was rejected from the 85,550 high and started moving downward.
👀 Currently, with the price stabilizing below the 85,126 area, selling volume has entered the market, and the price is moving down. The last candle closed below the 84,363 area, and the RSI has entered the oversold zone. If the move continues, the price could experience a bearish leg and move down to 83,233.
🔽 In that case, a break below the 83,233 area could be a good short position trigger, as it would give us confirmation of a trend reversal. But if the move doesn’t continue, this level could turn out to be a fake-out, and the price might head back toward the 85,550 high.
🎲 So today, you can enter a short position with a break of 83,233, and a long position with a break of 85,550. Pay attention to volume and RSI, as they can provide many confirmations for the next price trend.
👑 BTC.D Analysis
Let’s look at Bitcoin dominance. Yesterday, dominance dropped another leg and broke the 63.76 low, but now it has returned to this area and is stabilizing above it.
📈 For a bullish confirmation, dominance needs to stabilize above the 64.12 area, and for a bearish one, it needs to stabilize below 63.12.
📅 Total2 Analysis
Now for the Total2 analysis. This index was rejected from the 965 area yesterday and is now stabilizing below 954. If the bearish momentum continues, the next support level that could hold the price is 932.
🔼 To turn bullish, a break above 965 is required, with the main trigger being 980.
📅 USDT.D Analysis
Let’s look at Tether dominance. Yesterday, it made an upward move and was supported at the 5.44 level. It has now reached 5.52.
✨ If 5.52 is broken, we’ll have confirmation of a bullish trend in dominance. If 5.44 is broken instead, we could anticipate a bearish move and potentially a break of 5.39.
❌ Disclaimer ❌
Trading futures is highly risky and dangerous. If you're not an expert, these triggers may not be suitable for you. You should first learn risk and capital management. You can also use the educational content from this channel.
Finally, these triggers reflect my personal opinions on price action, and the market may move completely against this analysis. So, do your own research before opening any position.

BTC - Halving Cycle | Historical Patterns & 2025-2026 Projection
In this chart, we dive deep into the cyclical nature of Bitcoin price action post-halving and draw parallels between past and current movements, with a specific focus on how the market has historically reacted at various intervals following each halving event. This analysis incorporates both structural and temporal elements, providing a potential roadmap based on previous behavior.
---
Historical Context: Previous Cycles
3rd Halving – May 11, 2020
Following the 3rd Bitcoin halving, we observed a parabolic run-up over the next several months:
- 11 months after halving (April 2021): BTC reached a major peak, hitting nearly $65,000.
- This was followed by a significant correction.
- 19 months after halving (December 2021): Bitcoin printed a second top close to the previous all-time high, forming a classic double top pattern. This structure often signals market exhaustion and precedes deeper corrections.
Cycle Completion – Price Reversion
By 30 months after the 3rd halving (around November 2022), BTC had retraced much of its gains and returned to prices nearly equivalent to the halving level (~$8,000–$10,000 zone in log-adjusted terms). This marked the end of the cycle, confirming a full reversion to the mean after the double-top distribution phase.
---
Current Cycle: 4th Halving – April 19, 2024
We're now entering the 4th post-halving cycle , and so far, the structure appears to be rhyming closely with the previous cycle :
- Pre-halving rally took BTC to ~ FWB:73K (March 2024), indicating strong bullish momentum leading into the event.
- If this cycle follows a similar path, we may expect:
- A first major top around 9 months after the halving , potentially at or above $100K.
- A second top forming around 17 months after the halving (projected for September 2025), possibly signaling the beginning of a broader correction phase.
---
Projection: October 2026 (30 Months After Halving)
Using the same temporal framework:
- By October 2026 (30 months post-halving), the chart suggests a return to a much lower level , possibly around $50K.
- This projection mimics the post-double-top decline of the previous cycle, reinforcing the idea of cyclical mean reversion .
- It’s important to note: this isn’t necessarily bearish, but it highlights the cyclical and psychological nature of markets —boom, euphoria, distribution, and reversion.
---
The Macro View: Halving Cycles Are Rhythmic
- Every halving has historically set off a new bull run, but the timing of tops and bottoms is shockingly consistent :
- Peaks often occur 9–18 months post-halving .
- Full cycle completion is around 30 months post-halving.
- These cycles are heavily influenced by supply shocks , market psychology , and macro liquidity cycles .
---
Final Thoughts
This chart isn’t a guarantee—it’s a probability model based on cyclical symmetry. If history repeats or rhymes, we may be witnessing another textbook cycle play out, where a euphoric run in 2025 gives way to a deep correction by late 2026.
Stay alert for the double top pattern and macro divergences. Just as in 2021, timing the exit after the first peak can be the difference between profit and pain .
What do you think? Will Bitcoin follow the same 30-month post-halving trajectory?

Bitcoin Forming Head & Shoulders – Watch for a Fake-OutPattern Formation: A complex Head and Shoulders structure is forming:
Left Shoulder ✅
Double Head ✅
Right Shoulder forming 🔄
Resistance Zone: The price is currently near a strong resistance area (around $87,000–$88,000).
This zone is likely to act as a ceiling and reject the price.
Expected Move (Blue Arrows):
shows a possible fake breakout above the resistance.
Then, a strong drop is expected, targeting:
First support near $78,000

Bitcoin can make small correction and then continue to growHello traders, I want share with you my opinion about Bitcoin. Earlier, the price of price was consolidating for quite some time inside a broad upward wedge. The market found consistent support near the buyer zone, forming a solid foundation for future growth. After several rebounds, the bulls pushed BTC higher, and the pair exited the support area with a clean breakout. The movement above the current 86000 support level was accompanied by a strong bullish impulse, confirming the breakout from the wedge and validating the upward momentum. The price respected the structure of the wedge well, reacting to both the resistance and support lines along the way. After the breakout, Bitcoin reached a new high near 94000, where it turned around slightly, indicating the beginning of a local correction. Now BTC is hovering just above the broken wedge, and I believe a short-term decline, likely before continuing further upward. Given the wedge's structure, the bounce from the buyer zone, and the breakout with confirmation, I remain bullish on Bitcoin. My TP1 remains at 97000 points, which corresponds to the next key resistance above the current price range. Please share this idea with your friends and click Boost 🚀

BTC Next Move - Bulltrap or Take-off?In todays overview, we will discuss the price action of BTC and what we could expect in the short-term.
What will we discuss?
- Bitcoin approaching key resistance
- Daily trendline break - But no higher high yet
- Stochastic RSI overbought on the daily timeframe
- Defining the daily range
- Downside targets within the range
- Final thoughts
-----------------------------------------------------------------------------------------------
Bitcoin Approaching Key Resistance
Bitcoin is now pressing up against a significant resistance zone in the $88,000 to $89,000 range. This area is dense with liquidity, and many stop-loss orders have likely accumulated just above the previous local wick. It's not uncommon in these scenarios for price action to briefly push higher, grabbing that liquidity and triggering those stops, before reversing direction. A short-term stop run followed by a move to the downside wouldn’t be surprising and would align with typical market behavior in these conditions.
-----------------------------------------------------------------------------------------------
Daily Trendline Break – But No Higher High Yet
On the daily chart, BTC has managed to break above a descending trendline that had previously capped price action. While that initial breakout was a promising sign for bulls, price has since been consolidating outside the trendline without yet printing a higher high. Until that happens, the overall market structure remains bearish on this timeframe. A confirmed higher high would be needed to shift the daily trend back to bullish.
-----------------------------------------------------------------------------------------------
Stochastic RSI Overbought on Daily Timeframe
The Stochastic RSI on the daily chart has been in overbought territory for more than a week, which is typically unsustainable for long periods. This kind of prolonged overbought reading often precedes a pullback. The key question is not if a correction will happen, but how deep it will go. Ideally for bulls, a minor pullback followed by a higher high would be constructive and could signal the beginning of a stronger upward move. But until then, caution is warranted.
-----------------------------------------------------------------------------------------------
Defining the Daily Range
Currently, Bitcoin is trading within a well-defined range between $75,000 and $88,000. This is the key zone that traders should be paying attention to. As long as price remains within this bracket, we are in a ranging market, not a trending one.
-----------------------------------------------------------------------------------------------
Downside Targets Within the Range
If price does get rejected at the resistance zone, downside targets to watch include support levels at $84,000, $80,000, and $75,000. These levels could provide bounce opportunities within the range. There’s no need to speculate on price moving significantly below $75,000 unless that level is cleanly broken. Similarly, upside targets beyond $89,000 shouldn’t be considered until we see a proper breakout and continuation.
-----------------------------------------------------------------------------------------------
Final Thoughts
We should treat the current market as range-bound until proven otherwise. That means respecting the range: moves into resistance zones near FWB:88K – GETTEX:89K are potential selling opportunities, while dips into support around $75K–$80K may be areas to look for buying setups. Until either support or resistance gives way, expect this chop to continue, and trade accordingly.
-----------------------------------------------------------------------------------------------
Thanks for your support.
- Make sure to follow me so you don't miss out on the next analysis!
- Drop a like and leave a comment!

BTC - Is there anything that can stop this bullrun?The current 4H structure presents a high-probability scenario centered around a classic liquidity sweep into premium levels, followed by potential downside rebalancing into inefficiencies. This is a clear case of price reaching for external liquidity before internal structure takes over.
---
1. Liquidity Run Above BSLs
Price has aggressively pushed upward, sweeping multiple Buy Side Liquidity (BSL) levels. These levels mark resting stop orders and breakout entries positioned by retail above recent swing highs.
- The impulsive move to the upside isn't a sign of strength—it's a strategic run for liquidity.
- These liquidity pools provide exit opportunities for large players offloading long positions initiated earlier in the structure.
- The sweep aligns with typical behavior just before price reacts to higher timeframe supply or premium Fibonacci zones.
---
2. Golden Pocket Confluence Zone (Downtrend Bias)
The orange highlighted zone represents the Golden Pocket —the 61.8%-to-65% retracement zone often associated with downtrend continuation or reversal setups.
- This level acts as a magnet in trending conditions, often leading to strong rejections.
- As price enters this pocket, the probability of a reaction increases, especially following a liquidity grab.
- The structure suggests this move is designed not for continuation, but for setting up a reversal.
The projected swing failure pattern at this level implies a shift from bullish euphoria to short-term distribution.
---
3. Internal Structure: Fair Value Gaps as Rebalance Zones
Two Fair Value Gaps (FVGs) are marked as zones of inefficiency, where price moved too aggressively to maintain balance between buyers and sellers.
- FVGs represent internal liquidity voids and serve as high-probability magnets for retracement.
- The first FVG lies just below the current price, suggesting a short-term retracement target.
- The second, deeper FVG offers a more substantial downside target and is aligned with typical rebalancing behavior after aggressive markups.
As price begins to break structure to the downside, these gaps become the logical destinations.
---
4. Probable Flow: Liquidity Sweep → Rejection → Internal FVG Fill
The anticipated flow is strategic and sequential:
- Step 1: Sweep of BSL and deviation into the Golden Pocket
- Step 2: Quick rejection, potentially forming a lower high
- Step 3: Downside expansion targeting both FVGs for liquidity rebalancing
This is not about chasing price—it’s about understanding the intent behind the move : create imbalance, sweep liquidity, then deliver price into inefficiency.
---
Conclusion:
This 4H chart outlines a mechanically driven move:
- External liquidity (BSL) tapped
- Premium level tested (Golden Pocket)
- Internal inefficiencies below acting as draw
The structure points to a transitional phase from premium to discount, with the FVGs below acting as clear objectives. Until those inefficiencies are fully addressed, the upside narrative remains reactive, not impulsive.

BTC Breaks Key Resistance –Pullback Your Last Chance to Enter!?To start today's analysis, it's best to look at the Bitcoin ( BINANCE:BTCUSDT ) analysis I shared with you on April 10 , which can give us good insight and has performed well so far .👇
Bitcoin seems to have finally managed to break through Important Resistance lines as well as the Resistance zone ($86,500-$85,150) . The break volume is also high and could be a good sign for the continuation of the upward trend .
According to Elliott Wave theory , with the breaking of important resistance lines , we should wait for the next 5 impulsive waves , which I will try to analyze step by step in this idea and future ideas.
I expect Bitcoin to attack the Heavy Resistance zone ($95,000-$88,500) for the first time after the pullback to the broken Resistance zone ($86,500-$85,150) (it is better to enter a long position on the pullback ). Basically, assets can NOT break such heavy zones for the first time . ( With very good news, it may break for the first time ).
Cumulative Long Liquidation Leverage: $86,022-$85,539
Cumulative Short Liquidation Leverage: $89,340-$88,000 = Important
Do you think the main uptrend has resumed or will Bitcoin correct again?
Note: The pullback is likely to start from the third point of contact with the Resistance lines.
Note: If Bitcoin falls below $85,100, it seems we should expect further declines.
Please respect each other's ideas and express them politely if you agree or disagree.
Bitcoin Analyze (BTCUSDT), 1-hour time frame.
Be sure to follow the updated ideas.
Do not forget to put a Stop loss for your positions (For every position you want to open).
Please follow your strategy and updates; this is just my Idea, and I will gladly see your ideas in this post.
Please do not forget the ✅' like '✅ button 🙏😊 & Share it with your friends; thanks, and Trade safe.

HelenP. I Bitcoin may drop from resistance zone to $84K pointsHi folks today I'm prepared for you Bitcoin analytics. After spending several days consolidating below the resistance area, Bitcoin finally pushed higher and retested the 87500 level. This resistance was already confirmed multiple times in the past, and now it aligns perfectly with the upper boundary of the resistance zone at 88200 - 87500. The price made a sharp rally toward that level after bouncing from the support zone at 81200 - 80500, where bulls managed to defend the trend line. Currently, BTC is trading just under the resistance zone, showing early signs of rejection and slowing momentum. The price structure still respects the trend line from below, but the positioning beneath resistance, combined with the triangle formation, suggests potential exhaustion at the top. Given the repeated tests of resistance and the overall pattern, I expect BTC to decline from this level and move down, breaking the trend line and exiting the triangle pattern. For this case, I set my goal at the 84000 points. If you like my analytics you may support me with your like/comment ❤️

Market Structure Shift (MSS) & Break of Structure (BOS) - GuideIntroduction
Understanding market structure is fundamental to becoming a consistently profitable trader. Two key concepts that Smart Money traders rely on are the Break of Structure (BOS) and the Market Structure Shift (MSS) . While they may seem similar at first glance, they serve different purposes and signal different market intentions.
In this guide, we will break down:
- The difference between BOS and MSS
- When and why they occur
- How to identify them on your charts
- How to trade based on these structures
- Real chart examples for visual clarity
---
Break of Structure (BOS)
A Break of Structure is a continuation signal. It confirms that the current trend remains intact. BOS typically occurs when price breaks a recent swing high or low in the direction of the existing trend .
Key Characteristics:
- Happens with the trend
- Confirms continuation
- Can be used to trail stops or add to positions
Example:
In an uptrend:
- Higher High (HH) and Higher Low (HL) form
- Price breaks above the last HH → BOS to the upside
---
Market Structure Shift (MSS)
Market Structure Shift signals a potential reversal . It occurs when price breaks a significant swing level against the prevailing trend and is often followed by a shift in the internal structure (e.g., lower highs after higher highs).
Key Characteristics:
- Happens against the trend]
- Signals possible trend reversal
- Often occurs after a liquidity grab or stop hunt
- Optional: is created by a displacement candle
Example:
In an uptrend:
- Price takes out a significant high (liquidity grab)
- Then aggressively breaks the most recent HL → MSS to the downside
---
How to Identify BOS and MSS
For BOS:
1. Determine the current trend.
2. Identify swing highs/lows.
3. Look for price breaking past these levels in the same direction as the trend .
For MSS:
1. Look for signs of exhaustion or liquidity grabs near swing highs/lows.
2. Watch for price to break against the trend structure .
3. Confirm with a shift in internal structure (e.g., lower highs start forming in an uptrend).
---
Using BOS and MSS in Your Trading Strategy
With BOS:
- Use it to confirm trend continuation
- Add to your position after a retracement into an OB or FVG
- Trail your stop-loss below the most recent HL or above LH
With MSS:
- Look for confluence (liquidity sweep + MSS = strong signal)
- Use it to spot early reversal entries
- Wait for a confirmation candle or structure shift on LTF (1m, 5m, 15m)
- If the displacement candle is too big you can wait for the retest
---
Common Mistakes to Avoid
- Confusing BOS with MSS
- Ignoring higher timeframe context
- Trading MSS too early without confirmation
- Chasing BOS without waiting for a proper retracement
Pro Tip: Use BOS/MSS with confluences like SMT Divergence, IFVGs, or key session times for higher probability setups.
---
Final Thoughts
Mastering BOS and MSS will give you an edge in understanding price delivery and anticipating market moves. BOS confirms strength in the current trend, while MSS warns of a possible reversal and new trend forming. Combine these with smart money tools, and you’ll be equipped to enter the market like a pro.
Happy Trading!
