BTSUSD going down (Line drawing for amusement only)I see BTS going down, This is my unexperienced line drawings. 4hr down triangle, ema trends down, sell volume up, Price down (Except thse that bought in the .5-.1 range)
News: G20 summit wil disscuss regulation on crypto
Opinion : Govt intervention still not over on crypto
Conclusion: BTS going down.
BTSBTC trade ideas

One more downBTS has failed consistently to bounce even with strong support. It is breaking down the 1.618 Fib and by looking into history it's going down a lot. Targets on 0.786 Fibonacci and 1.0

Bitshares BTS BTC DOUBLE BOTTOM REVERSAL & Bearish formation!Past week we've passed below a few key support levels, but a clear double bottom has formed and I believe the downtrend has completed. We should be seeing 5 impulse waves forming shortly & aggressive bearish moves in the coming days-weeks. Definitely don't buy this ;)

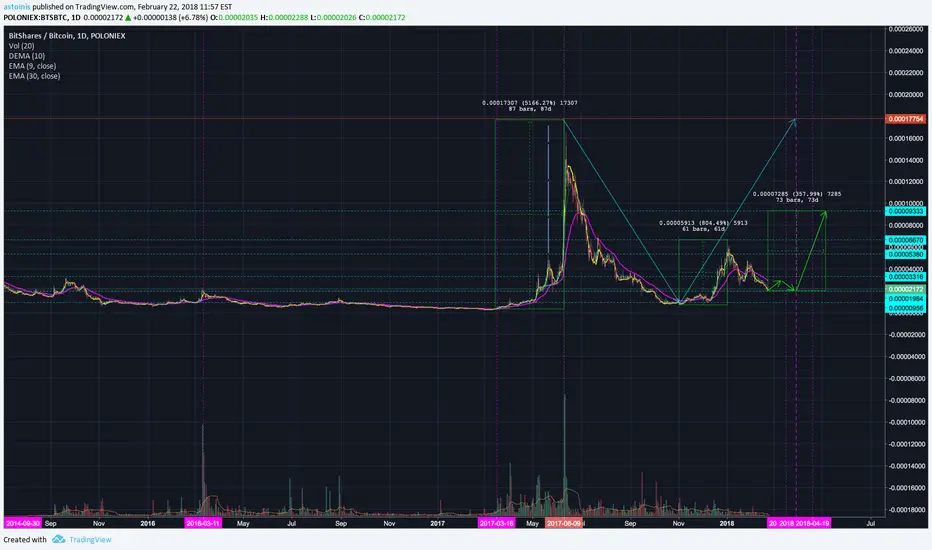
NOW WHAT?If price rises and breaks above the dashed green line, we are in for some easy money . If it goes below the red line... expect a sell off for a while. Chao.
- This is for educational purpose only -
- The Professional Amateur.

bitshares showing early signs of reversal against bitcoinbitshares is showing bullish divergeance on the 4h timeframe
+ daily descending wedge + end of abc daily correction
4h rsi is showing bull div + ichimoku still no sign of reversal
I expect it to rally against bitcoin this month,
buy zones are highlighted in green.
you can buy a part on the breakout of the wedge, or if it break down, a good buy zone will be on the trendline, near 1000-1300 level
main target is 4500 level, main resistance, but i expect it to go through.

Possible spike +20%BTS is very close to MA50 4H, by crossing it can produce a sudden spike to our 0.236 standard Fibonacci

Bitshares Ichimoku KUMO TWIST Bullish reversalKUMO TWIST
First TK Cross in mid December
Second approaching very soon. BULL SIGNALS UP :D

Bitshares 500% Long TargetKing of the Decentralised Marketplace
Bitshares has rejected support and will make a nice move soon.
Easy Money :D

BitShares - The End Of Correction?BitShares fell down to 3k satoshi support after reaching the high at 6.6k satoshi in January, while the decline resulted in over a 60% loss to Bitcoin. The strong support was found at 61.8% Fibonacci retracement level, that price failed to break and close below, although spikes lower have been the case.
From 3k support, the price went back up to 4.7k resistance and once again moved down to the 3k support. Currently, BTS/BTC could be forming a double bottom around the support area, which is now also confirmed by the 4/1 Gann Fan trendline as well as the 200 Moving Average which is being rejected yet again.
There is also a possibility that consolidation will take place and price will range between 2.3 and 3k satoshi, nevertheless with the given facts, it looks like the correction is coming to an end.

BTS/BTC opportunity Hi guys
Today we are watching BTS on 1 day sticks. I see it going down just a little more. If it breaks the support line @ 0.00001892 , I think we are going to reach +/- the 1000 Satoshi level. Between these 2 lines there's a good buying position. Hoping that afterwards we could go back up and reach the level of +/- 3600 Satoshi again. At this point I would look very closely to the market to see if we have a rejection or an acceptation and sell or hold it.
Looking at the ADX and DI we can see a downtrend that can go a little further but finally change to a strong uptrend afterwards.
Let me know what you guys think!
Hoping for some profits here.


BTS - on path to .0001 btc?It looks to me like BTS wave 4 correction could be done. The fractal pattern of wave 3 and 4 looks similar to wave 1 and 2. Looking at fib lines I am shooting for.0001 btc target.


Saved analysis for futureI will just save this analysis here so I can pick it up later, BTS finally touched our 1.618 Circle Fib. There is no guarantees of reversal here as it can just continues toward the red circle Fib. I will monitor this until things are clear to setup a trade later.

BTS/BTC at bottomThe bottom is being created now. Concentrate on the orange trendline, probably the 3rd confirmation is needed to start the formation of 5-wave structure. Nevertheless, bts/btc have a great setting for the future. Enjoy.

The ever challenging BTSVery fast trade with some "minor" swing. Decided to go this one "just because I can", but on reality I like the challenge to trade it. It is very very much risky but instead of keep this private I like to publish it for everyone to use it or not. Everything on chart, 5% to gain, just 1% stop loss.

BTSBTC - Longterm PerspectiveAnalysis :
BTSBTC is rounding out a nice cup and handle pattern. The current ABCDE correction can be seen as wave 2 of a higher degree impulse wave up. I have drawn an extended 5th wave, as BTSBTC seems to love those. Extended 5ths often lead to very significant corrections, which is why I have drawn a steep ABC correction to follow.
You may also notice that wave 3 and wave 4 of the impulse up form a higher degree cup and handle pattern. A cup inside of a cup, if you will! Not much significance with that, I just love recursive patterns :P
Target :
All signs point towards 0.00040800 BTC! But how much will that be in USD? It's difficult to say...
If BTCUSD holds at its current price of 10k, then 0.00040800 BTC would be worth roughly $4.08. However, I see BTCUSD dropping to as low as $1200 over the next 2-3 months ( see my analysis ), so 18x gains in BTC may translate to little in terms of USD. With that in mind, I am somewhat hesitant to trade this, despite the strong technicals.
Legal Disclaimer :
This is not financial advice and I am not a financial advisor. This is merely my opinion and is intended for educational purposes only. All investments have risk and you could lose everything. Never invest more than you can afford to lose and always do your own research prior to making investments.

Long t3rm bitshares projection if this continues to move like it is, and we see continued losses due to bitcoin uncertainty....may be a while before we see the higher highs we may have expected before. Just wait till April 20ish and we should have a much clearer indication as to where the cryptosphere


BTS/BTC Bottom may not be in but +1000% VERY LONG TERMHi guys was doing some personal analysis and decided to share as BTS 0.00% is behaving strangely at the moment. The weekly chart looks great we have definitely reached a bottom and are still in a clear uptrend and can see plainly the nice wave 1 rally. The wave 2 correction as ABC looks like it not done just yet however. Wave C must always have 5 waves down which at the time of writing the current wave C hasn't formed 5 clear waves that do not break Elliot wave rules (I have tried many cases). I also find it hard to believe we are getting a running flat (wave C shorter than wave A) in a bear market as well as taking into account BTS 0.00% had one of the weakest bounces I have seen from BTC's 6k dip. So for me my primary count is further downside which I have drawn for you.
1D INDICATORS
RSI: Looks to have formed bottom
MACD: More room to go down
BUY ZONE AND TARGETS
Buy zone: Anywhere between 1800-2500 sats -2.57% .
Targets Mid term: 4500, 6000 sats -2.57% .
Targets Long term: 12000 sats -2.57%
Targets Very long term: 18000 sats -2.57% (new ATH -0.47% +1000%!!!)
This is a very long term trade so do not expect the annoying moon anytime soon.
*Not financial advice*

$Bitshares Moon CoinThis is a coin im holding with a big chunk of my portfolio.
I see great things coming for this one :)

Bitshares done with the C wave? hello everyone!
After a 6 week long markt crash of cryptocurrencies, I thing we are at the end of what we call "an ABC-correction".
An ABC-correction for those who dont know is a downtrend that can take a pretty long time and falls in 3 "waves".
The first wave (A) starts at the very top of the past bull-run (=uptrend), mostly heading down pretty fast.
The second wave (B) starts logically at the bottom of (A) and heads up pretty fast as well, ending mostly around halfway up the (A).
The third wave (C) pul back down again, does it often a bit slower then A and B but seeks much lower points of value..
We think in this case with BTS we will hold our major resistance because its strong, and we have some nice patterns.
Bitshares is starting to find the nose of his descending wedge right now, what means don't take action yet.
keep an eye on our major resistance. If it breaks down, it will continue to fall lower, and we will have ourselfs a bargain on BTS.
If we break the descending wedge on the upside you will have yourself a nice trade...
TRADE: medium risk
BUY: 0.00003500
SL: 0.00003000 (-13.5%)
TP1: 0.00005500 (+57%)
TP2: 0.00007000 (+100%)
TIME: 2-3 weeks..
If you found this usefull then please hit that like button and follow our page :)
Profitable Regards,
Perspect.
