BTS/BTC Structure Analysis We still got some more downside on BTS. #buythedip
We are also in a larger equilibrium pattern that should produce a higher low. Could this be a larger 1-2 and we get a rocketship to wave 3? Who knows...BTC is gonna let us know what to do
BTSBTC trade ideas


Good moment to buy low and sell highA large amount of BTS was bought around 2800. So It is the great support wall for now.
If this level will be broken (I don't think so) we will see the great capitulation of BTS hodlers.
Keep and eye on the alts. They can start growing anytime.


BTS new 218% potentialBTS had a 50% retracement and jumped from 6h,12h,1d 200 EMA.
Stoch RSI seems to reverse and MACD looks nice on daily
It seems to be on wave 1 from a new market cycle.
Altough it had a jump from 200 EMA, it may come a little bit down and test the 6h 200 EMA as it looks a little overbought on 6h and 12h, and after that it may start the ascending path as it's oversold on daily.
Looking to sell at key fib prices that also had some sideways or support/resistance in the past.
Targets sent in Telegram Channel.

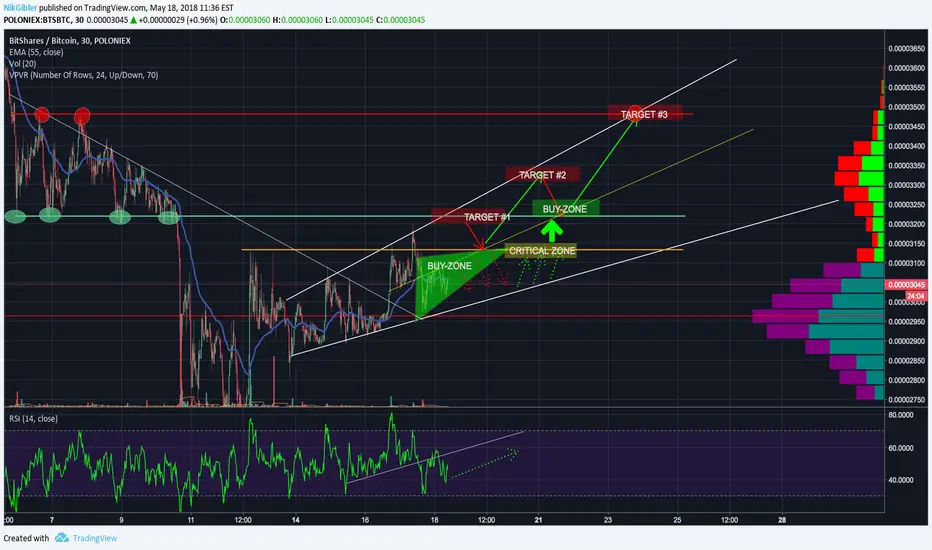
BitShares- Driving Like The Fast And The Furious or Mr... Magoo?
BUY ZONE #1 = .00003075 - .00003110
BUY ZONE #2 = .00003219 - .00003264
TARGET #1 = .00003200 - .00003238
TARGET #2 = .00003310 - .00003346
TARGET #3 = .00003468 - .00003504
STOP-LOSS = .00002960
***This information is not a recommendation to buy or sell. It is to be used for educational purposes only. it should not be considered financial advice***
BTSBTC : 3 scenario leftHi guys,
Heres the 3 scenario that are left. Need to be cold blooded in these moments.
1) original post
2) follow up of my precedent idea. ABCDE
3) follow up of my precedent idea. expanded flat corrective pattern


CUP AND HANDLE (TAZA DE TE) EN BITSHARES-ACTUALIZACIÓN DE MI ANTERIOR ANÁLISIS DE BITSHARES.
SE NOTA UNA FORMACIÓN DEL PATRÓN CUP AND HANDLE O TAZITA DE TE.
ESTO SE AÑADE A LA INFORMACIÓN O LA GRÁFICA MOSTRADA ANTERIORMENTE EN MI ANÁLISIS.
EL PRECIO PARECE TENER POCA FUERZA COMO PARA COMENZAR UN REVOTE AL ALZA EN ESTOS MOMENTOS , ASI QUE LO POSIBLE ES QUE LO VEAMOS BAJANDO UN POCO MÁS.

Sharing my ideas on BTS BTCHi guys!
This is what I'm seeing on BTS/BTC chart.
Please note that I'm not an experienced trader and this isn't an analysis that should be trusted.
Please let me know what you think, I'm opened to any kind of comment.


BTS bounce. the waves labeled is a chart for reference, using the initial high of last years June price as greater Wave 1, the correction that ensued thus far as wave 2, and where we are is the beginning of wave 3 of 3.
not sure of time table, but the price projection is using a minimum of 1.1618 times the length of wave 1 to calculate the minimum price movement we could expect for wave 3.
and then using the height of wave 1, to be in a 1:1 correlation of wave 5.
gooooo bitshares


Bitshares [BTS] vs Bitcoin [BTC] with EOS Win Button!Bitshares is moving alongside EOS, and has the ability to use its Dex within the EOS system environment
expecting big things here, we gotta long way up to go again so rewards are good and the risk is low
possible entries 2700 and under, watch bitcoin price for further push down on BTS price
www.futuretechpodcast.com

BTS cup and handle 100% profit potential!!!Bitshares (BTS/BTC) has a beautiful cup and handle formation on the daily chart. We have a nice, rounded cup with low volume at the bottom, then increasing on the sides. The handle retraced a textbook 50%. Measuring from the bottom of the cup to the top of sides, we had an increase of 0.000027BTC. We then use that as a target increasse for the breakout. End target =
around 0.00005300BTC. 100% profit potential


BTSBTC : small TA update about major 1-2Hi guys,
Small update about the major 1-2 validity.
1 and half week ago i posted this, you see the 1st may MA200 and a fibo retracement used with a candle chart :
This chart is not bad interpretation but sometimes you need to use line chart to expel aberration (oversold-overbought). In this post i putted fibo scale at full retracement as 0 and full extension at fibo 1 on the line chart. Change are subtile but you have better coherence between data. Having full extension of fibo with 0.618 where MA200 is = grow their value since MA act like repulsive (you bounce on it or once you cross it you get repulsed the other way down).
As i said, candles chart can trickle the cohesion of the data which sometime make you switch to the line chart (which i recommend if you want to count wave and recognize pattern sometimes better). Line chart smoother everything and sometime its the ingredient you need for the symbiosis, like here : MA200 correlate with f-extended fibo 0.618.
I used line chart in DGB. It helps me to clearly validate or invalidate with more certitude count or projection.
im planning to post a video about how i use macd interaction in my projection. Stay tuned !


$BTSThat's a lot of resistance points to break through back to the 4k range. Question is will it break out at this descending triangle or continue in this channel until the larger descending triangle. Volume is low, my feelings are $BTS will stay in this channel until the 15th based solely on volume, and then pick up again. Really wish I had bought at 4200 instead of 3400.

bts swingerI am shorting till 2255 possibly down to 1988 depending on how things look. Then it is time for a long trend. As you can see with the history of this coin it always goes back down after a peak. I do not understand why so many others think that all of a sudden it is going to the moon and break the down trend triangle. If it decides to form a second peak then it may start its uptrend at 275 area back to 3200 area in which it will complete its final collapse. Will be keeping an eye on that. This is not financial advice but my opinion. Any comments are welcome. Happy swing trading.

BitShares , A great opportunity to buy in BTSBTC. Catch it!!Technical analysis:
BITSHARES/BITCOIN is in a range bound and Beginning of up trend is expected.
The price is below the 21-Day WEMA which acts as a dynamic resistance. as long as bullish exit in daily chart or daily RSI is not occurred, The uptrend will not begin.
The RSI is at 29.
Trading suggestion:
*The price is in a range bound, but we forecast the uptrend would begin.
*Price is in the Buy Zone (0.000018 to 0.000007), we would set orders based on Price Action and expect to reach short-term targets.
Beginning of entry zone (0.000018)
Ending of entry zone (0.000007)
Entry signal:
Signal to enter the market occurs when the price comes to "Buy zone" then forms one of the reversal patterns, whether "Hammer" or "Trough" , in other words,
NO entry signal when the price comes to the zone BUT after any of reversal patterns is formed in the zone.
To learn more about "Entry signal" and special version of our "Price Action" strategy FOLLOW our lessons:
(We have started to prepare these lessons in TradingView. If you want us to continue, give us feedbacks!)
Take Profits:
TP1= @ 0.000029
TP2= @ 0.000047
TP3= @ 0.000059
TP4= @ 0.000071
TP5= @ 0.000102
TP6= @ 0.000176
TP7= Free
