A Bear Cycle has been started. BTC is now entering in it's bearish cycle. So avoid buying and start shorting/selling it.
BULLUSD trade ideas

BTCUSD will be strong B ? BTCUSD will be strong B to make new highs and go down again to close point C before going up significantly.

$BTC Tracks $GOLD Very Closely With 12-Week LeadCould it really be this simple?
Maybe we can just throw Global M2 out the window and track TVC:GOLD with a 12-Week Lead.
Someone pointed this out to me yesterday when I posted Gold's near 1/1 tracking with Global M2.
*Note the deviation in CRYPTOCAP:BTC PA from the ETF hype.

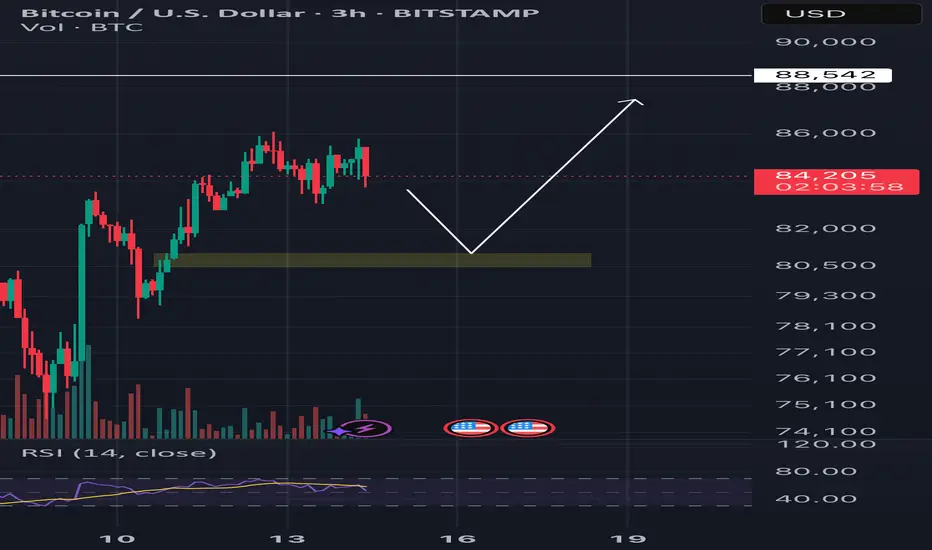
Time for a Bitcoin pull back?Finally bitcoin broke out of its consolidation/ down trend.
it looks like we could get lucky and have a nice little pullback to the green box.
If we are so lucky, buy with all you have. It may be the last time you see this price for a long time. When you see it next you probably wont want to touch Bitcoin with a 10 foot pole.

Bitcoin H4 | Potential pullback before bouncing higher?Bitcoin (BTC/USD) could fall towards a pullback support and potentially bounce off this level to climb higher.
Buy entry is at 88,033.50 which is a pullback support.
Stop loss is at 85,500.00 which is a level that lies underneath a pullback support.
Take profit is at 92,708.20 which is a swing-high resistance.
High Risk Investment Warning
Trading Forex/CFDs on margin carries a high level of risk and may not be suitable for all investors. Leverage can work against you.
Stratos Markets Limited (tradu.com):
CFDs are complex instruments and come with a high risk of losing money rapidly due to leverage. 63% of retail investor accounts lose money when trading CFDs with this provider. You should consider whether you understand how CFDs work and whether you can afford to take the high risk of losing your money.
Stratos Europe Ltd (tradu.com):
CFDs are complex instruments and come with a high risk of losing money rapidly due to leverage. 63% of retail investor accounts lose money when trading CFDs with this provider. You should consider whether you understand how CFDs work and whether you can afford to take the high risk of losing your money.
Stratos Global LLC (tradu.com):
Losses can exceed deposits.
Please be advised that the information presented on TradingView is provided to Tradu (‘Company’, ‘we’) by a third-party provider (‘TFA Global Pte Ltd’). Please be reminded that you are solely responsible for the trading decisions on your account. There is a very high degree of risk involved in trading. Any information and/or content is intended entirely for research, educational and informational purposes only and does not constitute investment or consultation advice or investment strategy. The information is not tailored to the investment needs of any specific person and therefore does not involve a consideration of any of the investment objectives, financial situation or needs of any viewer that may receive it. Kindly also note that past performance is not a reliable indicator of future results. Actual results may differ materially from those anticipated in forward-looking or past performance statements. We assume no liability as to the accuracy or completeness of any of the information and/or content provided herein and the Company cannot be held responsible for any omission, mistake nor for any loss or damage including without limitation to any loss of profit which may arise from reliance on any information supplied by TFA Global Pte Ltd.
The speaker(s) is neither an employee, agent nor representative of Tradu and is therefore acting independently. The opinions given are their own, constitute general market commentary, and do not constitute the opinion or advice of Tradu or any form of personal or investment advice. Tradu neither endorses nor guarantees offerings of third-party speakers, nor is Tradu responsible for the content, veracity or opinions of third-party speakers, presenters or participants.

Global Market Overview. Part 4: BITCOINPreliminary Context — See Above
Bitcoin: Euphoria, Fear, and a Foundation That Withstood It All
If we were to describe the mood of the crypto market over the past few months in a single phrase, it wouldn't be just a roller coaster — it’s been a full-blown thrill ride, driven by geopolitics, news hype, and emotional burnout among participants. Public sentiment toward Bitcoin this year has swung across the entire spectrum — from wild excitement and $200K price forecasts after Trump’s projected victory, to total pessimism with claims like: “That’s it, Bitcoin’s going back to $20K — crypto is a scam.”
And, as is so often the case, both camps were wrong.
The market survived — not on hype, but on fundamentals.
I make no secret of the fact that I remain a Bitcoin optimist. Not because I want to believe — but because when you mute the media noise, one thing remains: the strongest macroeconomic foundation the crypto market has ever had.
Let’s be honest: it’s getting harder and harder to find a solid reason why Bitcoin should collapse back to $50K — let alone $20K. Strip away the emotion, and here’s what we’re left with:
What do we have, in fact?
1. Regulators are no longer suffocating the market — they’re participating.
The SEC has dropped major investigations into crypto projects, including Ethereum and leading DeFi platforms.
The U.S. Senate has approved legislation to create a national crypto reserve — for now, it’s based on confiscated assets, but it marks the first precedent of crypto being recognized as part of state strategy.
Meanwhile, the European Union has officially launched the MiCA regulatory framework, making crypto a fully legal asset class in the EU with clear compliance norms, a tax model, and open access to institutional clients.
2. Institutions are playing big.
Crypto ETFs have launched not only in the U.S., but also in Europe. This means one thing:
Pension funds, insurance companies, and hedge funds are entering the market.
The capital is not speculative — it’s strategic.
These are not "hot" retail dollars chasing tweets — they’re building portfolios for the long haul.
3. Exchanges are drying up. Whales are accumulating.
Bitcoin reserves on centralized exchanges are at historic lows.
This tells us:
Long-term holders aren’t selling.
Large players are moving assets to cold wallets.
Retail hype hasn’t kicked in yet — which, frankly, makes it a perfect entry point.
When the crowd starts buying, it’ll be too late.
4. Even a trade war couldn’t break the market.
The tariff escalation between the U.S. and China has hit global trade hard, triggering corrections across traditional markets. Yet despite that:
Bitcoin held strong above $70K, rising from the $110 levels.
This zone has become ironclad support — a sign that the market has matured.
There’s panic in the headlines, but not in the charts.
Even Wall Street veterans are cautiously suggesting Bitcoin may be a necessary hedge against fiat devaluation.
5. China is silent — for now. But if that changes...
Any positive signal from Beijing — even a hint at easing restrictions or partial legalization of crypto ownership — would cause an immediate surge. Because:
Chinese capital is waiting.
The tech infrastructure is already in place.
And if the government gives the green light, the market will relaunch overnight.
What do I think?
The current Bitcoin price range is a prime entry zone for medium-term positions.
The 70K–85K range is a fundamental accumulation corridor, where:
Strong hands are already in.
Weak hands have been shaken out.
FOMO and retail hype haven’t even started.
By Fall 2025, even modest optimism in geopolitics or trade could push the market to new all-time highs — not on hype, but on dry institutional demand.
Final thoughts
I’m not a fan of conspiracy theories.
But this setup is too clean to be a coincidence.
The crypto market has survived it all: bans, lawsuits, regulatory crackdowns, exchange collapses, hacks, FTX, LUNA, and every form of digital black magic.
But it's still here.
More than that — it’s quietly becoming a legitimate part of the global financial system. Without noise. Without asking permission.
While everyone else is talking panic — the market is already in an accumulation phase.
And those who understand the cycles don’t look to the news for validation.
They look at the fundamentals — and act accordingly.

BTC: Climbed High, Took a Breather, and Said ‘Let’s Keep Going’BTC 3D Technical Outlook
By SpicyPips
Upon analyzing the 3-day chart, we observe that BTC is trading within a well-respected ascending channel, which has held as dynamic support and resistance multiple times.
After reaching its all-time high of $109,637.53, price retraced into the Golden Zone (Fibonacci 61.8%–50%), a key area where buyers stepped in. BTC has since bounced back within the channel, indicating strength and continuation of the bullish cycle.
The current structure suggests a potential move toward our second target aligned with the 127.20% Fibonacci extension at $125,868.39, as long as the channel remains intact.
Capital protection should always come before profit — let risk management be your trading foundation.
Happy Trading,
SpicyPips

Bearish FinTech 50 DMA < 200 DMAduring the bear markets I lived through 87,2K, 2008-2010 I had to learn how to detect bear market conditions, the easiest and simplest if when the 50 EMA crashes down through the 200 EMA.
Another indicator of a Bear Market is a flight to quality gold and silver... check that's 2.
We have a head and Shoulders, price is falling down and possibly through the 50 EMA. H & S is #3
The blue line is the 100 DMA (I use DMA or EMA) if this crashes through the 200 that's even more bearish.
This happening means we should not be long, all things being equal I think we will go down.

BTCUSD next move(expecting a bearish move)(16-04-2025)Go through the analysis carefully, and do trade accordingly.
Anup 'BIAS for BTCUSD (16-04-2025) (MID TERM)
Current price- 83,800
wait for the break-out
"if Price stay below 85,800 then next target is 81800, 79,800 and 76000 above that 88,000.
-POSSIBILITY-1
Wait (as geopolitical situation are worsening )
-POSSIBILITY-2
Wait (as geopolitical situation are worsening)
Best of luck
Never risk 2% of principal to follow any position.
Support us by liking and sharing the post.

Bitcoin: Anything Goes Inside The Range.Bitcoin has rallied out of my anticipated 76K AREA reversal zone (see my previous week's analysis). I anticipated this move BEFORE all of the news and drama that transpired over the week because I focus on relevant information that came from this chart. As of now, price is fluctuating in the middle of a consolidation. While price is still attractive in terms of the bigger picture for investment, the fact that it is in the middle of a short term consolidation must be strongly considered for day and swing trade strategies. Here's my perspective.
A double bottom (failed low) has been established around the 74 to 76K area. It does NOT matter why, all that matters is the structure is now in place. This is very important for two specific reasons: 1) it is a broader higher low (Wave 4 bottom?) which implies a higher high or at least test of high is more likely to follow. This means test of 109K over the coming months is within reason. 2) Resistance levels have a greater chance of breaking while supports have a greater chance of being maintained. Current prices up into the 90K resistance are attractive for dollar cost averaging while broader risk can be measured by the 76K area low.
As for swing trades, price is fluctuating at a mid point of a consolidation. The range low is around 76K, the high around 88K (see arrow). When it comes to smaller time frame strategies, consolidation mid points are HIGHLY random areas. This is where you either WAIT it out for a support or resistance to be reached before taking a signal OR go with continuation patterns (Trade Scanner Pro great for this). The higher probability scenario would be a minor retrace into the high 70Ks or low 80Ks for a swing trade long. Otherwise WAIT for the 88K to 90K resistance area for short signals which would be EXTREMELY aggressive given the fact Bitcoin is generally bullish.
And day trades strategies have a similar outlook. Being in the middle of the range means smaller time frame supports and resistances within the area 83K to 88K are going to be less reliable or more random until price momentum asserts itself on the bigger picture. Beginners should simply avoid this environment, but if you must participate, the best way to adjust is work on smaller time frames like 5 minute or less and accept the whatever the R:R ratio is for that time frame. Either way do NOT expect BIG moves until price makes its way to one of the outer boundaries of the range. The Trade Scanner Pro quantifies the R:R for your chosen time frame and gives you a much better idea of what to expect.
The illustration on the chart points to a short term rejection of the 88K to 90K area resistance. This can be attractive for those who are willing to accept greater risk and operate on smaller time frames. IF Bitcoin breaks 90K, it can easily squeeze into the 95K area and all it takes is an unexpected news announcement which seems to happen regularly in this environment. NO ONE knows where the market is going, we can only assign probabilities which is why RISK must be assessed and RESPECTED before ANYTHING else.
This game is hard not because traders lack intelligence, it is because MOST participants believe they are consuming information that is relevant, especially if this behavior has been reinforced by random wins. As retail traders we have to operate with a blind fold while a small minority of participants operate with HIGH quality information. Here's a hint: you will not find truly relevant information on public platforms like Twitter, mainstream news, etc., yet people still turn to these sources when they feel the need to be "informed". Everything you NEED is on your chart.
Thank you for considering my analysis and perspective.

Bitcoin Bullish Reversal Confirmed! Next Stop: $88.5K to $105K..BTCUSD Price Forecast 🚀
- Bitcoin ( BITSTAMP:BTCUSD ) has shown strong bullish signals at the bottom of the recent downtrend. Here's the technical breakdown:
🔹 Double Bottom Formation: A classic reversal pattern has formed, and price has broken above the neckline, signaling bullish momentum.
🔹 Major Breakouts:
- Cleared a strong resistance zone
- 200 EMA breakout confirms trend reversal
- Retraced to key demand zone, respecting the descending channel
🔹EMA Confirmation: Price retraced perfectly back to the 200 EMA, now acting as dynamic support—adding confluence to the bullish bias.
📈 Technical Target Levels:
🎯 $88,500
🎯 $94,000
🎯 $98,300
🎯 $105,400 (Final target for this wave)
These levels are based on measured move targets from the double bottom pattern and Fibonacci extensions.
✅ Like, 💬 Comment your thoughts, and 🔔 Follow for more updates as we grow together in this trading journey!
#Crypto #Bitcoin #TechnicalAnalysis #BTC #TradingCommunity #BTCUSD #CryptoForecast

BTC vs Nikkei 225 strong match for declineI've been using the Nikkei 225 for at least 2 years to make forecasts as the big players have been involved in the Japanese Carry Trade.
Gains in the Japanese Nikkei 225 equity market have carried onto Bitcoin BTC.
Now I am afraid BTC could collapse from 120k and above to well under 50k. Not just for a short duration but permanently. It will begin with a volatile ABC, but could commence into a deep wave 3 down, where waves before the ABC is wave 1.
You should be considering selling all your Bitcoin BTC and Crypto.
There will be no come back from this.
I'd advise followers to make use of the following SHORT methods.
1. Use Short ETF's were you cannot be scam wicked.
2. Only use European Style Put Options on short durations e.g Derebit.
3. MSTR Option Shorts and Short ETFs will be a good way to capitalize on this volatility.
Be aware that the majority of exchanges are going to go bust from this event.
It would be advisable to solely trade on a ON RAMP exchange or with a reputable Stock Broker that has insurance or Gov payback schemes on your fiat.

BTC is in strong support area based Fib RetracementHi again, for a long time I don't share my ideas here, so I'm trying to consistent share my thought here.
Technical
BINANCE:BTCUSD in strong support line based Fib Retracement on $76,113.25 (on daily Timeframe)
The price currently below the EMA 200
MACD still doesn't give the sign to long
BTC Dominance still high (60.39% based on Coinstast )
Macro
Based on similiar correlation with S&P500, it's still give no good sign to bounce back (it maybe going deeper)
About the global economy, US Tariff still give the global uncertainty and cold vibes haha
Summary
If you going long term, maybe you can go buy BTC in small size, is a good price to add the collection
If you going short term, I think it will be go deeper first
Thanks for your time!
I hope everyone have a good time and good health!

Bitcoin Getting Ready to Continue up to Test $87k again.Well...well....well, looks like bears still playing lazy.
Anyways TIME is running out for bears to make their case so knowing that bearsstill have like
8 to 11 1hr candles to make their case so we came out with 3 scenarios and are as follow.
(1)- it breaks out from where it is right now or
(2)- It makes another narrow sideways move and then breakout or
(3)- Drops quick in a couple of candles with nasty wicks just to bounce back up quick.
I'm inclined for the #3 option cause there's still TIME to happen but all depends on volatility, the bright side of this dilemma is that all of them will end up above the $85k line during the week, once it gets there will take another look. Place your bets ladies and gentlemen and buckle up, and get ready for a wild ride.

BTCUSD...15m chart patternlooking at a BTC/USD long trade setup:
Entry: 92,550
Stop Loss (SL): 92,000
Take Profit (TP): 93,000
Here's a quick breakdown:
Risk: 550 points
Reward: 450 points
Risk-Reward Ratio (RRR): ~0.82
This is a bit below the ideal 1:1 RRR. You might want to:
Tighten your SL slightly (if structure allows), or
Aim for a higher TP to improve the RRR

Bitcoin’s Breakout Blueprint: Eyeing $92KAs of April 20, 2025, Bitcoin (BTC) is trading around $84,500, having recently tested the $92,000 level multiple times. This price point is significant, serving as both a psychological barrier and a technical resistance level.
Technical Analysis:
Resistance and Support Levels: Bitcoin has encountered resistance near $92,000, a level that has been tested repeatedly. A sustained move above this could open the path toward $100,000 and potentially $108,000, the previous all-time high from December 2024. On the downside, support is observed around $85,650, aligning with the 200-day EMA. Further support lies at $78,000 and $74,500, marking previous consolidation zones.
Chart Patterns: The formation of a bullish pennant on the daily chart suggests potential for an upward breakout. If confirmed, this pattern could propel BTC toward $137,000 by Q3 2025.
Volume and Momentum: Recent trading volumes have been moderate, with a slight uptick during price advances, indicating growing buyer interest. Momentum indicators, such as the RSI, are neutral, leaving room for further price movements in either direction.
Fundamental Factors:
Institutional Inflows: Significant capital inflows into Bitcoin ETFs, exceeding $70 billion, have been observed, reflecting strong institutional interest.
CryptoRank
Macroeconomic Environment: Liquidity injections by the U.S. Treasury, amounting to $500 billion since February 2025, have increased market liquidity, which historically correlates with Bitcoin price appreciation.
Halving Effect: The April 2024 Bitcoin halving event has reduced the supply of new BTC, a factor that has historically led to substantial price increases in subsequent months.
Mid-Term Outlook:
Considering the technical and fundamental factors, Bitcoin's mid-term target remains at $92,000. A decisive break above this level could lead to a retest of the $100,000 psychological barrier and potentially higher targets. However, failure to maintain support above $85,650 may result in a consolidation phase or a retest of lower support levels.
Investors should monitor key resistance and support levels, institutional investment trends, and macroeconomic indicators to assess Bitcoin's trajectory in the coming months.

My $BTCUSD analysis, called out at 82.9k for a measured 12% move*DISCLAIMER* this is not financial advice and cannot be construed as such
CALLED OUT AT 82.9K going to 105k make sure you launch the chart and put the candles on Heiken Ashi
$BTCUSDBreakdown and technical/fundamental analysis on BITSTAMP:BTCUSD
THANKS ALL GLTA!

BitcoinGreen line represents mid-point and the respective upside and downside levels for the study purpose.

BTC Bullish But Needs to RetestThe market had a selloff and is about to break highs in the upcoming months!
The current coming phase will be the mania phase, most people think the bull run is over, but it is not over just yet 🙂 #trustmebro
Bitcoin has a level at 81,100 to retest and will fly until June 2025.
This will sound absurd, but BTC to 854,000! There are big institutions sell orders at that level.
XRP - $54
HBAR - $50.26
LTC - $1800
DOT - $240
ETH - $8000
BTCUSD h1 timeframe bullishAnalysis of the BTCUSD pair for today, April 22, 2025, btcusd formed a double bottom in the previous day, which the market bounced off and went up, then bounced back up from the sideways chill, but I analyze it going to 94000 we consider buying
Entry 88.350
TP 94.000
SL 86.000

Trendline BreakThe price has broken a daily trendline followed by a pullback on the 4 hour and 1 hour, now the price is ready for a bullish impulse
WE ONLY TRADE PULLBACKS

BTC Short Term BullBTC has broken out of a mini falling wedge pattern . After touching 3 year longterm support BTC now finds its way towards $115,000 per BTC . The RSI accompanies it as in the past once the RSI broke descending resistance BTC rose sharply
Target ; $115,000

CME Gap Between 91,050 and 91,659 – Market Might Revisit🧠 A CME gap has formed between 91,050 and 91,659 🕳️
Price could retrace to fill this zone after the recent bounce 🔁
This area is often revisited — watch out for a possible reaction ⚠️
