Pan cake or pin cake?????I have no idea about fundamental, but I am thinking its enough moment to upside, need correction long way down to 60k area. retest is must to consider a healthy market. And it might be slow down for the rest of the year until the bull run starts again in winter, you know winter is coming. hahahaha
BULLUSD trade ideas

btcusd sell analysis Btcusd pair has been quite slow due to the mixed feelings of the investors as some believes it would pump while other are expecting a great drop.
Due to the uncertainty in the market i am going to stick to the technical aspects of the pair. Currently market pumped after triple bottom at the price 93500 which i will take as a supporting area while the 97700 position is a resistance and the breakout of 95000 position is deciding the trend so i will take it a liquidity zone.
technically 93000 is the supporting area and the 97700 is the resistance.
If market gives a bullish breakout above the 97700 area then bitcoin prices can increase
But if market gives a bearish breakout below 95000 then it will drop to its supporting area 93000.

BTCUSD ANYLASIS 1 HOUR TIME FRAME Based on the BTC/USD 1-hour chart we provide
Entry Sell is marked around the 96,400–96,500 level.
Target 1 is shown at approximately 94,600.
Target 2 is projected near 93,600.
The chart suggests a bearish move after a breakout from the downtrend resistance zone, implying a potential short trade setup targeting these levels.

BTCUSDT PRICE LOOKING TO BREAKDOWN OT BREAOUTTargets are the white boxes.
Significant breakdown or breakout will make the target zone highlighted in white box
Direction and momentum is the key.
Maintain strict rules.
DYOR:
Disclaimer: Only for Educational purposes Donot use this as financial advice

BTCUSD in bullish trend BTCUSD in bullish trend expected correction according to RSI diversions, entry with a sell stop

BTCUSD: Expecting Bearish Continuation! Here is Why:
Looking at the chart of BTCUSD right now we are seeing some interesting price action on the lower timeframes. Thus a local move down seems to be quite likely.
Disclosure: I am part of Trade Nation's Influencer program and receive a monthly fee for using their TradingView charts in my analysis.
❤️ Please, support our work with like & comment! ❤️

I'm bullish As you can see BTCUSD is in an uptrend and respects a lot of FVG so with the trend analysis and some indicators this can be a good opportunity!!$$

BTC/USD Rejects Key Supply Zone – Is a Drop to $88K Next?Bitcoin just rejected a major supply zone around $97,300, showing signs of strong bearish momentum. This 4H chart highlights a clear rejection from the visible range high-volume node, with BTC currently trading at $96,191 and dropping.
Key Observations:
Supply Zone (Resistance): Around $97,300 – price has failed to break above this level multiple times.
Demand Zone (Support): Sitting near $88,129, this is the next major liquidity area to watch.
Bearish Signal: Consecutive red candles forming below the supply zone with lower highs, hinting at selling pressure taking control.
Targets:
First short-term target: $92,000
Final demand zone target: $88,129
Bias:
Bearish until BTC breaks and holds above $97.3K with volume.
Trade Idea:
Look for a potential short entry on a bearish retest of the rejected zone. Risk management is key – wait for confirmation.
What I'm Watching:
Will buyers step in at GETTEX:92K ? Or is BTC heading straight for the FWB:88K demand zone?
---
Hashtags for Visibility:
#Bitcoin #BTCUSD #CryptoTrading #SupplyAndDemand #TradingStrategy #LuxAlgo #FrankFx #PriceAction #TechnicalAnalysis #4hChart

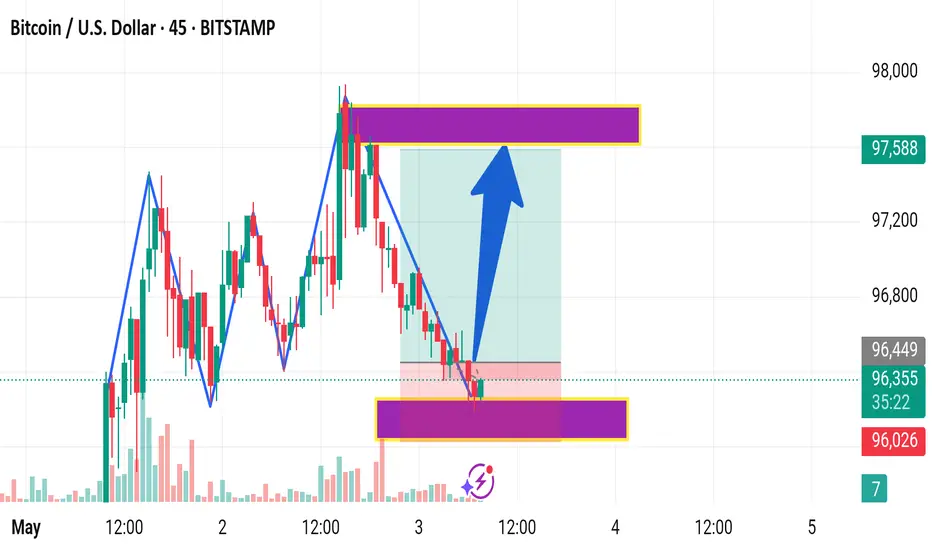
#BTCUSDT:Chart The image shows a Bitcoin (BTC/USD) trading chart on the Bitstamp exchange with a 45-minute timeframe. Here's a breakdown of the key details:
1. Price Information:
Current BTC price: ~$96,342
Buy price: $96,342
Sell price: $96,341
Change: -$583 (-0.60%)
2. Chart Patterns:
The chart displays a descending trendline with a consolidation zone at the bottom (highlighted in purple/yellow).
A bullish breakout is anticipated, as shown by the large blue upward arrow.
The target zone after the breakout is highlighted in the upper purple/yellow zone near the $97,588 level.
3. Technical Zones:
Support zone: Around $96,000 (highlighted in purple/yellow at the bottom).
Resistance/target zone: Around $97,500–$97,600.
4. Indicators:
Volume bars at the bottom.
Blue zigzag pattern possibly indicating recent price swings.
A shaded green rectangle indicating a bullish projection area.
This chart suggests a potential reversal or breakout to the upside from the support zone. Would you like help analyzing potential entry/exit points or setting up risk management based on this chart?
BTCUSD BUY SETUP COMPLETE ANYLSIS Current technical analysis indicates a potential buying opportunity in BTCUSD, supported by key indicators:
- *Support Zone*: $(96'596)
- $(96'638) strong level where buying interest is expected to emerge.
- *Oversold Conditions*: The Relative Strength Index (RSI) is in oversold territory, suggesting a potential reversal.
- *Bullish Divergence*: The Moving Average Convergence Divergence (MACD) shows a bullish divergence, indicating a possible trend reversal.
*Trade Parameters*:
- *Buy Zone*: $(96'596)
-
- *Take Profit 1*: (96'824)(initial target)
-
- *Take Profit 2*: (96'965) (extended target)
-
- Take Profit 3 (97165)
-
- *Stop Loss*: (96381) (risk management)
*Trading Strategy*:
- Monitor price action and indicator confirmation.
- Consider scaling into the trade.
- Adjust position size according to risk tolerance.
*Disclaimer*:
Trading cryptocurrencies involves significant risk. This analysis is for informational purposes only and should not be considered investment advice. Always conduct your own research and consult with financial experts before making trading decisions.

BULLISH BIASPrice broke bullish structure and pulled back, i see it buying to previous resistance zone

Bitcoin long: Expects Wave 5 Extension, Target $112,608I provide an update to the Bitcoin Elliott Wave primary wave counts. Here's a few things to note:
1. Primary Wave 3 = Primary Wave 1. Wave 3 is actually slightly longer than wave 1 but for the purpose of ascertaining whether it extends, we take the position that it did not.
2. Expects Primary Wave 5 extension of at least 1.618x of Primary Wave 1, giving us a target of $112,608.
3. Stop below Primary Wave 4, around $92,750.

Bitcoin's Next Move - $90k Surge Before a Major Drop?Bitcoin is showing signs of a potential rally towards $90k, but could this be a trap before a deeper correction to $45k?
What's your take?
Will CRYPTOCAP:BTC reach new highs first, or is the drop coming sooner?
Share your thoughts!
Please support this idea with a LIKE👍 if you find it useful🥳
Happy Trading💰🥳🤗

Bitcoin Upward Move Is Near
Bitcoin looks like it will have a temporary correction to the upside and then move higher after the interest rate announcement. The $110,000 mark is the main resistance that will be examined in the following analysis.

BTCUSD SIGNAL UPDATE READ THE CAPTAINbtcusd signal technical analysis satup 👇🏼
(btcusd ) sell zone
( TRADE SATUP)
ENTRY POINT (96600) to (96500) 📊
FIRST TP (96200)📊
2ND TARGET (95800) 📊
LAST TARGET (95400) 📊
STOP LOOS (97000)❌
FALLOW RISK MANAGEMENT

BTC is suggesting a potential bearish reversalBitcoin (BTC) is currently exhibiting a head and shoulders pattern near the $96K– GETTEX:97K resistance zone, suggesting a potential bearish reversal. This pattern, characterized by three peaks—the middle being the highest—indicates that the upward trend may be weakening .
The Federal Open Market Committee (FOMC) meeting on May 7, 2025, is a pivotal event for BTC. While the consensus anticipates that the Fed will maintain current interest rates, the market is keenly awaiting Chair Jerome Powell's remarks for hints of future monetary policy directions. A dovish tone could bolster BTC prices, whereas a hawkish stance might exert downward pressure .
Technical analysis reveals that BTC has been trading within a range of $93,399.86 to $97,625.81 over the past 24 hours, with the current price around $96,362. The Relative Strength Index (RSI) stands at 58, suggesting that BTC is approaching overbought territory but hasn't crossed it yet .
A significant support level lies around $88,700, where substantial liquidity could trigger a price rebound if tested. However, if the head and shoulders pattern confirms a breakdown, BTC might retest lower support levels, potentially around $78,000 .
Actionable Insight: Traders should closely monitor the neckline of the head and shoulders pattern and the outcome of the FOMC meeting. A break below the neckline with increased volume could signal a bearish trend, while a dovish Fed stance might invalidate the pattern, leading to bullish momentum.
More Analysis and Trading Ideas on SorooshX

BTCUSD SIGNAL UPDATE READ THE CAPTAINBtcusd signal technical analysis satup 👇🏼
(Btcusd ) Buy zone
( TRADE SATUP)
ENTRY POINT (94600) to (94450) 📊
FIRST TP (95300)📊
2ND TARGET (96000) 📊
LAST TARGET (96600) 📊
STOP LOOS (93600)❌
FALLOW RISK MANAGEMENT ✅


Blow off soon?PSA this is just ripping off Peter Brandt's tweets. I gathered his breadcrumbs and pieced together this analysis.
His most recent comment in April '25 suggested that the recent BTC pullback was a back-test of a long standing reverse H&S formation. He has not provided any charting of this formation afaik but I reverse engineered it and I believe this is the formation he is referring to.
He has also said several times that he feels the peak will be in Sept '25 at around $140,000.
Given this information, we have a rough roadmap of how we ought to get there. The market has cooled off since inauguration day and could be preparing for the blow off top.
Fingers crossed!


Bitcoin - Bitcoin on the Road to $100,000?!Bitcoin is in its descending channel on the four-hour timeframe, between EMA50 and EMA200. If Bitcoin moves downward towards the specified demand zone, we can look for its next buying opportunities.
It should be noted that there is a possibility of heavy fluctuations and shadows due to the movement of whales in the market and compliance with capital management in the cryptocurrency market will be more important. If the downward trend continues, we can buy in the demand range.
In April, Bitcoin recorded a growth of 14.7%, successfully rebounding from a sharp early-month decline that had dragged its price down to $74,901. This level marks Bitcoin’s lowest price point in 2025 so far.
U.S. President Donald Trump, in an interview with NBC News, responded to growing concerns about a possible economic recession by saying that everything would be “fine.” He referred to the current phase as a “transitional period” and expressed confidence that the U.S. economy would perform “extraordinarily well.” When asked directly if he feared a recession, Trump replied, “No,” though he added, “Anything is possible, but I believe we are headed toward having the greatest economy in our nation’s history.”
On the other hand, Ethereum ended April with a 1.58% decline—marking its fifth consecutive month of losses. Over the past year, Ethereum has only seen gains in three months, and it is currently down 36.7% compared to the same period last year.
Strategy, formerly known as MicroStrategy, announced its intention to invest up to $84 billion in Bitcoin. The funds will be raised evenly through stock issuance ($42 billion) and debt securities ($42 billion).
In the first quarter of 2025, Strategy reported a profit of $5.8 billion from its Bitcoin investments, achieving a return of 13.7%. The company has also raised its annual targets, increasing its projected Bitcoin return from 15% to 25% and its dollar profit goal from $10 billion to $15 billion.Meanwhile, the short-term holder profit/loss ratio for Bitcoin has returned to a neutral level of 1.0, indicating balance between coins held at a profit and those at a loss. Historically, this level has often served as resistance during bearish phases. If prices remain above this point, it could signal strengthening momentum and a potential market recovery.
Elsewhere, reports indicate that Apple has violated a previous antitrust ruling by continuing to restrict users from accessing alternative payment methods outside of the App Store. The decision, issued by Judge Yvonne Gonzalez Rogers, now requires Apple to allow apps—including those related to crypto and NFTs—to operate without paying fees or seeking special approval. This ruling immediately strips Apple of its ability to collect commissions on out-of-app purchases and prohibits the company from monitoring or tracking such transactions.

BTC has reached 88.5kBTC has reached 88.5k as per today, my target previously was 88k but I got out too soon at 86k (I got the weak hands syndrome for a bit, I blame the market its been too choppy)
So what do I see BTC doing next?
In all honesty BTC is looking very strong, I am sure the trend will continue but 88.5 has been a very strong point of resistance so I would say wait for the price to go over resistance before buying (this is my case) or wait for the price to retest the support and hold before buying.
Supports going down will be at around 86.7k and 85.1k The strongest support going down is the 83,5k I don't think it will go that low, but just in case it did and we don't see the huge red candles of death, then there is a chance that BTC will reverse and make it to the next resistances which are at around 95.2k and 109.3k
But one thing is for sure it makes no sense from a market maker's perspective to test low supports again because 88.5k will still be resistance again! So it makes more sense to just jump into 89-92k hold prices there and start going sideways there, so the alts can pump after.
Anyhow put stop loses up, do your diligence and don't trust any body else's advice not even mine, I can be wrong and I have been wrong, so let's not get rekt and enjoy the uptrends.

bullishLook for potential Reversal bullish candlestick formation upon the retest of daily demand zone
