BULLUSD trade ideas

Bitcoin towards 75,000 if breaks 85,150 on day closeBitcoin has broken important support zones.
It has next major support on 85,150, day close below this will take bitcoin to below targets;
80,000 / 75,000
on a worst case it can touch 73,573.
SL: 85,150

Key Insights: Financial Markets Transformation by 2030For years, this page has been my space to share in-depth market research and personal insights into key financial trends. This post reflects my perspective — a strategic outlook on where I believe the digital finance industry is heading.
The financial world is evolving at an unprecedented pace, and it's easy to overlook subtle shifts. But the undeniable fact is that we are now standing at the intersection of three powerful industries — financial markets, blockchain, and artificial intelligence. We are positioned at the cutting edge of technology, where innovation is not a future concept but a present reality.
This post serves as a reference point for future trends and a guide to understanding the transformative forces shaping financial markets by 2030. These are not just facts, but my vision of the opportunities and challenges ahead in this rapidly converging digital ecosystem. Staying ahead today means more than following the market — it means recognizing that we are part of a technological shift redefining the core of global finance.
📈 1. Electronic Trading Evolution
Full transition from traditional trading floors to AI-driven digital platforms.
Integration of blockchain and smart contracts ensures transparency, automation, and risk reduction.
Real-time data analytics democratizes market access and enhances strategic decision-making.
🤖 2. Algorithmic Trading Growth
Accelerated by AI, machine learning, and big data analytics.
High-frequency trading (HFT) boosts efficiency but introduces new volatility factors.
Adaptive algorithms dynamically adjust strategies in real time.
Strong focus on regulatory compliance and ethical standards.
🔗 3. Tokenization of Real World Assets (RWA)
Transforming asset management with projected growth to $18.9 trillion by 2033. (now 18.85B)
Enhances liquidity, accessibility, and transparency via blockchain.
Institutional adoption is driving mainstream acceptance.
Evolving regulations (DLT Act, MiCA) support secure tokenized ecosystems.
🏦 4. Institutional Adoption & Regulatory Frameworks
Digitalization of fixed income markets and exponential growth in institutional DeFi participation.
Key drivers: compliance, custody solutions, and advanced infrastructure.
Global regulatory harmonization and smart contract-based compliance automation are reshaping governance.
💳 5. Embedded Finance & Smart Connectivity
Embedded finance market to hit $7.2 trillion by 2030.
Seamless integration of financial services into everyday platforms (e-commerce, mobility, etc.).
AI, blockchain, and IoT power real-time, personalized financial ecosystems.
Smart contracts reduce operational friction and enhance user experience.
🛡 6. Financial Crime Risk Management
Market expected to reach $30.28 billion by 2030.
AI-driven threat detection and anomaly monitoring strengthen AML compliance.
Blockchain ensures data integrity and automates cross-border regulatory adherence.
Global collaboration (FATF, EU AML) fortifies defenses against evolving financial crimes.
🌍 7. Consumer Behavior & Financial Inclusion
Digital banking bridges the gap for underbanked populations, especially in emerging markets.
Mobile solutions like M-Pesa revolutionize access to financial services.
Biometrics, microfinance, and AI-powered engagement tools foster inclusive economic participation.
🚀 Conclusion
By 2030, financial markets will be defined by technology-driven efficiency, regulatory adaptability, and inclusive growth.
Success will favor those who embrace innovation, leverage automation, and engage in cross-sector collaboration.
The future belongs to agile stakeholders navigating a landscape shaped by AI, blockchain, tokenization, and smart finance connectivity.
Best regards, EXCAVO
_____________________
Disclosure: I am part of Trade Nation's Influencer program and receive a monthly fee for using their TradingView charts in my analysis.

Last Dump On BTC Be SURE TO BUY ITHi im here again we will see a last dump on btc to 89-90k be sure to buy it and don't miss the chance

GOLD VS BTC, who will outperform in the coming weeks?The price of gold has risen by over 20% since the beginning of the year on the commodities market, and the price of bitcoin has returned to equilibrium following a strong rebound in its price since the beginning of April. These two markets follow certain identical correlations, in particular an inverse correlation with the underlying trend of the US dollar on the foreign exchange market. For some, bitcoin has become digital gold since the development of BTC spot ETFs in the USA.
With gold's upward trend seemingly running out of steam in the short term, how can we determine which of the two assets will outperform the other over the coming weeks?
1) The BTC/GOLD ratio as a decisive barometer
Technical analysis of financial markets brings together a number of tools to study the trend and momentum of a financial asset. It also enables comparisons to be made between financial assets, and in particular between two markets.
The ratio tool is used to determine whether one asset outperforms or underperforms another. The ratio consists in creating the curve of a mathematical fraction between a numerator and a denominator, like the BTC/GOLD ratio.
If the trend of this ratio is upwards, then it is the numerator (in this example, BTC is the numerator) that is in an outperformance phase, and the denominator (GOLD in this example) that is in an underperformance phase. The reasoning is reversed if the ratio trend is bearish.
The message of technical analysis currently applied to the BTC/GOLD ratio is unambiguous, with the underlying trend of the BTC/GOLD ratio being bullish. The chart presented here shows the Japanese candlesticks in weekly data, and a double technical support has just kick-started the rise in this ratio: a bullish chartist channel and the ichimoku system cloud.
2) Bitcoin's bullish cycle linked to the halving of spring 2024 ends at the end of 2025
According to the BTC/GOLD ratio, we can therefore consider a sequence of outperformance by the bitcoin price against the gold price over the coming weeks. This anticipation seems credible, given that BTC's bullish cycle linked to the halving of the year 2024 is still far from over. In fact, bitcoin's 4-year cycle always ends at the end of the year following the halving year, i.e. at the end of 2025 for our current cycle.
3) Gold is in extreme technical overbought territory on long-term charts
Technically speaking, monthly momentum indicators are showing extreme overbought territory, which may seem excessive, but no bearish divergence has yet appeared.
We must therefore remain attentive, but not yet jump to conclusions about the end of the bullish cycle. At the current price, GOLD is clearly in a phase of high bullish maturity, and closer to the end of the bull cycle than the beginning.
DISCLAIMER:
This content is intended for individuals who are familiar with financial markets and instruments and is for information purposes only. The presented idea (including market commentary, market data and observations) is not a work product of any research department of Swissquote or its affiliates. This material is intended to highlight market action and does not constitute investment, legal or tax advice. If you are a retail investor or lack experience in trading complex financial products, it is advisable to seek professional advice from licensed advisor before making any financial decisions.
This content is not intended to manipulate the market or encourage any specific financial behavior.
Swissquote makes no representation or warranty as to the quality, completeness, accuracy, comprehensiveness or non-infringement of such content. The views expressed are those of the consultant and are provided for educational purposes only. Any information provided relating to a product or market should not be construed as recommending an investment strategy or transaction. Past performance is not a guarantee of future results.
Swissquote and its employees and representatives shall in no event be held liable for any damages or losses arising directly or indirectly from decisions made on the basis of this content.
The use of any third-party brands or trademarks is for information only and does not imply endorsement by Swissquote, or that the trademark owner has authorised Swissquote to promote its products or services.
Swissquote is the marketing brand for the activities of Swissquote Bank Ltd (Switzerland) regulated by FINMA, Swissquote Capital Markets Limited regulated by CySEC (Cyprus), Swissquote Bank Europe SA (Luxembourg) regulated by the CSSF, Swissquote Ltd (UK) regulated by the FCA, Swissquote Financial Services (Malta) Ltd regulated by the Malta Financial Services Authority, Swissquote MEA Ltd. (UAE) regulated by the Dubai Financial Services Authority, Swissquote Pte Ltd (Singapore) regulated by the Monetary Authority of Singapore, Swissquote Asia Limited (Hong Kong) licensed by the Hong Kong Securities and Futures Commission (SFC) and Swissquote South Africa (Pty) Ltd supervised by the FSCA.
Products and services of Swissquote are only intended for those permitted to receive them under local law.
All investments carry a degree of risk. The risk of loss in trading or holding financial instruments can be substantial. The value of financial instruments, including but not limited to stocks, bonds, cryptocurrencies, and other assets, can fluctuate both upwards and downwards. There is a significant risk of financial loss when buying, selling, holding, staking, or investing in these instruments. SQBE makes no recommendations regarding any specific investment, transaction, or the use of any particular investment strategy.
CFDs are complex instruments and come with a high risk of losing money rapidly due to leverage. The vast majority of retail client accounts suffer capital losses when trading in CFDs. You should consider whether you understand how CFDs work and whether you can afford to take the high risk of losing your money.
Digital Assets are unregulated in most countries and consumer protection rules may not apply. As highly volatile speculative investments, Digital Assets are not suitable for investors without a high-risk tolerance. Make sure you understand each Digital Asset before you trade.
Cryptocurrencies are not considered legal tender in some jurisdictions and are subject to regulatory uncertainties.
The use of Internet-based systems can involve high risks, including, but not limited to, fraud, cyber-attacks, network and communication failures, as well as identity theft and phishing attacks related to crypto-assets.

Bitcoin (BTC): Zone Broken | Bollinger Bands Expanded | Fakeout?Bitcoin has recently broken the major neckline zone, which was supposed to be a zone of ideal shorting position, but buyers overtook that area.
What we are seeing is a possible momentum catch that can happen, which means we might expand to upper zones further and further but at one point price will have a sharp fall, which usually happens when the Bollinger Bands' upper side is being tested so many times.
Ideally, we need to see a form of fakeout happen near current zones which then would give us a good move to lower zones but as of now, we are not seeing any signs of weakness so we wait for it and meanwhile, we look for Break of Structures to form and keep an eye on Bollinger Bands at the same time.
Swallow Academy

BTC PlanContext:
🔵 Open Interest is slightly increasing → healthy position building (likely shorts).
🔵 Top Traders Ratio is decreasing → top traders are positioning short.
🔵 CVD Spot & Futures are declining → no real spot buying support behind the price.
🔵 Funding Rate is neutral → no immediate short squeeze risk.
🔵 Optical Liquidity Map shows a cluster of short liquidations slightly above current price → possible liquidity grab.
Technical Structure:
🔵 Bounce on the Reload Zone (61.8%-78.6%) → normal technical reaction.
🔵 Possible Liquidity Grab just above 95k to clear weak shorts.
🔵 After the grab, expecting a strong rejection to the downside, targeting the CME Gap around 91–92k.
Scenario:
📈 Small upside move to grab liquidity around 95.5k–96k.
📉 Then bearish continuation toward the CME Gap (~91–92k).
Invalidation:
🚫 If strong spot buying steps in and price holds above 96k with strong volume → scenario invalidated.
✅ Otherwise, bearish continuation remains the main probability (70%–75%).

BTC Breaks Out Above Key Resistance Bullish Momentum AcceleratesClassic Technical Breakout:
Bitcoin has surged past the critical $91,607 resistance level, which had capped its upside since February. This breakout marks a major shift in market momentum.
Broader Bullish Structure:
The move confirms a larger bullish structure, defined by a consistent pattern of higher lows and higher highs since the March lows, signaling strong market health.
Accumulation Zone Cleared:
Bitcoin’s breakout from the well-established $76,000–$92,000 accumulation zone further strengthens the bullish outlook, highlighting robust underlying demand.
Road to Six Figures:
Now trading above key psychological and technical levels, Bitcoin appears poised for a potential move toward six figures and a retest of all-time highs above $108,000 — as long as it holds above the breakout zone.
Conclusion:
Momentum is clearly favoring the bulls. Bitcoin’s breakout could mark the beginning of its next major rally phase. 🚀📈
#Bitcoin #BTC #Crypto #Breakout #TechnicalAnalysis #Bullish #Resistance #CryptoMarket #MarketUpdate

BTC Likely to Correct – New Moon EffectThere is a strong potential for Bitcoin to undergo a correction first, with a high probability of forming a swing high. This is indicated by decreasing volume and the appearance of ranging doji candles. If today’s daily candle closes below 93,900, it will serve as a confirmation of the swing high formation.
Downside Targets:
Target 1: 92,000
Target 2: 88,000
Target 3: 86,000
Additionally, there is a potential for the decline to halt around May 12th, which may mark the beginning of a reversal.

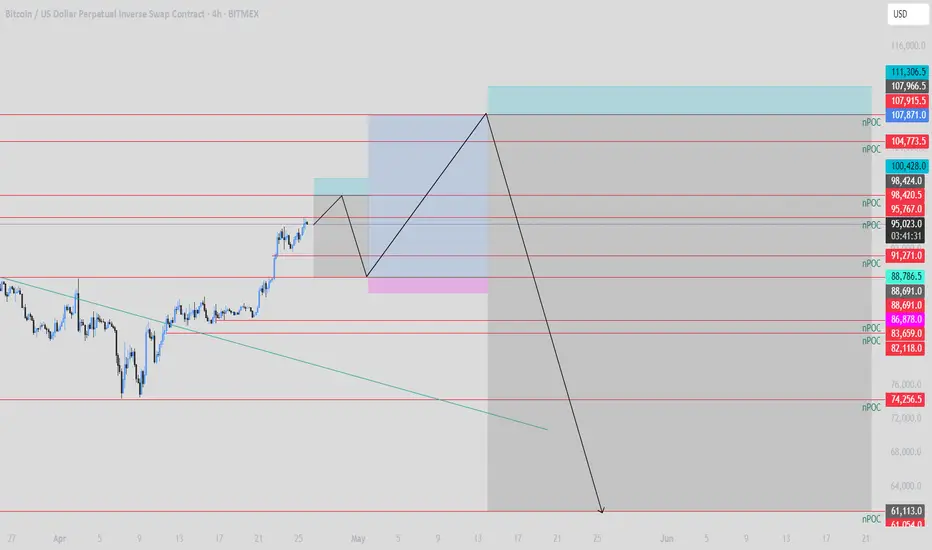
Bitcoin :What is next?These are my 3 major trades for this month and the next one.
First we got that 98k npoc level. After that i will open a nice little short postion until 88k region is tapped. Then i will long until 104k or 107k npoc levels close . I will consider also entering short from 104k region.
I think during the summer btc will go down just like last year .
60k-70k is waiting for btc.
Bitcoin Alternate Bearish CountsThere are quite a number of things I don't like about this count, but then as I've mentioned before, I always keep 2 counts and this will serve as a reference for a bearish scenario.
In terms of risk-reward, for the purpose of trading, I actually favor this count because the stop loss is clear. Sometimes, I trade the alternate count because the risk is much lower than the primary count and a mistake (i.e. loss) can be recovered by flipping the trade direction when I'm stopped out. However, such trading is very involved and active and not recommended for everyone.
Good luck!

Bitcoin Long: Cycle level Wave 5, Primary level wave 5 of 1Over in this video, I discussed the big picture level for Bitcoin and labelled Cycle level waves. I touched on my wrong calls for shorts of Bitcoin and I also went through the updated bullish wave counts.
Big picture wise, I expect Bitcoin to break new high and move to $143,000 as my main price target.

BTCBTC needs more upside above 100K and then will see the reaction.
Disclosure: We are part of Trade Nation's Influencer program and receive a monthly fee for using their TradingView charts in our analysis.

BTCUSD 4 - Hour Chart Market AnalysisBTCUSD 4 - Hour Chart Market Analysis
I. Trends and Patterns 📈
Looking at the 4 - hour chart, the recent performance of BTCUSD has been characterized by complex fluctuations. In the earlier stage, there was a consolidation phase where the price oscillated within a relatively narrow range, forming a roughly rectangular consolidation pattern 📊. During this period, the forces of bulls and bears were relatively balanced 🤝, and the market was in a wait - and - see mode 🕵️. Subsequently, the price broke above this consolidation range and moved upward, indicating that the bulls had taken the upper hand 🐂, driving the price to gradually climb ⬆️.
Currently, the price is in an ascending wedge pattern, a common technical pattern. An ascending wedge is generally regarded as a reversal pattern. In an uptrend, although the price continues to reach new highs, the upward slope gradually flattens, suggesting that the bullish momentum is weakening while the bearish momentum is accumulating 🐻.
II. Key Support and Resistance Levels 📌
Support Levels
93000: This is a crucial support level, located near the lower trend - line of the ascending wedge and also a key low point during previous pullbacks. If the price moves downward, this level is likely to provide strong support. A break below this level may trigger further declines ⚠️.
91500: It is the upper edge of the previous consolidation range. If the price experiences a significant drop, this level may prevent the price from falling further sharply 🛑.
86000: It is the lower edge of the previous consolidation range. If the price continues to decline, this will be an important support line. A break below it may open up a larger downside space 📉.
Resistance Levels
96000: This is the resistance level near the upper trend - line of the current ascending wedge. The price has tested this area several times but failed to break through effectively, indicating strong selling pressure at this level 💥.
97500: It is a higher - level resistance target. If the price can strongly break through the 96000 resistance level and continue to rise, it may test this level 🎯.
⚡⚡⚡ BTCUSD ⚡⚡⚡
🚀 Sell@95000 - 94500
🚀 TP 93000 - 92000
🚀 Buy@92000 - 93000
🚀 TP 95000 - 96000
Accurate signals are updated every day 📈 If you encounter any problems during trading, these signals can serve as your reliable guide 🧭 Feel free to refer to them! I sincerely hope they'll be of great help to you 🌟

BulltrapBTC will push higher into the main resistance zone to grap liquidity.
In my opinion it will be the last bulltrap before a HUGE crash.
What will you do?

BTC - updateBTC - last, most important Level (96K) has been reached.
Let's see if we going to break it.
Note: Total Crypto shows same.

BTC is trading within the equilibrium zone and..Bitcoin is now trading within my equilibrium zone. This will be one to watch for clues about the broader market, as it's currently leading the way.
Good luck, and always use a stop-loss!


what its leftBTC is making higher highs and higher lows, selling power is diminishing, while bulls regain strength in the market. The breakout is imminent.

Bitcoin .618 and two legs Up .crossroads time againthe chart posted of bitcoin . I was looking for a 72500 print it was at 74544 instead sometimes you miss things but now we have two legs up or 1/2 1/2 Not sure yet But will sit and wait . I would NOT want to see it ever go back under79910 ever if it did we will decline well below 74500

SPY/QQQ Plan Your Trade for 4-24 : Carryover PatternToday's Carryover pattern suggests we'll see similar price action today to what we saw yesterday.
We will very likely see a little support in early trading today, followed by a moderate meltdown-type trend.
I'm not expecting much to happen today - but we could get some news or other data that may prompt some type of bigger move in the markets.
Yesterday evening, I shared an "Update" video with everyone. In that video, I highlighted some of my active trades.
I've gotten a few messages from followers asking if I can share more data related to my trades. I'm sorry, but that won't happen in these FREE Plan Your Trade videos.
I shared some of my trades yesterday to highlight how I had moved into a moderate Short/PUT position, trying to stay ahead of the bigger market trend.
In other words, I'm not chasing the nickels. I'm setup to try to profit from the DOLLARS.
Gold and Silver may stay somewhat muted over the next 48 hours. But, I do expect them to try to melt upward.
BTCUSD appears to be setting up a BULL TRAP. I, personally, don't trust this upward price move because it is counter to the EPP price structure. I could be wrong.
But right now, I just don't trust the upside move in BTCUSD, knowing the SPY/QQQ should move into a deeper MAJOR LOW in early May.
Again, these videos are designed to help you build your skills and find your own style of trading.
I really do hope all of you are benefiting from my continued work to deliver these videos.
GET SOME...
#trading #research #investing #tradingalgos #tradingsignals #cycles #fibonacci #elliotwave #modelingsystems #stocks #bitcoin #btcusd #cryptos #spy #gold #nq #investing #trading #spytrading #spymarket #tradingmarket #stockmarket #silver

Eliot's viewFirst, this is a far-fetched analysis that requires months, not days.
Second, this analysis is based on Elliott's principles, which give you my perspective, which may be right or wrong. You should conduct your own analysis.
Third, if you don't like this analysis, that's okay. I'm not here to impress you, but only to provide my perspective. Goodluck

BTC → 𝐁𝐮𝐥𝐥𝐢𝐬𝐡 𝐏𝐫𝐞𝐬𝐬𝐮𝐫𝐞 !!!Bitcoin has completed and broken the ascending triangle in the monthly timeframe, The price is currently supported well, which can increase the price. I expect the price to rise to around 600k .
Give me some energy !!
✨We spend hours finding potential opportunities and writing useful ideas, we would be happy if you support us.
Best regards CobraVanguard.💚
_ _ _ _ __ _ _ _ _ _ _ _ _ _ _ _ _ _ _ _ _ _ _ _ _ _ _ _ _ _ _ _
✅Thank you, and for more ideas, hit ❤️Like❤️ and 🌟Follow🌟!
⚠️Things can change...
The markets are always changing and even with all these signals, the market changes tend to be strong and fast!!
