BTC ready to break out!!!!
Entry
Wait for daily candle confirmation
Price above Moving averages
All 4 timeframes showing bullish momentum
Enter on confirmed bullish daily close
Risk
Stop below recent swing low
Risk 1-2% capital
Size accordingly
Targets
First resistance level at 98k
1.5x measured move
Major psychological level
or floating profit
Management
Confirm daily close before entry
Move stop to breakeven after Target 1
Scale out at targets
BULLUSD trade ideas

Bitcoin - All Time Highs Are Inevitable!Bitcoin ( CRYPTO:BTCUSD ) is still massively bullish:
Click chart above to see the detailed analysis👆🏻
Despite the correction of about -30% which we have been seeing lately, Bitcoin remains in a bullish market. Even if we see another drop of about -20%, this will still just turn into a textbook bullish break and retest and either way, new all time highs will follow on Bitcoin.
Levels to watch: $70.000, $400.000
Keep your long term vision,
Philip (BasicTrading)

BTCUSD:Wait for a breakthroughToday, the price of BTC strongly broke through the threshold of $93,000. Subsequently, it started a rebound trend. After consolidating near $95,500, it failed to further break through the resistance level of $96,000 and dropped back to around $94,000. It may fall again and break below the support level of $93,000.
The breakthrough of these two key price levels will serve as an important dividing line for the subsequent trend of BTC, indicating the direction of its future price movement.
Special Reminder: A number of important economic data will be intensively released this week, and market volatility is likely to increase significantly. It is recommended that everyone trade with caution and strictly control risks.
I am committed to sharing trading signals every day. Among them, real-time signals will be flexibly pushed according to market dynamics. All the signals sent out last week accurately matched the market trends, helping numerous traders achieve substantial profits. Regardless of your previous investment performance, I believe that with the support of my professional strategies and timely signals, I will surely be able to assist you in breaking through investment bottlenecks and achieving new breakthroughs in the trading field.


"BTCUSD | Smart Money Discount Play | Watch the Liquidity Trap"⚡ BTCUSD Analysis - 1H Timeframe | April 27, 2025
📊 Price Action Summary:
BTC has tapped perfectly into the Discount Zone after orchestrating a clean liquidity sweep below the prior lows.
🔥 Key Moves:
Liquidity Grab: We can clearly see those liquidity spikes — textbook fakeout behavior.
ChoCH (Change of Character): After the liquidity sweep, a strong bullish shift (ChoCH) appears, signaling a potential reversal.
Strong Low Created: This strong low within the discount zone is now protected by Smart Money players.
🧠 What's Actually Happening Behind the Scenes:
Retail traders: "It's breaking down! Sell everything!" 🚨
Smart Money: "Thanks for your liquidity. We’re loading up. 🛒"
🧩 Why This Setup Matters:
BTC swept liquidity, trapping sellers.
We saw a bullish change of character — proof of demand stepping in.
Entry opportunity now exists inside the yellow Discount Zone, where risk is minimized and upside is juicy.
🎯 Trade Setup Idea:
Entry: Inside the Discount Zone AFTER confirmation.
Stop Loss: Below the strong low (~93,455) — surgical precision.
Take Profit Zones:
Weak High (~94,500) for first scale-out 🎯
Strong High (~95,773) for the real bag 🚀
💬 Pro Tip:
"Smart Money buys red and sells green. Retail does the opposite."
Watch how BTC reacts around the ChoCH — this is where the BIG BOYS decide the next move. 🧠🔍
🚀 Summary:
✅ Liquidity sweep complete
✅ Change of character confirmed
✅ Discount zone respected
✅ Probability favoring upside expansion
🧘♂️ Be patient, wait for confirmations, and execute with sniper discipline.
✍️ Save this chart, journal it, and study how liquidity manipulation looks in real-time!
➡️ Comment "BULL MODE" if you’re positioning inside the Discount Zone!
➡️ Tag a trader who still thinks markets move randomly. 😂📉📈

btc on bullish move#BTCUSD price have now fully at third pattern which possible move will reach 96300 for price reverse.
Above 95376 have strong bullish range which will reach 96300 for sell retracment, stop loss 95500.
If the third pattern holds strong above 96300 then bullish may continue to move till 98k.

it might be go down I am unsure, but if the price action makes three touches on the top line, it might go down.

(BTC/USD)1H Chart Analysis –Bullish Breakout Setup Toward 98,000Technical Breakdown:
🔹 EMA 9
📉 Orange line (EMA 9 close): $93,233.68
➡️ Price is above EMA, showing bullish strength.
📦 RBR Zone (Rally-Base-Rally)
🔵 Zone: ~$92,000 - $93,000
🛡️ Acts as a support area — price could bounce here if it dips.
🚧 Resistance Zone
📍 Just above current price
📈 A breakout above this zone may trigger a bullish run.
🎯 Target Point: $98,000
🚀 Potential gain: +7.09%
📊 Strong upside target if breakout holds.
🛑 Stop Loss: $90,314.13
⚠️ Placed just below the RBR zone to minimize risk.
Trade Idea Summary:
🔽 Entry: On breakout above resistance
🎯 Target: $98,000
🛑 Stop Loss: $90,314.13
📈 R:R Ratio looks favorable

Buy@92000 - 93000 TP 95000 - 96000 - 9700096000: This is the resistance level near the upper trend - line of the current ascending wedge. The price has tested this area several times but failed to break through effectively, indicating strong selling pressure at this level 💥.
97500: It is a higher - level resistance target. If the price can strongly break through the 96000 resistance level and continue to rise, it may test this level 🎯.
⚡⚡⚡ BTCUSD ⚡⚡⚡
🚀 Buy@92000 - 93000
🚀 TP 95000 - 96000 - 97000
Accurate signals are updated every day 📈 If you encounter any problems during trading, these signals can serve as your reliable guide 🧭 Feel free to refer to them! I sincerely hope they'll be of great help to you 🌟

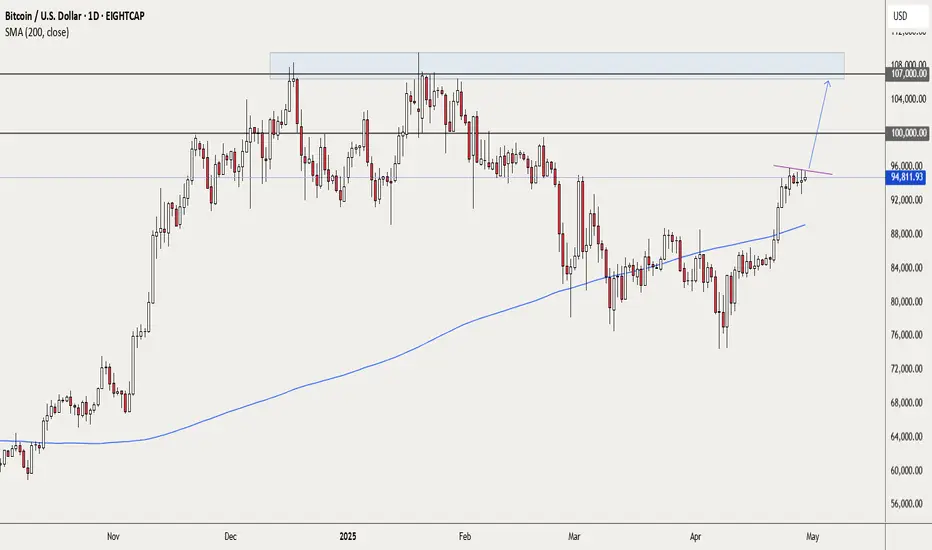
BTCUSD - best to wait a bit for a possible breakoutIf you are not already long on BTC, I would suggest exercising some patience. As my trendline indicates, we have had a few recent attempts to break higher. We have no idea if we will get that breakout or will price decline again. My approach would be to wait for a daily candle that closes above the trendline.
If that happens, I would place a pending long trade above the high of that breakout candle, stop placement below the recent swing low and 1st target at the round number 100,000.
Depending on the price action, a second target around 107,000 also looks possible.
This is not a trade recommendation; it’s merely my own analysis. Trading carries a high level of risk, so only trade with money you can afford to lose and carefully manage your capital and risk. If you like my idea, please give a “boost” and follow me to get even more. Please comment and share your thoughts too!!
It’s not whether you are right or wrong, but how much money you make when you are right and how much you lose when you are wrong – George Soros
April 29 Bitcoin Bybit chart analysisHello
It's a Bitcoinguide.
If you have a "follower"
You can receive comment notifications on real-time travel routes and major sections.
If my analysis is helpful,
Please would like one booster button at the bottom.
This is the Nasdaq 30-minute chart.
There will be an indicator announcement at 11 o'clock in a little while.
After the 4-hour chart MACD dead cross was imprinted yesterday
Today, two things are clear
*Red finger strong rise or purple finger major rebound.
The main issue was whether the 6-hour chart MACD dead cross occurred
After writing the analysis, looking at the overall movement
The purple finger seems strong today.
Let's apply it to Bitcoin as it is.
This is a 30-minute Bitcoin chart.
At the bottom left, I connected the long position entry point of $93,046 that I entered in the analysis article on the 25th.
Bitcoin and Tether dominance are moving sideways.
Bitcoin is slightly more advantageous in terms of MACD signals or Ichimoku Kinko Hyo,
but it is not strange if one side skyrockets or plummets.
While moving sideways, I was watching Nasdaq,
and I paid attention to the Nasdaq movement.
*Red finger movement path
One-way long position strategy
1. 94242.4 dollar long position entry section / green support line breakaway stop loss price
2. 96005.1 dollar long position 1st target -> Top 2nd target -> Final Good
The 1st section at the top is the rising wave position
If you touch it first, the possibility of success of the strategy increases.
If the strategy is successful, it would be good to use it as the final long position re-entry.
Depending on the adjustment coming out of Nasdaq, it can be pushed up to section 2
Roughly, it is the support line of the Bollinger Band 6-hour chart.
If the rebound fails in Nasdaq
Bottom -> Please note that it can be pushed to section 3.
Up to this point, please use my analysis as a simple reference and use.
Thank you.

Bitcoin Struggling on Resistance Level#Bitcoin at present Trading around $94-95k
Into
Its most significant and very strong Resistance point..
To analysing,
the market next sequence of moves
Towards,
Either a big Rejections or a little Perfection..🙏
Anyways,
For detailed information,
Must visit my weekly chart based Analysis, that's already posted previously..
And...
#DYOR always & Trade with #StopLoss in #Crypto
We can see a little drop to hit 100SMA Bitcoin many times have bounce from the 100 SMA 1H. Are we gonna see that he will bounce one more time this time??.

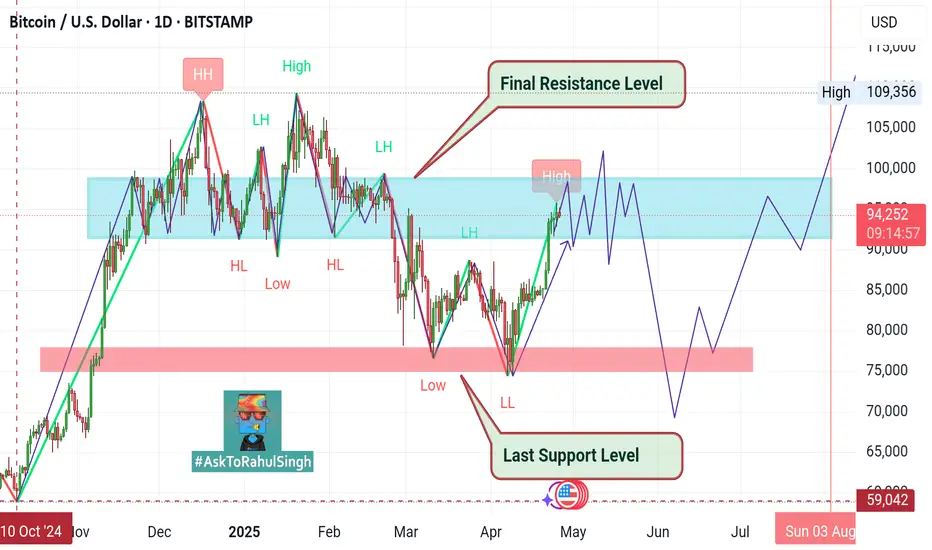
Resistance Test: Close Longs and Wait for SetupsWe've reached the zone from where a strong sell-off started back at the end of February. This area is now acting as resistance, and as we approach it, it makes sense to lock in longs — if you were holding any.
I’m not planning to short on a potential pullback; I'd rather wait for a deeper correction and then look for new long setups. The asset remains in an uptrend on the weekly chart, and as long as we stay above 74,500, I don't see any reason for confident short trades.
📝Trading Plan:
Long entries:
1. After a pullback — watching for bullish candlestick confirmations.
2. On a strong breakout above 96,300.
BTCI expect Bitcoin to move between 75k and 90k until it breaks out in one direction.
I hope to see further growth up to 120k. There is also a small chance to reach 150k, but for now it looks unlikely.
At the same time, there is a risk of a drop to the 50k–60k area, which would be about a 50% correction from the top, similar to what happened in 2021.

BITCOIN BEARS ARE STRONG HERE|SHORT
BITCOIN SIGNAL
Trade Direction: short
Entry Level: 95,374.46
Target Level: 87,760.19
Stop Loss: 100,463.39
RISK PROFILE
Risk level: medium
Suggested risk: 1%
Timeframe: 9h
Disclosure: I am part of Trade Nation's Influencer program and receive a monthly fee for using their TradingView charts in my analysis.
✅LIKE AND COMMENT MY IDEAS✅

BTC/USD Price Action Update – April 29, 2025📊BTC/USD Price Action Update – April 29, 2025
🔹Current Price: 94,371.51
🔹Timeframe: 1H
📌Key Supply Zone (Resistance):
🔴95,781.91 – Major Resistance (previous swing high)
📌Key Demand Zone (Support):
🟢91,711–92,122 – Strong Demand Zone (major bullish origin area)
📈Bullish Outlook:
Price is consolidating between resistance and demand. If BTC holds above 94,000 and builds bullish momentum, we could see a retest of the 95,781 high. Breakout above 95,781 may trigger further upside.
📉Bearish Outlook:
Failure to hold 94,000 could lead to a drop toward the 91,711–92,122 demand zone. Watch for reaction at demand to find potential reversal opportunities.
⚡Trade Setup Tip:
✅Wait for clean break and retest above 94,500 for bullish continuation
✅Look for longs at 91,711–92,122 with confirmation
✅Use stop-loss carefully to protect against sharp moves
#BTCUSD #BitcoinAnalysis #CryptoTrading #SmartMoneyConcepts #PriceAction #FXFOREVER #CryptoUpdate #SupplyAndDemand #BreakOfStructure #MarketUpdate

btc . w4 - wknd . SHORT but cautious - yet paytientfriday plan, was to SHORT (see prvs post)
sell zone
starts . friday open
ends . monday open
entry . 95.542
sl . -2.62%
10 sell orders . 1.52% spread
tp1 . 91.642 . +3.99%
funding . +0.01%
we are according to plan + collecting funding
tp1 adjusted to moderate, since bullish outlook coming from april.
tp2 . +10.11%

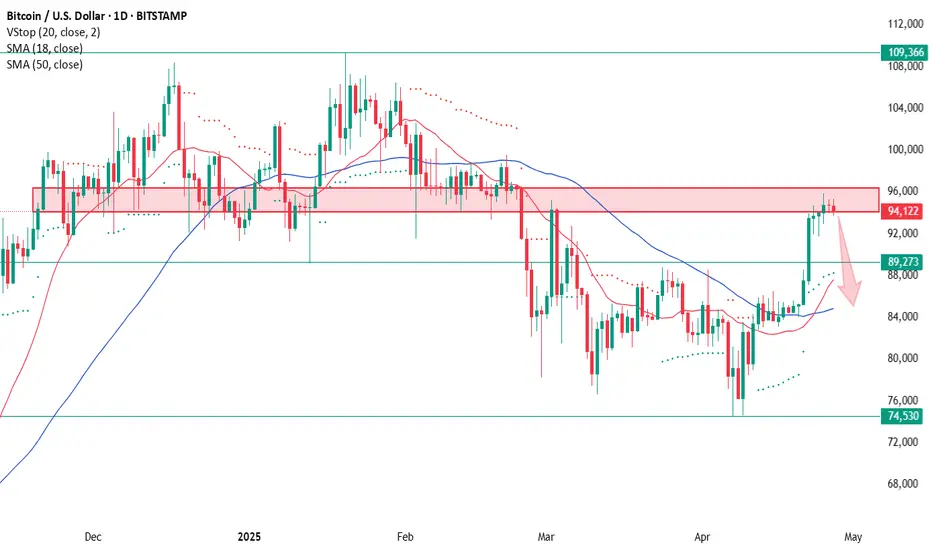
Bitcoin bulls are on the offensive; is a correction ahead?Monthly bullish outside candle
Versus the US dollar (USD), Bitcoin (BTC) is poised to snap a two-month decline and pencil in a bullish outside candle on the monthly chart (textbook engulfing candles focus on the candle’s real bodies rather than upper/lower wicks). Additionally, it is important to observe that the Relative Strength Index (RSI) failed to break the neckline of a double-top pattern, circling above the 50.00 level and indicating bullish interest.
Daily support calls for attention
Across the page on the daily timeframe, since coming within a stone’s throw of testing support at US$73,575, BTC/USD bulls have been on the offensive. Running above the 200- and 50-day simple moving averages at US$81,139 and US$86,425, respectively, as well as trendline resistance (taken from the all-time high of US$109,580) and resistance from US$88,622 (now possible support), this has unearthed the widely watched US$100,000 barrier as a possible upside target.
With monthly flow on the verge of establishing a bullish outside candle, and scope for additional outperformance evident on the daily chart to at least US$100,000, a retest of US$88,622 as support could prompt a bullish scenario. Consequently, a possible downside move in the short term might be on the table before targeting US$100,000 as per the red arrows.
H1 ascending channel in view
On the H1 chart, price action has been carving out an ascending channel since last week, taken from US$91,713 and US$94,676. This has helped identify slowing momentum, visible through price action, which was unable to reach the upper channel on two occasions (red circles). Decreased appetite for higher levels can also be observed through the RSI trending lower since hitting highs of 82.00.
Given the above chart studies, I feel a breakout beneath the current H1 channel would help reinforce the possibility of downside towards at least H1 support at US$89,677, conveniently sited nearby daily support mentioned above at US$88,622. And, assuming a move lower to the said support area, I would then expect bulls to attempt to make a stand and aim at higher levels: at least US$100,000.
Written by FP Markets Chief Market Analyst Aaron Hill

Weekly-Analysis:Bitcoin (BTC)–Issue 275 (Free access)The analyst believes that the price of BTCUSD will increase within the time specified on the countdown timer. This prediction is based on a quantitative analysis of the price trend.
___Please note that the specified take-profit level does not imply a prediction that the price will reach that point. In this framework of analysis and trading, unlike the stop-loss, which is mandatory, setting a take-profit level is optional. Whether the price reaches the take-profit level or not is of no significance, as the results are calculated based on the start and end times. The take-profit level merely indicates the potential maximum price fluctuation within that time frame.

BTC UpdateIn my view we're still in a bullish cycle but in the short term bearish trend is not over so current retracement will stop @101k target where bearish shor term trend will restart to test 65k before massive bullish reverse to new ATH @137k where bull cycle will finish and a long term bear cycle will start.

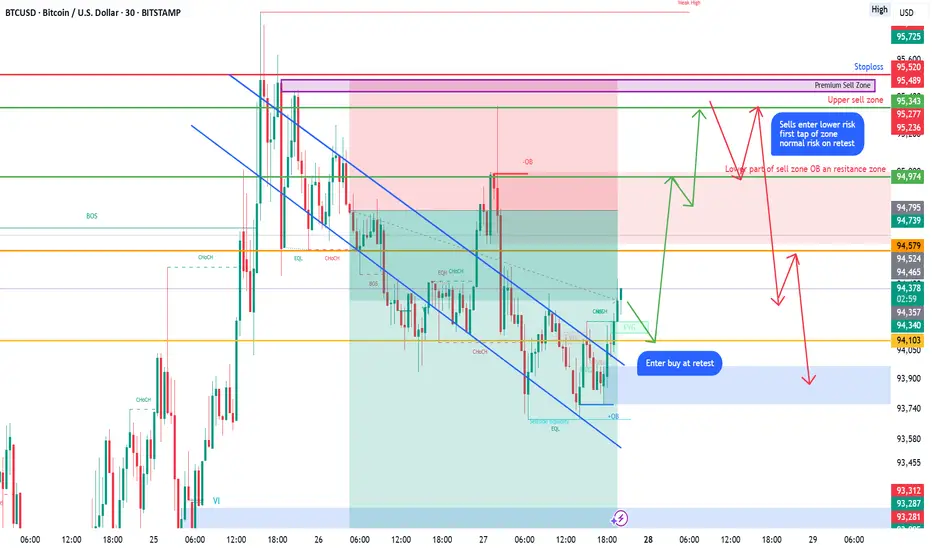
BTC set upBTC Outlook Update 📈🔎
Currently running risk-free on buys from the channel breakout — always a good spot to be in. 🛡️
I've already set up for potential re-entries targeting my main sell zone. 🎯
Original TP is sitting around the 61.8% fib retracement, close to a key bearish order block. Watching closely to see if price breaks through for more upside or rejects for a reversal. 🔥
The premium sell zone is built off FVG + resistance — waiting on clear confirmation before any sells. No rush to force trades between zones without strong confluence. 🧠
Also shared this setup with my members — open to any feedback, different perspectives, or things you spot that could help sharpen the plan! 👀👇
#CryptoTrading #BTCAnalysis #PriceAction
"BTC Just Triggered ChoCh! Are You Ready For The Next Big Play?"⚡ BTCUSD Analysis - 15M Timeframe | April 28, 2025
📈 What's Happening:
BTC hunted liquidity above the previous highs (notice those $$$ grabs 🔥).
A sharp sell-off followed = Clear ChoCh (Change of Character) printed.
Price is now marching back into the Fair Value Gap sitting right inside the Premium Zone.
🚨 Critical Levels Highlighted:
Strong High = Ultimate invalidation for bears if price closes above.
Fair Value Gap (FVG) = First supply area.
Order Block (OB) = Deeper, higher probability short zone.
🧠 Key Observations:
Smart Money grabbed liquidity to trap breakout buyers.
Now price retraces into the imbalance = prime sniper setup.
🎯 2-SCENARIO PLAN:
Plan A — Short Setup (Main Bias):
✅ Wait for rejection signs inside FVG or OB.
✅ Trigger short entries only after bearish structure forms (M5 or M1 timeframe).
✅ TP1 = Previous minor low. TP2 = Weak Low (~92,800 zone).
✅ SL = Above Strong High (~95,400).
Plan B — Breaker Play (Alternative):
✅ If price smashes through OB + Strong High with strength, flip bias.
✅ Look for bullish Breaker structure (retest + continuation).
✅ Target fresh liquidity zones above.
📊 Risk Management Tip:
"React to confirmation, not prediction. Let price prove itself before you jump."
🧘♂️ Summary:
✅ Liquidity swept
✅ ChoCh confirmed
✅ Premium Zone retest incoming
✅ High Risk-Reward opportunity forming
🔥 This is where patience = profits.
➡️ Mark this setup, and let's trade like Smart Money, not like retailers.
➡️ Comment "PATIENT SNIPER" if you’re waiting for the perfect trigger!
