BTC/USD Technical Outlook📊 BTC/USD Technical Outlook
Rounded Top Formation signals exhaustion of bullish momentum.
Price respecting a descending channel, showing structured bearish correction.
Supply Zone: $96K–$100K – major resistance; price likely to reject here if tested.
Key Levels:
Support: $80.5K → $74.7K → $56K → $48.6K → $39.7K
Resistance: Descending trendline & supply zone
Two Scenarios:
✅ Bullish: Break above channel + $96K = retest ATH zone.
❌ Bearish: Rejection + break below $74.7K = targets $56K and lower.
Current Bias: Bearish unless breakout confirms above descending structure. 📉 Fundamental View
Bitcoin Halving supports long-term bullish case.
Fed’s policy & inflation will drive short-term volatility.
Institutional news already priced in; any surprises = big moves.
BULLUSD trade ideas

BITCOIN WEEKLY ANALYSIS - April 18th, 2025BTC/USD is currently hovering just below a major descending trendline and key horizontal resistance near the 91,500 level. 🧱
🔍 What We’re Watching:
- Price has tested the downtrend line multiple times — the structure is weakening.
- A breakout above 87,500 could trigger a strong bullish move.
- Until then, "Wait for the Breakout" remains the strategy. No confirmed long entries yet.
📉 Current Price: $84,500
📈 Breakout Confirmation: Clean close above resistance zone + volume spike = 🔥🔥 potential rally.
🧠 Pro Tip: False breakouts are common. Watch for confirmation — not just a wick!
Stay sharp, stay patient. Breakouts give the best reward-risk trades! 💹

Free Masterclass? Need Follower InputHey Traders! 👋
To anyone who’s been following my journey, you already know—my only real priority is to share the knowledge and specialized analysis I’ve built up over time with as many people as possible.
I post videos as often as I can, especially when I feel something is brewing on the charts, to give you my clearest insights into how I approach the market. The hope is that you can take these tools, replicate the thought process, and make the most out of your own trading and financial path.
But as I sit here about to make another video, I had a realization—this is so much bigger than just one chart or one video.
I want to teach this in a way that’s immersive and personal, so we can learn, grow, and spread this knowledge together as a team.
So here’s my proposal:
I’d love to host a (free, of course) “masterclass” session for anyone interested in digging deeper into how I read and understand the market. It’ll be super relaxed—a Zoom session where you can ask questions, share what you’ve learned, and connect with other like-minded traders along with learning from me in a live and direct setting.
If this interests YOU, just comment below or DM me privately. If I get 15+ replies, I’ll officially organize it and share the date, time, and Zoom link.
I’m honestly so excited to do this. There’s only so much I can cover in 5–15 minute videos, and I’d love to build something from the ground up. Maybe it turns into a 10-hour marathon, or maybe we start with 2 hours and take it from there—but let’s just start.
To my 1,100+ followers—let me know what you think. I want to give you the best possible way to learn this incredible way of seeing the market.
Wishing you all the best &
Happy Trading :)

BTCUSDHello, traders
After the rejection on 4hr Supply Zone, breaker Block was formed on M15 chart to confirm the trend reversal.
1st T.P @ $78400 level
2nd T.P @ $74600

Btc october 2025 local top?#Bitcoin bull run is not over yet, there is a high probability that we will see a local top by October and also the possibility of the next local bottom in October 2026 is also in the plan.
CRYPTOCAP:BTC

BITCOIN is kissing a critical resistance zone.BITCOIN is kissing a critical resistance zone.
Bitcoin is currently kissing a critical resistance zone, hovering around the $85,500 level. This region aligns closely with a descending trendline that has historically capped BTC rallies, and this test comes after a sharp recovery from a local low near $74,000, a drop that was triggered in tandem with broader risk-asset selloffs following U.S. tariff announcements and rising global macroeconomic tension.
Technical Analysis
The descending trendline (marked in blue on the chart) acts as a key resistance.
A daily close above $85,800 - $86,200 could confirm a breakout, potentially paving the way for a fresh attempt toward the $90,000 psychological level.
Conversely, failure to break and hold above this resistance could cause a rejection and pullback.
Immediate downside support lies at the previous local low (~$74,000), and below that, the next strong support zone is around $69,000 (yellow block on chart).
Fundamental Backdrop
Bitcoin continues to be driven by macroeconomic news, institutional flows, and growing ETF inflows.
If fundamentals remain bullish, including continued institutional accumulation, favorable regulatory developments, or increased on-chain activity, they could fuel momentum for a breakout.
The market doesn’t reward assumptions — it rewards preparation.
Whether it’s a breakout or a pullback, risk management should always come first. As always, protect your capital before thinking of profit. Use stop-losses, scale your entries, and avoid over-leveraging in volatile zones like this.
What’s your take on BTC at this juncture?
Do you see a breakout brewing, or is this another trap for over-leveraged bulls?
Let’s discuss

Bitcoin's Bounce, Your Weekly Scoop on the Bullish Surge !The market has unfolded as anticipated, aligning with our projections.
Short-Term Outlook: Expect a relatively narrow trading range this week due to the absence of major news catalysts.
Bullish Perspective: We maintain a bullish stance, targeting a price range of $88,000–$92,000.
Local Bottom Confirmation: Bitcoin appears to have established a local bottom. Notably, it diverged from Ethereum, which recorded lower lows, while Bitcoin resisted forming a new low.
Technical Analysis: Last week, Bitcoin respected a daily bullish order block, resulting in a strong upward move.
Key Support Level: This week, an inverse fair value gap (FVG) on the daily chart around $82,400 is expected to act as a liquidity zone and support, with price likely to tap this level and rebound higher.
Thank you for your support! Stay tuned for more insights and drop a Like if you loved it 🚀

BITCOIN BULLISH TO $114,000 - $116,000In Q1 2025 I said I expect a retracement back towards $86,000 - $78,000 as Wave IV retracement.
BTC has now hit our Wave IV target. So according to my report & analysis, our next target is Wave V. Priced around the $114,000 region.
Market Structure Invalidation: $74,450❌

Technical Analysis on BitcoinHey guys
Bitcoin has recently broken out of a long-term descending channel, which has caught the attention of many traders. Typically, once the price stabilizes outside of such a channel with confirmed candlestick closes, buyers enter the market in anticipation of a bullish move. However, it's important to be cautious.
There is still a possibility that the price may retrace to a highlighted liquidity zone below, where it can gather enough momentum and liquidity for a stronger upward movement.
Therefore, traders should be aware of potential false breakouts and wait for solid confirmations before fully committing to long positions.

Bitcoin monthly Simples.
Not financial advice.
Note: support can be broken to the downside but first I expect a leg up

BTC/USDT – Trap Activated: Is the Final Flush Coming?📆 Follow-up to our April 16 idea:
Back then we warned:
“Fake pump to 85.8K, followed by a drop to 81.5K. Tape is rotten, stops are baited, and Delta screams ‘run!’”
Well... here’s what’s happened since:
✅ What’s been confirmed:
BTC pushed into the 85.5K–85.8K trap zone and got rejected hard
Delta turned positive briefly – but with no price continuation
OI stayed flat = no real conviction = stealth distribution
Tape showed clear absorption at the highs
🎯 The trap we predicted is now active. Bulls walked right into it.
❗ What’s still to come (likely very soon):
The final flush of long positions hasn't happened yet.
Updated liquidation maps (1D & 48H) show massive clusters below 82.8K–81.2K full of over-leveraged longs.
⚠️ If price breaks below 83K with volume + strong red delta...
💣 Expect a liquidation cascade.
🧠 Strategy (Still Aligned with April 16)
🔻 SHORT (Primary Idea)
Entry: Rejection at 85.5K–85.8K
SL: 86.2K
TP1: 83.2K
TP2: 81.5K
🔺 LONG (Only if the flush comes first)
Entry: Sweep down to 82.8K + delta reversal + OI spike
SL: 81.8K
TP: 84.8–85.2K
🌍 Updated Macro Context:
USD still strong 💵
Fed not pivoting anytime soon 🏦
Trump’s BTC reserve news = bullish narrative, but no short-term impact yet
📉 Macro still favors risk-off sentiment
🎭 Final Words from the Pôncio Doctrine:
“The trap is active. The stops are aligned.
Now we just wait for one institutional candle to wipe the board.”
If this breaks… you’ve officially been Pônciado.

Btcusd possible sell analysis.This analysis is expected to play out when price break and closes below the 83,659 price on the 4H TF. For entry, wait for a second sell candle close on the 15min TF.
Kindly note that this is for educational/learning purpose only.

BtcusdFirstly my apologies for the messy chart,Pattern broker and retested and I had a three move touch on my resistance marked with a rectangle

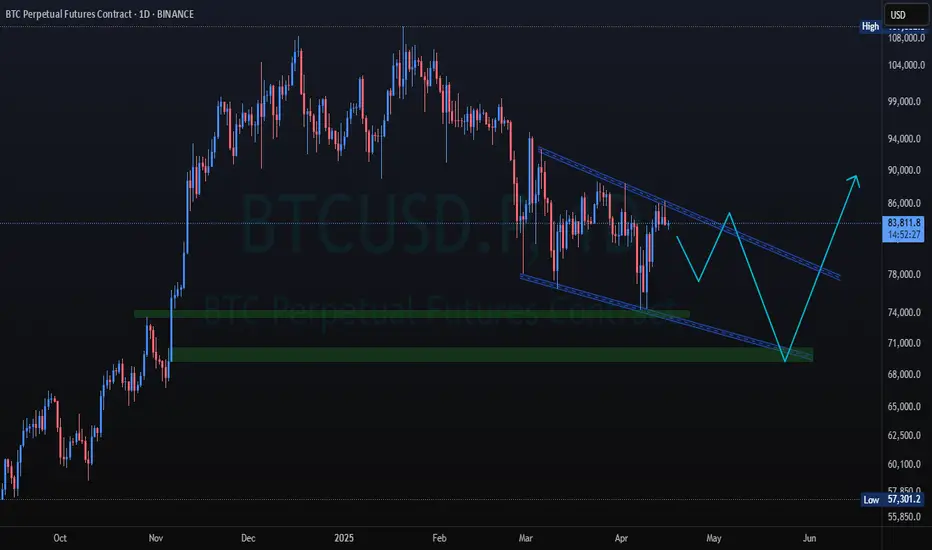
* BTC Elliot Waves Update: 2 Scenarios *I hope everybody has been making money these past few days!
I'm once again bringing an update on the scenarios we currently have.
These are the scenarios I'll be watching for the rest of this week.
Enjoy it!

BITCOIN → Testing trend resistance. Will there be a breakout?BINANCE:BTCUSDT is approaching trend resistance and most likely it may test the liquidity zone and risk zone for sellers (liquidity hunt ?), but does the market have the potential to support the upside?
Bitcoin is strengthening and channel resistance may not stop this growth. Based on the nature of price movement (smooth, gradual, consolidating), bitcoin may test liquidity 84.7K - 88.8K. But it is too early to talk about further growth
On W1, the price is in a trading range (consolidation) between the previously broken global consolidation support and the current support. Short bodies, long shadows speak about consolidation. Also worth noting are the relatively long tails to the downside and the weak market reaction...
Fundamentally, the cryptocurrency market (community as a whole) for the past week did not get anything positive as from the very beginning of this year, the growth can be attributed to the 90-day technical break by Trump, but there are a number of nuances:
- the fire has not yet been put out
- just because they gave a 90-day break doesn't mean everything is fine. It's just a head start for the U.S. to prepare for the situation more thoroughly
- The escalating conflict between the U.S. and China has investors looking for less risky assets like gold. Cryptocurrencies are definitely not on that list.
- Rumors of a US interest rate cut are likely to provide support as well.
Resistance levels: 84700, 88800
Support levels: 78200, 73-74К, 66500
I would not hurry with conclusions about further growth. Growth could be considered if bitcoin overcomes 88800 and consolidates above this zone. But a sharp approach or a false breakout of one of the mentioned liquidity zones may provoke a reversal and fall.
Regards R. Linda!

BITCOIN (BTCUSD): Potential Scenarios Ahead of Powell Speech
Bitcoin is consolidating for 5 days within a narrow range on a daily.
Today's Powell speech can be a trigger for a strong bullish/bearish movement.
Depending on the today's rhetorics, here are potential scenarios.
Bullish
If the price breaks and closes above the resistance of the range (86500),
we can expect upward movement to 87500 resistance.
Bearish
If the price breaks and closes below the support of the range (82500),
Bitcoin may drop way lower and reach 79600 level.
Wait for a breakout and then follow the market.
❤️Please, support my work with like, thank you!❤️

Bitcoin’s Bullish Path: Eyeing the Order Block ZoneIn my personal technical analysis, Bitcoin appears poised to revisit the order block zone between $73,000 and $69,000. If price reacts strongly from this area, following the blue trendlines I've drawn, it could resume its upward trajectory toward the top of the channel. This bullish momentum has the potential to play out through the end of 2025.

BTC STILL STRUGGLINGBitcoin continues to struggle with the 50-day moving average, currently acting as dynamic resistance. Price is hovering just below it, unable to break through cleanly, and the 200 MA remains overhead, adding additional pressure from above.
Market structure remains bearish for now – we’re still printing lower highs and lower lows. That structure won’t flip until Bitcoin can break decisively above $88,804, the last significant swing high from late March. A close above that level would mark a higher high and potentially signal a trend reversal.
Until then, it’s just a relief rally within a broader downtrend. The bulls need to reclaim key levels with conviction – otherwise, this could be a pause before another leg lower.

BTCUSD Liquidity SweepAll my trade entry are based on volume and liquidity and that’s what the market respect.
I’m currently long on BTCUSD

Bitcoin to $70K? My LSTM Model Thinks So📈 Bitcoin to $70K? My LSTM Model Thinks So 🚀
I've been working on an LSTM (Long Short-Term Memory) neural network designed to forecast Bitcoin prices, and the results are exciting. My model analyzes historical BTC data and learns temporal patterns to predict future movements. After extensive training and optimization, it reached an accuracy of around 96% on the training set.
🔍 How it works:
LSTM networks are especially powerful for time-series forecasting because they can capture long-term dependencies and trends in data. I trained my model using historical daily BTC prices, letting it learn the complex patterns and volatility that define crypto markets. The model takes sequences of past prices and uses that context to project the price movements of the next 30 days.
📊 The Forecast:
Based on the model's output, my current prediction is that Bitcoin will reach $70,000 within the next 30 days. This projection isn’t just a guess – it’s backed by a deep-learning model built to handle the chaotic nature of crypto.
⚠️ Note:
While the training accuracy is high, real-world conditions can differ, and models should always be taken as tools—not certainties. I’m sharing this analysis to contribute to the community and spark discussion.
Would love to hear your thoughts or see if others are seeing similar trends! 👇
#Bitcoin #BTC #CryptoAnalysis #MachineLearning #LSTM #BitcoinForecast #CryptoTrading

BitcoinBTCUSD
- Falling Wedge as an Corrective Pattern in Long Time Frame
- Break of Structure
- S / R Level
- Completed " 12345 " Impulsive Waves
- Order Block

Bitcoin is very unlikely that it will move like this! (5%)It is more likely that if it can break the channel ceiling from here, it will move to higher numbers, but if not, this can also happen!
BTC/USD Short Setup – Triple Top Reversal with EMA Confirmation Entry Point (Sell): Around $85,699.52
Stop Loss: $86,741.44 (above resistance zone)
Target (Take Profit): $82,982.09
This provides a Risk-Reward Ratio of approximately 1:2, a commonly acceptable ratio in trading.
📈 Indicators:
EMA 30 (Red) is currently above the EMA 200 (Blue), indicating bullish momentum—but this setup anticipates a trend reversal.
If price breaks below the EMAs, that would confirm bearish strength.
🧠 Conclusion:
This setup is based on:
A strong resistance zone,
Bearish reversal pattern (triple top),
Risk management via stop loss and take profit levels.
If you're trading this:
Wait for confirmation with a bearish candlestick below the EMAs or a break of recent support.
Manage position size based on stop distance and your account risk tolerance.
