$BTC cycle projection. Upside to $134k-$160k, then to sub $33kHere's a chart of my cycle projection of bitcoin. I think it's likely that we find support in the $62k region over the next couple of weeks and then continue the bull run up to $129k-$137k.
In terms of gains from here, I think BTC is only a ~2x, however, I think we're going to see our biggest altcoin run since bitcoin's inception.
After we hit the top $134k-160k, I think we'll make a very large correction back down to the $20-30k region (supports on the chart) before the next long term cycle begins.
This is the final wave of the first cycle of bitcoin.
Lots of money to be made.
BULLUSD trade ideas

$BTC Bull Trap Clear As DayI’m probably the biggest 3-Year perma-bull on this app, and even I can tell this is most likely a bull trap.
This is either the beginning of the long awaited parabola, or else we’ll correct back down to at least the 200DMA in the next week, or the 50DMA within the next month.
Lack of volume on the move and RSI becoming overheated gives me feels for the latter
Remember, never trust a weekend pump 💯
Bookmark this.

BTC - Bullish Control, Confirmed!Hello TradingView Family / Fellow Traders! This is Richard, also known as theSignalyst.
🚀 As per my last two setups (highlighted on the chart), BTC rejected the $72,000 support and pushed higher with strength.
📈 This week, BTC broke above the $90,000 structure, confirming a shift in momentum from bearish to bullish.
🟢 For the bulls to stay in control, a break above the $95,200 resistance is still needed.
📊 In the meantime, as BTC retests the $89,000–$90,000 zone, we’ll be looking for medium-term trend-following longs to catch the next impulsive move.
📚 Reminder:
Always stick to your trading plan — entry, risk management, and trade management are key.
Good luck, and happy trading!
All Strategies Are Good, If Managed Properly!
~Rich

Next BTC Peak in Dec 2025?#Bitcoin Duration of Expansion Phases Above Previous All-Time Highs (ATH)
Historically, the time Bitcoin spends above its previous ATH increases with each cycle.
> In 2017, the expansion phase lasted 211 days.
> In 2021, it extended to 285 days, a 74-day increase (+29%).
If this trend continues, the current cycle’s expansion phase (starting Oct 2024) could last 425 days (+29% from 2021), projecting an end in Dec 2025.

Btcusd Btcusd is on a down trend in a weekly and daily time frame so we are expecting btc to crash to 68k then be4 the bullish movement

Say hello to the $110k Bitcoin !The BTC will increase $15K and reach to the top of the wedge in the coming weeks .
Give me some energy !!
✨We spend hours finding potential opportunities and writing useful ideas, we would be happy if you support us.
Best regards CobraVanguard.💚
_ _ _ _ __ _ _ _ _ _ _ _ _ _ _ _ _ _ _ _ _ _ _ _ _ _ _ _ _ _ _ _
✅Thank you, and for more ideas, hit ❤️Like❤️ and 🌟Follow🌟!
⚠️Things can change...
The markets are always changing and even with all these signals, the market changes tend to be strong and fast!!

BTC → 𝐁𝐮𝐥𝐥𝐢𝐬𝐡 𝐏𝐫𝐞𝐬𝐬𝐮𝐫𝐞 !!!Bitcoin has completed and broken the ascending triangle in the monthly timeframe, The price is currently supported well, which can increase the price. I expect the price to rise to around 600k .
Give me some energy !!
✨We spend hours finding potential opportunities and writing useful ideas, we would be happy if you support us.
Best regards CobraVanguard.💚
_ _ _ _ __ _ _ _ _ _ _ _ _ _ _ _ _ _ _ _ _ _ _ _ _ _ _ _ _ _ _ _
✅Thank you, and for more ideas, hit ❤️Like❤️ and 🌟Follow🌟!
⚠️Things can change...
The markets are always changing and even with all these signals, the market changes tend to be strong and fast!!

BTC/USD 1H – Bullish Breakout with FVG Entry & $91K TargetChart Breakdown:
📈 Trend Structure:
BTC is moving in an ascending channel with:
🔵 Resistance Line on top
🟢 Support Line below
🔁 Recently, it broke out above the resistance with a bullish move!
Key Zones & Levels:
🟦 Fair Value Gap (FVG)
This is your potential buy zone:
✅ Entry Point: $86,135
❌ Stop Loss: $85,098
🎯 Target: $91,000
📌 Plan:
Wait for price to retrace into the FVG zone
Look for a bullish bounce ✅
Enter long at $86,135
Set your SL and target accordingly
Risk-Reward Setup:
Risk: Small (below FVG zone) ❗
Reward: Big upside toward $91,000 🚀
Gain Potential: +5.74% ($4,948 per BTC)
Visual Flow:
1️⃣ Price breaks resistance 🔼
2️⃣ Pullback expected to FVG 🔽
3️⃣ Entry triggers around $86,135
4️⃣ Targeting moon shot to $91K 🌕
Conclusion:
This setup shows a bullish continuation with solid RR.
If BTC holds the FVG on a retest, the move to $91K looks likely!

Bitcoin - The Bottom Is In!Bitcoin ( CRYPTO:BTCUSD ) is reversing right now:
Click chart above to see the detailed analysis👆🏻
It was really just a matter of time until Bitcoin actually manages to create a potential short term and longer term bottom. With this monthly candle, bulls are taking over again and starting to buy cryptos quite heavily. The chart just tells us that this is not the end, but rather the continuation.
Levels to watch: $70.000, $300.000
Keep your long term vision,
Philip (BasicTrading)

Bitcoin alert drop to 82kBitcoin’s dancing around $87,000, but the music’s about to stop.
We’ve got early Break of Structure (BoS) and clear Change of Character (ChoCH)—momentum’s fading fast.
Right now, I’m watching for a rejection off the upper range, which could trigger a sharp correction.
🔻 Target: $82,000
That’s a ~6% move.
Not massive—but definitely fast.
This isn’t the big drop…
Just a warm-up for something nastier.
You know how it goes—first they shake the weak hands. Then they bite.
Status: Setting up
Confidence: High
Timing: Soon.
You’ve been warned. The Wolf sees it before the pack does.
– Alpha Sigma Wolf
“Not all howls are warnings. Some are confirmations.”
#Bitcoin
#BTC
#BTCShort
#CryptoTrading
#TechnicalAnalysis
#SmartMoneyConcepts
#PriceAction
#BreakOfStructure
#AlphaSigmaWolf
#WolfOfCrypto
#TheWolfSees
#ChoCH

BITCOIN Sell everything in October!Yep, kind of a clickbait title but it doesn't fail to serve justice to this very important Bitcoin (BTCUSD) chart.
Today's analysis displays in the most illustrative way the extremely tight symmetry between BTC's Cycles and how this can help us time our Sell at the Top of the Cycle and equally have the patience to buy as close to the next Bottom as possible.
As you see, in the past +10 years since the 2014 Bear Cycle, every Cycle has almost identical time ranges/ durations. All three Bear Cycles since then, lasted for approximately 1 year, and both Bull Cycles for almost 3 years (152 weeks, 1064 days to be exact). More specifically, the last two Bear Cycles were exactly 1 year long, the 2018 one started on the week of December 11 2017 and ended on December 10 2018 and the next Bear Cycle started on November 15 2021 and ended on November 07 2022. So it's been December-to-December and November-to-November Bear Cycles respectively.
If this high degree of symmetry continues to hold, counting 1064 days from the last Cycle Bottom o November 07 2022, gives a time estimate for the next Cycle Top on (the week of) October 06 2025. If also that holds for the Bear Cycle, expect an October-to-October duration, with an approximate bottom on October 12 2026.
So Sell everything up to October 2025 and Buy back as we get close to October 2026 is the strategy?
Feel free to let us know in the comments section below!
-------------------------------------------------------------------------------
** Please LIKE 👍, FOLLOW ✅, SHARE 🙌 and COMMENT ✍ if you enjoy this idea! Also share your ideas and charts in the comments section below! This is best way to keep it relevant, support us, keep the content here free and allow the idea to reach as many people as possible. **
-------------------------------------------------------------------------------
💸💸💸💸💸💸
👇 👇 👇 👇 👇 👇

The Journey of the Orange SunFrom whispers in the digital void in 2012
to the roaring crowd at $93,000 in 2025 —
Bitcoin’s arc bends not just toward price,
but toward a revolution written in blocks.
Each Fibonacci line is more than math —
it’s prophecy, patience, and power.
The chart doesn’t just show price;
it echoes belief.
Where others see candles,
I see constellations.
And we’re still charting the stars.
🚀📈
#BTC #Bitcoin #CryptoArt #ChartPoetry #FibLevels #BTCUSD

BTCUSD 15MIN RESULT -TP HIT!!TP Hit!!! been a couple hours but it played out.. Look at last post why I took this trade.

Symmetrical Triangle Nearing Resolution: Breakout or Breakdown?BTC/USD H4 Analysis – Symmetrical Triangle Nearing Resolution: Breakout or Breakdown?
📊 Technical Outlook – 4H Timeframe
Bitcoin is currently consolidating within a clear symmetrical triangle, with price tightening ahead of a potential major breakout. The chart shows price testing the upper boundary of the triangle, supported by MA13 and MA34 from below.
Key resistance zones: 86,594 and the extended target zone at 88,753. A successful breakout above this region could trigger a strong rally toward 90,000+.
Key support levels: 81,397 – 78,725 – 75,102, acting as critical retracement zones in case of downside rejection.
The structure suggests two primary scenarios:
Bullish breakout to 86,594 → 88,753, followed by a pullback and continuation higher.
False breakout or breakdown, leading to a sell-off toward 78,725 and possibly down to 75,102 if market sentiment deteriorates.
🌍 Macro Context & Market Sentiment
Investor sentiment remains fragile, impacted by ongoing geopolitical risks and the Fed’s cautious stance on monetary policy.
Altcoins are underperforming, signaling that capital rotation remains limited – often a precursor to short-term correction or distribution in BTC.
Volume is fading as price coils inside the triangle, typically a precursor to a sharp move in either direction.
🧠 Trading Strategy Ideas
Watch closely for price action near 86,594 – 88,753. If rejection or wick rejections occur, short-term pullback trades may be viable.
A breakdown below the triangle support (~84,000 area) could open up downside targets at 81,397 and 78,725.
A clean breakout with volume confirmation? Look for retest buys around 86k with continuation potential.
⚠️ Caution Advised
BTC is in a “calm-before-the-storm” zone. This is not the time to chase moves or overleverage. Let the market confirm direction and trade based on structure, not emotion.
💬 Are you leaning bullish or bearish on BTC’s next move? Will we see 90k or a drop back to 75k? Share your thoughts below! 👇👇👇

Bearish drop?The Bitcoin (BTC/USD) is reacting off the pivot which is a pullback resistance and could reverse to the pullback support.
Pivot: 94,119.93
1st Support: 88,510.65
1st Resistance: 99,362.24
Risk Warning:
Trading Forex and CFDs carries a high level of risk to your capital and you should only trade with money you can afford to lose. Trading Forex and CFDs may not be suitable for all investors, so please ensure that you fully understand the risks involved and seek independent advice if necessary.
Disclaimer:
The above opinions given constitute general market commentary, and do not constitute the opinion or advice of IC Markets or any form of personal or investment advice.
Any opinions, news, research, analyses, prices, other information, or links to third-party sites contained on this website are provided on an "as-is" basis, are intended only to be informative, is not an advice nor a recommendation, nor research, or a record of our trading prices, or an offer of, or solicitation for a transaction in any financial instrument and thus should not be treated as such. The information provided does not involve any specific investment objectives, financial situation and needs of any specific person who may receive it. Please be aware, that past performance is not a reliable indicator of future performance and/or results. Past Performance or Forward-looking scenarios based upon the reasonable beliefs of the third-party provider are not a guarantee of future performance. Actual results may differ materially from those anticipated in forward-looking or past performance statements. IC Markets makes no representation or warranty and assumes no liability as to the accuracy or completeness of the information provided, nor any loss arising from any investment based on a recommendation, forecast or any information supplied by any third-party.

Bitcoin Macro View – Post-Halving StructureThis monthly chart outlines Bitcoin’s long-term ascending channel with key horizontal resistance levels. Following the April 2024 halving (highlighted), price action has continued respecting the macro uptrend with higher lows. Blue projection suggests potential for continued bullish momentum, testing upper channel boundaries into late 2025.
Key zones:
• Major support: GETTEX:23K (2022 low, Fibonacci zone)
• Resistance: $60K–$69K range (previous ATH supply zone)
• Current structure: Bullish continuation above trendline support
Watching for confirmation of a breakout above previous highs, with potential upside extension toward $90K–$100K by 2026 if momentum sustains. 📊🚀
#Bitcoin #Crypto #BTC #TechnicalAnalysis #BTCUSD #HalvingCycle #CryptoTrading #MacroView

#Bitcoin Future Forcast of Final moves towards #BullRunAs per Weekly Chart Analysis,
Bitcoin performing on the perfectly into #ElliottImpulsive waves and its #CorrectionWave and this time the 5th Cycle of Elliott Impulsive Wave was completed and last Correction Wave cycle will under movements.
Now, it is completed the 0 to A-cycle & performing the moves towards B-cycle around $84k to GETTEX:87K and after that final moves towards C-cycle for last Lower-Low point around FWB:67K -65k approx, and that will be completing around next 120-150 days with 0-A-B-C of this cycle around July-August approx..
While, from 0 to A cycle was its first movement point of Retest of lower point, after the Bitcoin's $109k #AllTimeHigh point was at 0 point and $76k is the direction of Point A.
Then, after the completion of this cycle of Correction Wave, Bitcoin's final BullRun movement will be starts around August onwards for next 120-150 days for this season last Bullish cycle to reach out min. $180k to $220k and max. Mark will be around $250k to $280k approx.
Thereafter, the #BearishZone of market will be starts next year, after completion of this Elliott Impulsive & Correction Wave pairings, which is completely starts from Nov. 2022 from its last Lower-Low mark up point of Bitcoin was $15.5k approx.
Anyways,
Study deeply always to perform any trade and take StopLoss strategy for that as well DYOR too...🙏

BTCUSD: a pattern like 2017BTCUSD, as of 2025, resembles the price movements in 2017. In 2017, after Trump was sworn in in January, there was a 38% drop until July. The narrative around this decline is again tariffs. The FED was again coy about cutting interest rates, etc. But as it is now, first the global M2 liquidity increase, then the FED and other central banks started quantitative easing and the minting, and then the customs agreements, and the market boomed. Then there was a 172% increase until September. After a quick correction of 40% in the same month, the top of the cycle was reached, this time with a massive 562% rise.
I predict that we are likely to see similar stories, only the price increases will not be as high as they were 8 years ago. The correction after the swearing-in ceremony was around 32% this year. In terms of technical targets, I expect a summer peak around 146k, followed by another 30-40% correction and then a blow-off top between 206-266k with a final madness and an entry into the bear market. Of course, this is purely a guess, an “educated guess” based on past macro and technical movements and the current situation. The condition that would invalidate all this and make us say “we are entering the bear market early” would be a weekly-monthly close below the 2024 peak at 73.8k. Wick down from there would not break the bull structure, as long as there is no weekly/monthly close. For me, the confirmation on the indicator side is that the Alpha Trend on the weekly chart is not selling. AT has been in a “BUY” position since January 2023.

BTC buy projection.On the daily timeframe btc has created a mini chart of head and shoulders bottom.
Head and Shoulders is à strong buy signal.
If this pattern hold we might start seeing the move to 110k btc soon.

SPY/QQQ Plan Your Trade for 4-24 : Carryover PatternToday's Carryover pattern suggests we'll see similar price action today to what we saw yesterday.
We will very likely see a little support in early trading today, followed by a moderate meltdown-type trend.
I'm not expecting much to happen today - but we could get some news or other data that may prompt some type of bigger move in the markets.
Yesterday evening, I shared an "Update" video with everyone. In that video, I highlighted some of my active trades.
I've gotten a few messages from followers asking if I can share more data related to my trades. I'm sorry, but that won't happen in these FREE Plan Your Trade videos.
I shared some of my trades yesterday to highlight how I had moved into a moderate Short/PUT position, trying to stay ahead of the bigger market trend.
In other words, I'm not chasing the nickels. I'm setup to try to profit from the DOLLARS.
Gold and Silver may stay somewhat muted over the next 48 hours. But, I do expect them to try to melt upward.
BTCUSD appears to be setting up a BULL TRAP. I, personally, don't trust this upward price move because it is counter to the EPP price structure. I could be wrong.
But right now, I just don't trust the upside move in BTCUSD, knowing the SPY/QQQ should move into a deeper MAJOR LOW in early May.
Again, these videos are designed to help you build your skills and find your own style of trading.
I really do hope all of you are benefiting from my continued work to deliver these videos.
GET SOME...
#trading #research #investing #tradingalgos #tradingsignals #cycles #fibonacci #elliotwave #modelingsystems #stocks #bitcoin #btcusd #cryptos #spy #gold #nq #investing #trading #spytrading #spymarket #tradingmarket #stockmarket #silver

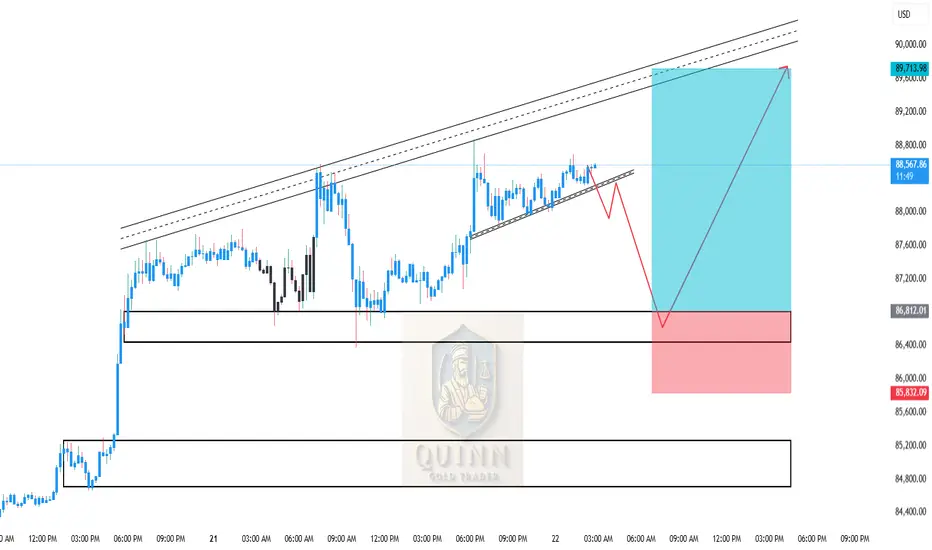
BTCUSD Intraday Move 22-04-2025📊 BTCUSD Analysis – April 22, 2025
Price action is currently forming a rising wedge, typically a bearish pattern, indicating that a short-term correction may occur before the next bullish impulse. The structure shows consolidation with weakening momentum, suggesting that a pullback to demand zones is likely.
We have two strong support zones identified:
Zone 1: 86,400 – 86,800 — minor support from recent consolidation.
Zone 2: 84,700 – 85,100 — major demand area aligned with previous breakout and price reaction.
A retracement into either of these zones offers high-probability buy opportunities for continuation toward the upper resistance trendline and prior high near 89,700.
📈 BTCUSD Buy Signal:
Buy Entry #1: 86,400 – 86,800
Buy Entry #2: 84,700 – 85,100
Take Profit: 89,700
Stop Loss:
For Entry 1: Below 86,200
For Entry 2: Below 84,500
Trade Idea: Wait for bullish price action (engulfing candle, pin bar, or volume spike) before entering.
BTCUSD – Double Top Reversal Setup with Bearish TargetsBased on the BTC/USD 4H chart you shared, here’s a detailed breakdown of the technical analysis:
---
🟠 Pattern & Setup
- Double Top Formation: Clearly highlighted at the recent highs, signaling potential bearish reversal. This is a classic sign of buyers losing steam near a resistance level.
- Rejection Arrows: Indicate strong resistance where price failed to break higher, adding confluence to the reversal idea.
---
🔻 Sell Bias & Confirmation
- Sell Zone: Around the double top zone (~$93,700+), price is stalling and showing bearish pressure.
-Bearish Arrow: Suggests a move downward is anticipated, likely toward the support zone and trendline confluence.
---
📉 Key Support Zone
- Support Zone Highlighted: Around $88,000–$89,000, where previous structure and buying interest occurred. This is the first potential target for a bearish move.
- Trendline Confluence: Also aligns with the support, adding strength to this level. If price breaks and closes below both, further downside could follow.
---
☁️ Ichimoku Cloud
- Price is currently above the cloud**, indicating short-term bullish structure still intact. However, a break below the support + cloud would be a strong bearish signal.
---
🔑 What to Watch For
- Bearish Confirmation: If the neckline of the double top breaks (around ~$92,250–$92,150), it could confirm the pattern and trigger the move toward support.
- Invalidation: A breakout above the double top would invalidate this bearish setup and suggest continuation toward higher highs.
---
✅ Summary
- Bias: Bearish (short-term)
- Trigger: Break below ~$92,150
- Target 1: $88,000–$89,000 support zone
- Trendline + Cloud support: Key areas to watch for either a bounce or further breakdown
Sell Setup: Double Top Formation
Entry Zone: Around 93,700 (top of the double top)
---
Take Profit Levels:
- TP1: 91,600
Just above the neckline for a safer partial exit.
- TP2: 89,300
Aligns with the major support zone and previous consolidation area.*
- TP3: 87,000
At the trendline + cloud support confluence — a strong area for a possible bounce.

bitcoin sell or shortliquidity down below
bullish shorterm exhaustion
use proper risk management
#forex
#bitcoin
#weekend
#crypto
#coins
