BTCUSD SIGNAL UPDATE READ CAPTAINBtcusd signal technical analysis satup 👇🏼
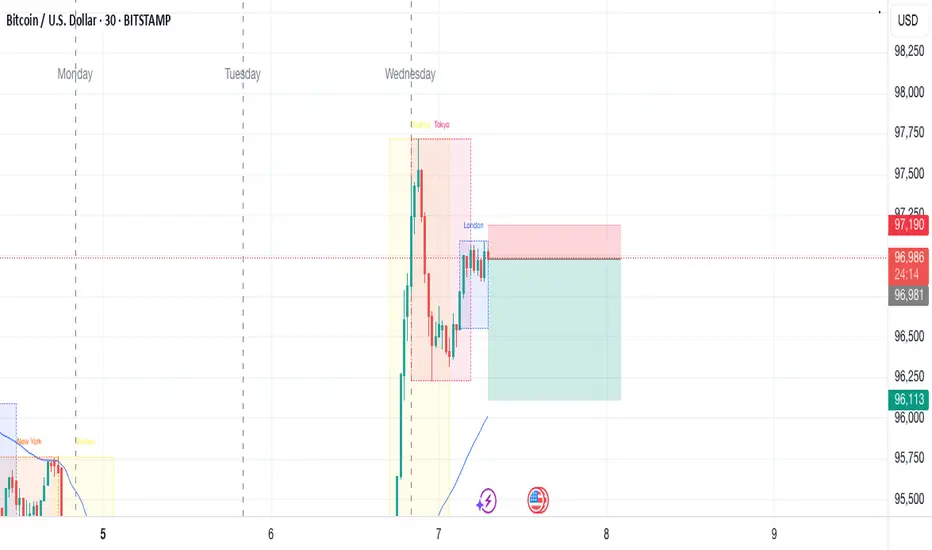
(Btcusd ) Sell zone
( TRADE SATUP)
ENTRY POINT (97100) to (97000) 📊
FIRST TP (96700)📊
2ND TARGET (96300) 📊
LAST TARGET (96000) 📊
STOP LOOS (97500)❌
FALLOW RISK MANAGEMENT ✅
BULLUSD trade ideas

BITCOIN SELL/SHORTtarrifs
interest rates
use proper risk management
#interest rates
#fomc
#ppi
#cpi
#jerome powell
Bitcoin Makes Nice MovePrice action continues to look strong, with BTC holding above key support at $88,804 after breaking out from both descending resistance and the 200 MA. The structure is clearly bullish, and we’re seeing healthy follow-through after the breakout.
That said, I’m keeping an eye on potential bearish divergence forming on the RSI. While price is making higher highs, RSI has yet to confirm with a new high of its own. This doesn’t mean a reversal is imminent — divergences can resolve through consolidation or minor pullbacks — but it’s something to be cautious of in an otherwise strong trend.
Momentum remains on the bulls' side, but I’m staying measured here rather than euphoric.

BITCOIN Mirror fractal from the past calls for massive rally!Bitcoin (BTCUSD) appears to be repeating almost the exact same price action as mid-late 2020 as it has broken above the Pivot trend-line that separates the recent distribution from the 2nd Accumulation phase and has successfully re-tested it while the MA50 (blue trend-line) is holding as Support.
If the latter continues to hold, then it might fuel a massive rally similar to October 2020 - April 2021. As you can see both fractals started of with a 1st Accumulation Phase (blue Rectangle) being supported always by their respective MA200 (orange trend-line), which led to the eventual Distribution Phase (red Arc). Even their RSI sequences are identical.
Is this another pattern supporting that BTC will reach at least $150k next? Feel free to let us know in the comments section below!
-------------------------------------------------------------------------------
** Please LIKE 👍, FOLLOW ✅, SHARE 🙌 and COMMENT ✍ if you enjoy this idea! Also share your ideas and charts in the comments section below! This is best way to keep it relevant, support us, keep the content here free and allow the idea to reach as many people as possible. **
-------------------------------------------------------------------------------
💸💸💸💸💸💸
👇 👇 👇 👇 👇 👇

btcusd sell signal. Don't forget about stop-loss.
Write in the comments all your questions and instruments analysis of which you want to see.
Friends, push the like button, write a comment, and share with your mates - that would be the best THANK YOU.
P.S. I personally will open entry if the price will show it according to my strategy.
Always make your analysis before a trade

Bitcoin update 7.05.2025Hey everyone!
In just 2 days, my first offline/online trading tournament kicks off — and you'll be able to watch everything live. It's a big milestone for me and a real-time test of my analysis. But now, let’s get back to the market...
💰 Bitcoin today — May 7
As I mentioned earlier, I expect Bitcoin to reach the 98 K - 100 K zone this May to grab the liquidity sitting above the highs. This could be the final push before a correction. Check the chart for details.
When we reach 100k, all the public media will say that BTC broke 100k and after that there will be a rollback, as happens very often.
📉 After that, a correction makes sense; I’ve explained why in earlier posts. But let’s talk fundamentals.
🗞️ Not rumors. Facts:
🔹 The U.S. is moving toward Bitcoin reserves.
New Hampshire just became the first U.S. state to pass a law creating a strategic Bitcoin reserve, signed by Governor Kelly Ayotte.
🔹 I believe other states will follow with similar legislation - this is no longer speculation. It's the next phase of BTC adoption in the U.S.
And as the saying goes:
"Buy the rumor, sell the news."
🌍 Geopolitical tension:
The India-Pakistan conflict is now a global headline. Two nuclear powers. Any correction could easily be “justified” by this news.
But...
📊 I don’t trade the news - I trade my analysis.
As you know, I publish my forecasts ahead of time and stay consistent.
🧭 My outlook:
I expect one last minor correction in the next 1 - 2 weeks, followed by a move to new all-time highs.
Best regards, EXCAVO
_____________________
Disclosure: I am part of Trade Nation's Influencer program and receive a monthly fee for using their TradingView charts in my analysis.

XAUUSD SIGNAL UPDATE READ CAPTAINBtcusd signal technical analysis satup 👇🏼
(Btcusd ) Sell zone
( TRADE SATUP)
ENTRY POINT (97100) to (97000) 📊
FIRST TP (96700)📊
2ND TARGET (96300) 📊
LAST TARGET (95900) 📊
STOP LOOS (97500)❌
FALLOW RISK MANAGEMENT ✅

BTC/USD:range tradingAfter multiple probes over the course of two days, BTC/USD once again challenged the threshold of $95,000 and successfully achieved a breakthrough. Currently, its price fluctuates within the range of $95,000 to $98,000. Within this range, investors can adopt a trading strategy of selling high and buying low. Once a new breakthrough occurs, they can flexibly adjust their trading strategies according to the direction of the breakthrough.
BTC/USD
sell@98000-97500
tp:96000-95500
buy@95000-95500
tp:97000-97500
I am committed to sharing trading signals every day. Among them, real-time signals will be flexibly pushed according to market dynamics. All the signals sent out last week accurately matched the market trends, helping numerous traders achieve substantial profits. Regardless of your previous investment performance, I believe that with the support of my professional strategies and timely signals, I will surely be able to assist you in breaking through investment bottlenecks and achieving new breakthroughs in the trading field.

BTC Price Action AnalysisHad to update the earlier Elliot wave count because the most recent move up looks far more like an impulsive structure than a corrective one
Tomorrow’s FOMC meeting is stirring up extra volatility.
I’m anticipating a run-up toward the $100K area before a larger retracement sets in. Psychologically, $100K is a major round number that could attract late retail buyers often becoming exit liquidity for earlier players. A sharp move up could squeeze remaining shorts and generate momentum, only to trap new longs before the market turns lower.

Bitcoin H1 | Potential bullish bounce off a pullback supportBitcoin (BTC/USD) is falling towards a pullback support and could potentially bounce off this level to climb higher.
Buy entry is at 95,480.50 which is a pullback support that aligns with the 50.0% Fibonacci retracement.
Stop loss is at 93,200.00 which is a level that lies underneath a multi-swing-low support.
Take profit is at 97,770.35 which is a swing-high resistance.
High Risk Investment Warning
Trading Forex/CFDs on margin carries a high level of risk and may not be suitable for all investors. Leverage can work against you.
Stratos Markets Limited (tradu.com):
CFDs are complex instruments and come with a high risk of losing money rapidly due to leverage. 63% of retail investor accounts lose money when trading CFDs with this provider. You should consider whether you understand how CFDs work and whether you can afford to take the high risk of losing your money.
Stratos Europe Ltd (tradu.com):
CFDs are complex instruments and come with a high risk of losing money rapidly due to leverage. 63% of retail investor accounts lose money when trading CFDs with this provider. You should consider whether you understand how CFDs work and whether you can afford to take the high risk of losing your money.
Stratos Global LLC (tradu.com):
Losses can exceed deposits.
Please be advised that the information presented on TradingView is provided to Tradu (‘Company’, ‘we’) by a third-party provider (‘TFA Global Pte Ltd’). Please be reminded that you are solely responsible for the trading decisions on your account. There is a very high degree of risk involved in trading. Any information and/or content is intended entirely for research, educational and informational purposes only and does not constitute investment or consultation advice or investment strategy. The information is not tailored to the investment needs of any specific person and therefore does not involve a consideration of any of the investment objectives, financial situation or needs of any viewer that may receive it. Kindly also note that past performance is not a reliable indicator of future results. Actual results may differ materially from those anticipated in forward-looking or past performance statements. We assume no liability as to the accuracy or completeness of any of the information and/or content provided herein and the Company cannot be held responsible for any omission, mistake nor for any loss or damage including without limitation to any loss of profit which may arise from reliance on any information supplied by TFA Global Pte Ltd.
The speaker(s) is neither an employee, agent nor representative of Tradu and is therefore acting independently. The opinions given are their own, constitute general market commentary, and do not constitute the opinion or advice of Tradu or any form of personal or investment advice. Tradu neither endorses nor guarantees offerings of third-party speakers, nor is Tradu responsible for the content, veracity or opinions of third-party speakers, presenters or participants.

BTC/USD Market Outlook – May 7, 2025📊BTC/USD Market Outlook – May 7, 2025
🔹Current Price: $96,579
🔹Timeframe: 1H
📌Key Demand Zones:
🟢 $95,052–95,209 – Fresh breakout demand, acting as support
🟢 $92,954–93,107 – Higher timeframe demand, strong bullish reaction area
📈Bullish Scenario:
Price broke structure with a strong impulsive move above $95.2K and is now forming a possible bullish flag. If price holds above the $95K zone, next upside targets could be $97.5K and $98.2K.
📉Bearish Scenario:
If price fails to hold above $95,052 and breaks below $95K, expect a deeper pullback toward $93.1K zone. Reactions from that level would define trend continuation or reversal.
⚡Pro Tip:
🔸 Watch for consolidation above $95K to catch breakout trades
🔸 Confirm entry with bullish engulfing or BOS on LTF (5M/15M)
#BTCUSD #BitcoinAnalysis #SupplyAndDemand #BreakOfStructure #SmartMoneyConcepts #FXFOREVER #CryptoTrading #BitcoinLevels #ForexCrypto #BTCSetup

BITCOIN UPDATE TOTALLY BULISHSO
correction endedearlier, now is totally up
Buy Level @ 96.400
Targets @ 98.400 / 99.400 / 101.800 / 106.600 and Further

Bitcoin Moment of Truth (still Bearish)Well...well....well, Bitcoin holding its grounds very.....very well. I love that sideways move, now What's next?. Where the next arrow will be pointing out? Well looking at price action and seeing how well bulls have been defending their line and knowing that bears still have some TIME left we can forecast next move and as of matter of fact it is the most important move for Bitcoin Daily uptrend structure.
Bitcoin most likely will try to clear shorts above the $95k line then will retrace to go down one more time and get rid off longs below the $93500 line with a big nasty wick then continue higher. Bears still have like 30 1hr candles to make its last move and for the Daily chart still the same , it hasn't change a bit, but will have a good reading of it after the 12th. Bitcoin is fine as long as it stays above its Daily Zero Line. Buckle up ladies and gentlemen wild volatility is coming back.

Short trade
15min TF Structure
📘 Trade Journal Entry — BTCUSD (Sell Side)
🗓 Date: Tuesday, 6th May 2025
⏰ Time: 3:35 PM
📍 Session: New York PM
🪙 Pair: BTC/USD
📉 Direction: Short (Sell Side)
🔹 Entry Details:
Entry Price: 95,116.74
Take Profit: 93,856.07 (−1.33%)
Stop Loss: 95,230.19 (+0.12%)
Risk-Reward Ratio: 11.11
🔹 Trade Context: Based on the narrative of supply and demand...and liquidity
🎯 Targeted the opening day high-low region, anticipating liquidity grab
Executed during the New York PM session, often a time for reversals...?
#5min TF entry
#NYSessionPM
#SellsideSetup
#OpeningRangeTarget
#LiquiditySweep

BTC LONGI'm seeing a continuation long setup develop, we have 5 min hidden divergence with the trend, also on higher timeframe on the 15 min we have a nice Order block and FVG to add on to support levels, I'm entering in on a lower fib level

BTC Rebounds from Support, Eyes Resistance ZoneBitcoin Price Analysis – Potential Upside from Support Zone
The chart shows Bitcoin (BTC/USD) trading in a range between strong support ($98,500–$99,000). After bouncing from support, price is currently testing the 50 EMA (~$94,821). A bullish scenario is expected with a possible move toward the resistance zone if price holds above support.

BTCUSD Weekly Update | Mongoose Capital✅ Price: $95,067
✅ Position Entry: $75,083 → +26.6% unrealized P&L
✅ Delta Volume: +13.98% → buy flow leading sell flow
✅ Indicators: RSI mid-50s, volume strong, oscillators neutral-to-bullish
Key Levels:
🔑 Support: $91,500 (prior breakout zone)
🔑 Resistance: $100,000 (psychological milestone)
⚠️ Liquidity void below: $77,000 → downside gap risk if failed
Institutional View:
“BTC continues to hold above structural resistance with steady buy flow. Momentum is constructive, not euphoric. Pullbacks into $91K likely attract demand. Trend intact while above prior range.”
📲 Follow @MongooseCA for live market reads, positioning insights, and macro overlays.


Bitcoin to Gold RatioOver the long term, Bitcoin and gold have generally moved in the same direction: up. But in the short term, they often behave differently, which creates trading opportunities. The Bitcoin to Gold ratio illustrated here expresses the value of one Bitcoin in ounces of gold.

Study of 'Reversal' chart patternsStudy of Reversal chart patterns.
Double Top/Bottom
Quasimodo (QM)
Heand and Shoulder (HnS)

BTCUSD 5/6/2025Come Tap into the mind of SnipeGoat, as he gives you a miraculous viewpoint of his perspective of the Market. There's NOONE in the history of this industry that's reading & understanding the Market the way SnipeGoat does. Buckle Up & get ready for your mind to be Blown!
_SnipeGoat_
_TheeCandleReadingGURU_
#PriceAction #MarketStructure #TechnicalAnalysis #Bearish #Bullish #Bitcoin #Crypto #BTCUSD #Forex #NakedChartReader #ZEROindicators #PreciseLevels #ProperTiming #PerfectDirection #ScalpingTrader #IntradayTrader #DayTrader #SwingTrader #PositionalTrader #HighLevelTrader #MambaMentality #GodMode #UltraInstinct #TheeBibleStrategy

Bitcoin Cycle ScenariosBitcoin cycle scenarios and their probabilities of happening based on current TA and data.

BTCETH parabolic run pointing towards 100:1Historically, during bull markets, Ethereum frequently surpassed Bitcoin at various moments.
However, this time around, that trend has not materialised, leading to a decline in investor confidence.
With capital exiting the ETH market, sentiment has soured, and critical indicators are revealing significant losses.
Unless a robust bullish turnaround occurs, Ethereum's struggle may persist, as the market currently favors Bitcoin as the more secure option.
However once this parabola breaks, we could see a strong snap back reaction in favour of the more riskier #ALTS, #DEFI and #MEMES as #ETH is still the home for stablecoin issuance and still the most trusted secure smart contract blockchain available.
