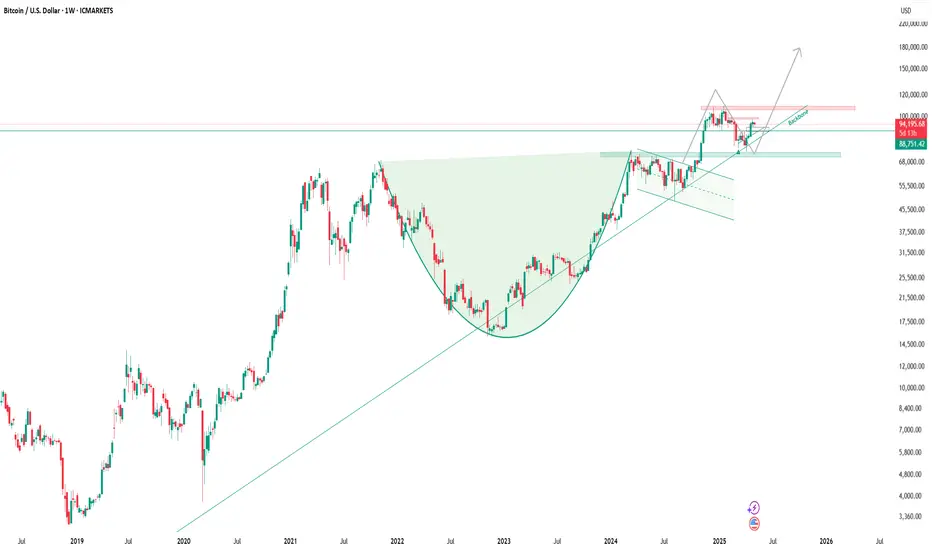
BTC is following Cup n Handle Pattern exactlyBTC is following the Cup and Handle Pattern on the Weekly timeframe. After forming the CnH Pattern, it also took a pullback.
It seems like it is about to take a rally now.
BULLUSD trade ideas
btc . may . w1 . waiting for lower pricesThe squeeze of shorts saw MayOpen pump through the resistance zones finally.
Friday 2pm, gave us the ladder entry to SHORT an SFP just before the weekend.
short . entry . 97368 . tp1 taken . ride the trend
Monday showed no volatility, no trades taken.
Too low to SHORT, too soon to LONG. I'd rather:
SHORT higher - add to position size.
cmVAL . pw0.5 . pwVwap
entry . 95347
tp1 . 90216 . +5.3%
tp2 . 88600 ish . +7%
LONG intraday
cwLow around 2pm and ride this for an intraday LONG into entry SHORT
entry . 93454
tp1 . 95347 . +2%

BTC bullmarket is over. Friday was the last high for a while.In my previous idea I was talking about the end of the bull market, that BTC won´t go for new ATHs. I am still sharing this opinion as long as BTC won´t claim the pmPOC above, as long as it doesn´t build value above.
All we have seen was a "look above and fail" which indicates weakness. This could result in a huge FTR (failure to rotate), bring the price back down to the origin of the move, 74k ish and potentially lower.
I was describing how such a short could get confirmed for example with:
".. if the pmPOC (previous month point of control) will be approached on high volume but claimed on lower volume, we will likely see a FTR.
I have marked the approach of the pmPOC with the yellow arow in the volume delta chart at the bottom. We had damn high volume and started closing above on lower volume (likely no acceptance). So I already started taking shorts at 96800 ish.
Bulls need to do something and claim the pmPOC asap + build value above.
If not, then my bearish targets will be in focus.
For now, I am convinced that it is setting up for a huge dip to 72k.

BTC testing support or more downside?After breaking out of last week's range, BTC failed to flip R to S. Currently testing potential support, if price fails to hold it current price range between $93.k, we could see a retest of GETTEX:92K or the 1D 200MA around $90k.

BTCUSD(SHORTS) TRADE RECAP (05/05)A -1% on BTCUSD. A clean LR position right here. Onto the next trade...

Bitcoin price predictionI think maybe this will happen because the BTC volume is low, and I think the bullish hype is just a hype so market makers can sell it at higher prices and buy at lower prices, if it even goes up, maybe it will go to 102k or something, and then extreme bearish.

BTCUSD NEXT MOVE BUYYYDisrupted (Bearish) Analysis:
Current Setup:
The chart shows Bitcoin ( AMEX:BTC ) bouncing from a support zone around $94,000.
The analysis suggests a bullish reversal toward the resistance around $97,500.
Bearish Counterpoints:
Lower High Structure: Recent price action shows a series of lower highs and lower lows, suggesting continued downtrend pressure.
Volume Weakness: The volume during the bounce from support is declining, indicating weak buying interest and potential for a fakeout.
Rejection Risk at Mid-Level Supply: The price is near a local supply zone (~$94,800–$95,000) that could act as resistance again.
Macro Context: If macroeconomic data or Fed policy is hawkish this week, it could lead to risk-off sentiment, affecting BTC negatively.
Bearish Scenario:
BTC fails to hold the $94,000 support zone.
Breakdown leads to a retest of $93,000–$92,500, the next significant demand zone.
If panic sets in or liquidity is swept under $94K, we could see a move toward $90,000.
Visual Disruption Suggestion:
Replace the upward blue arrow with a downward red arrow.
Mark a new support target near $92,500.
Indicate a potential fakeout just above the current resistance zone

Long trade
📘 Trade Journal
Entry BTCUSD (Buy Side)
🗓 Date: Monday, 5th May 2025
⏰ Time: 12:00 PM
📍 Session: London to New York Overlap (AM)
Pair: BTC/USD
📈 Direction: Long (Buy Side)
🔹 Entry Details:
Entry Price: 93,883.46
Take Profit: 94,533.51 (+0.69%)
Stop Loss: 93,858.02 (−0.03%)
Risk-Reward Ratio: 25.55
🔹 Trade Context:
Entered during the London–New York overlap, a peak liquidity window where breakout and continuation setups often occur.

BTCUSD Daily Trend Analysis from May 05, 2025Based on my analysis, BTCUSD is likely to experience a bearish trend over the next four trading days. A sell signal has been confirmed, with a stop-loss set at 97,939. Key support levels to watch are 83,974 and 80,491 — the latter becoming relevant only if the price breaks and closes below 83,974.
Please note: this is a personal market outlook and not a trading recommendation. Traders should rely on real-time technical analysis and implement appropriate risk management practices before making any trading decisions.

BTCUSD – 1H Long Setup | Discount Entry With RR 1:5+🧩 BTCUSD – 1H Reversal Play | May 5, 2025
We’re deep in Discount Territory, and the market just showed signs of strength with a bullish reaction from the OB. The Risk-to-Reward on this one is chef’s kiss 👨🍳💋
🧠 Smart Money Breakdown:
📉 Market Context: Prolonged bearish leg forming equal lows — liquidity engineered ✅
📍 Entry Point: EQ/OB level @ ~$93,736
🟢 SL: Below OB at ~$92,730
🚀 TP: Previous structure high ~97,912
🧮 RRR: Around 1:5+ (massive potential)
🔎 Narrative & Confluence:
🔄 Price reacting to OB zone after taking liquidity
🧲 Potential inducement below = liquidity swept
⚠️ Engulfing bullish candle = signs of LTF accumulation
📈 Expectation: Push back into premium zone above 97K
🧠 Execution Tips:
Set and forget, or trail aggressively above 94,800
Watch M15-M5 for CHoCH + order flow confirmation
Add to position on micro pullbacks with tight risk
Partial TP around 96,000 zone, full exit at 97,912
📣 Chart Ninja Tip:
“Discount isn't just a price zone — it's where patience meets precision. Let price hunt liquidity, then strike!”
💬 Drop a 💎 if you caught this sniper long.
📊 Save this setup and tag a fellow price action beast.
🔁 Share if your RR game strong today!

BTCUSD – Discount Zone Play | Long Setup Loading📉 BTCUSD – 15-Minute SMC Breakdown | May 3, 2025
Bitcoin is cooking up something spicy inside this discount zone. All the ingredients are there for a bullish reversal — we just need the final confirmation to execute the long.
🧠 SMC Breakdown:
POI Identified: Price has broken into a key OB discount zone (61.8%–79%), tapping 70.5% and chilling near the 79% fib retracement.
Weak High: Noted above at ~96,950 – a liquidity target ready to get swept.
Price Structure: Series of lower highs and lows forming bearish structure, but no momentum break yet. We're in accumulation range.
🎯 Entry Criteria (Potential):
Wait for CHoCH (Change of Character) on lower timeframes (e.g., 1min or 5min) to confirm reversal intent.
Ideal entry = bullish engulfing or BOS from within the 70–79% zone
SL = below 95,900 (clear invalidation level)
TP = Weak High → 96,950+
RR Potential = ~1:5+
📌 Why This Matters:
Price is deep in premium vs. discount logic.
Smart Money loves entries in the 70–79% retracement zones — it’s the sniper's nest.
That Weak High = unfinished business. Expecting bullish expansion if this zone holds.
📊 Pro Tips:
Wait for confirmation, don’t blindly buy in the zone.
Look for signs of absorption or bullish reaction candles.
Always map invalidation level BEFORE entering.
🔥 Final Note:
This is the “load-the-clip” zone for Smart Money. No hype, just structure. If BTC reacts here, we could see a clean 1:5 RR into that Weak High.
💬 What do YOU think happens next?
💾 Save this setup – it’s textbook.
🔁 Share this with your trading squad & don’t miss the next wave.

BTC Buy Trade IDeaDYOR, I'll manage trade and You Should Too. You Need to Manage trade if you buy.. And Learn What's going oN

BTCUSD BUY SETUP The $94,340 BTCUSD buy zone is likely due to several factors influencing market sentiment and trading decisions. Here are some possible reasons:
- *Support Level*: $94,340 might be acting as a support level, where Bitcoin's price finds buying interest or bounces back. This level is close to the current price, and traders might be looking to buy the dip.

Short-term Short entry in about 12 hours (+Long term entry)I use a combination of Support resistances, FVG, Fib Retracements, trendline, 5 waves, etc.
To keep it simple... (I add more stuff later)
Short term:
Good possible short entry STARTING 95236-95808 to target 89k-88,547 (Using FVG & Support Resistance)
Long term:
Start looking for longs starting at 81283 - 77908 (SL has to be below the 78400 candle) More update for long term strategy later on...

BTC Major countBTC BTC is slowly completing major impulse up. Wave 1-2 of major impulse that lasted Dec 2009 - Oct 2011 are giving us map for all following waves as each wave is respecting the structure of Major wave 1-2 (see blue pattern).
Knowing this we can see that wave 3 was respecting wave 1-2 structure and reached top in Dec 2017 at 20k$ level and correction that lasted till Jan 2019 was wave 4 which finished at ca. 3k$ price range.
We are now in last wave 5 where again we are respecting major wave 1-2 structure (see red pattern) and have already done subwaves 1-4. Currently we are working on wave 5of5 where we are left with one last crazy run for blowoff top. Expecting push that will bring us above major fibb 4.236 range (265k$) and will most likely make top arround 375k$ range. Make sure to secure profits on time and do not go chasing tops as it usually ends badly, rather do DCA profit taking. Once we complete major wave 5 expect big dump bringing price back to major wave 4 aka 3k$ range.

To what level could the retracement potentially continue? Scenario 1:
A potential pullback in Bitcoin may extend towards the 93,900 support zone. If this level holds, the price could enter a sideways consolidation phase between 96,000 and 96,500, suggesting a neutral short-term structure.
Scenario 2:
In an alternative scenario, the retracement could deepen towards the 92,750–93,250 support range. A rebound from this region may again lead to lateral price action within the 96,000–96,500 zone, indicating a stabilization phase following the correction.

Bitcoin's attractiveness as a hedge against inflation
**Direction:** **LONG**
**LONG Targets:**
- **T1 = $95500**
- **T2 = $97000**
**Stop Levels:**
- **S1 = $93500**
- **S2 = $93000**
**Wisdom of Professional Traders:**
This analysis synthesizes insights from thousands of professional traders and market experts, leveraging collective intelligence to identify high-probability trade setups. The wisdom of crowds principle suggests that aggregated market perspectives from experienced professionals often outperform individual forecasts, reducing cognitive biases and highlighting consensus opportunities in Bitcoin.
**Key Insights:**
Bitcoin's attractiveness as a hedge against inflation has been amplified amidst recent macroeconomic fluctuations. The asset’s adoption by institutional investors continues to signal a positive long-term trajectory. On-chain data highlights declining exchange reserves, suggesting reduced selling pressure as investors move coins to cold storage for long-term holding.
Technically, Bitcoin's current price action displays consolidation within a robust support zone near $93000-$93500, indicating favorable positioning for bullish momentum. Trading volume profiles suggest healthy market liquidity, which is crucial for sustaining an upward trajectory. Furthermore, a recent uptick in demand from retail investors amid decreasing supply bolsters confidence in a potential breakout.
**Recent Performance:**
Bitcoin has exhibited steady upward momentum over the past few weeks, climbing from its support base near $91000 to the current price level. Recovery from mid-year market volatility has been gradual yet consistent, and the asset has demonstrated resilience against external shocks, including regulatory pressures. These movements suggest strengthened accumulations by traders, supporting a bullish outlook.
**Expert Analysis:**
Professional analysis underscores the importance of psychological price marks, such as the $95000 level. Crossing such thresholds often ignites fresh interest among momentum traders, potentially driving a rally toward the next resistance at $97000. RSI and MACD indicators, converging toward bullish signals, further complement this optimistic setup. Bitcoin’s network activity also aligns favorably with a strong holding pattern, suggesting limited downside risks in the short term.
**News Impact:**
Recent news of increased adoption of Bitcoin as legal tender in emerging economies has rejuvenated investor sentiment. Additionally, announcements of significant institutional purchases have amplified the bullish outlook. Regulatory clarity in certain jurisdictions has sparked renewed optimism and decreased uncertainty about the asset, paving the way for sustained buying interest over time.
**Trading Recommendation:**
Given the technical strength at current levels and supportive fundamental factors, a LONG position on Bitcoin to target $95500 and $97000 appears prudent. Maintain cautious risk management by setting stops at $93500 and $93000 to safeguard against unforeseen reversals while capitalizing on potential upside momentum.

This local bottomThis local bottom should hold—it's a good spot to buy. If not, I’ve marked another potential entry point on the chart

Can BTC get back inside this flag and jump to a new ATH???BTC is bouncing above a long term upward line of previous resistance. Will this become the new upward trend of support???

BTC on high time frame
"Hello, focusing on BTC on high time frames, the price has pulled back to a significant zone around $75,000 and is currently showing bullish momentum. The next target appears to be the 4-hour order block located at $98,000."
If you need further assistance or have any specific questions, feel free to ask!

Bitcoin Technical AnalysisFenzoFx— Bitcoin began consolidating after peaking at $98,000, dipping toward the $93,565 support and now trading slightly above it. The Stochastic Oscillator sits below 25, suggesting BTC is oversold and may rebound.
Immediate support lies at $92,565. If this level holds, the uptrend could resume, targeting $98,000, with potential to push toward the $99,560 resistance if buying pressure increases.
Bearish Scenario: A drop below $91,720 would invalidate the bullish outlook, potentially extending the decline to $88,830.
>>> Prop Trading
>>> No Deposit Bonus
>>> %100 Deposit Bonus
>>> Forex Analysis Contest
All at FenzoFx Decentralized Forex Broker

Market Overview (May 5, 2025)
📊 Key Metrics
1. Funding Rate: -0.0024% (on Binance)
— traders are paying to hold short positions, signaling bearish pressure
2. Open Interest (OI): $27.5B, down –3.13% in 24h
— positions are closing, possibly due to liquidations or profit-taking
3. ETF Inflows: +$674.9M (on May 2)
— strong institutional demand, especially into BlackRock’s IBIT
4. Fear & Greed Index: 52 (Neutral)
— sentiment has stabilized after a period of greed
⸻
📈 Market Movement Probability
• Upward: 55%
(potential short squeeze fueled by ETF inflows)
• Downward: 45%
(OI is dropping, market losing momentum)
⸻
Disclaimer: This information is not financial advice and should not be used as the sole basis for investment decisions.

BTCUSDTBTC near future targets are shown in analysis. For a better view please go to our previous analysis of BTC to see the big picture.
write me any questions?
