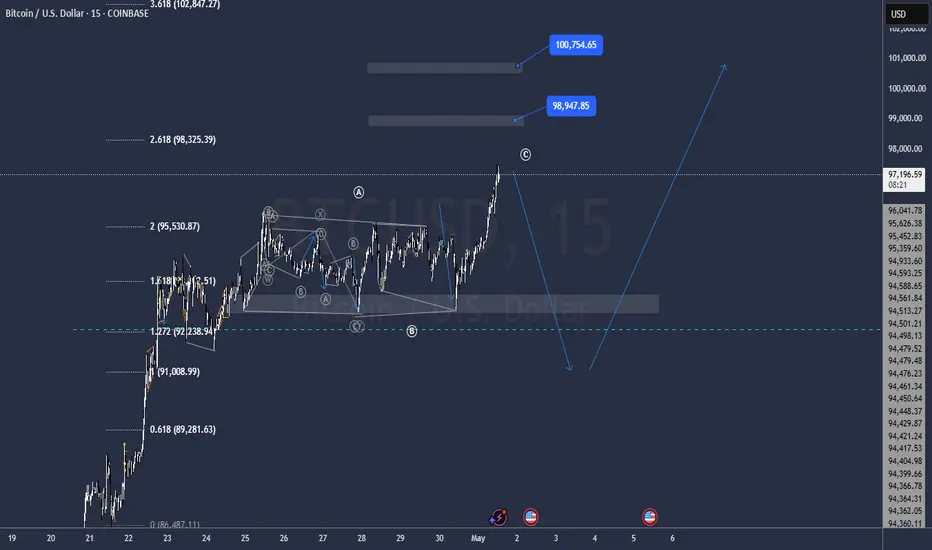
Btc ready to blast 100000Fib levels are crossing one by one
Next target 99020 to 100000
Btc form LL TO LH TO HH
NEXT HIGH 99020 NEARLY
BULLUSD trade ideas


BTCUSDT LONG SCALPING BTCUSDT LONG SCALPING
BUY ABOVE 97100
Target 1: 97350
Target 2: 97600
SL: 96830


btc fibonacci levels Trade Strategy
Long to May 4 High:
Entry: If BTC breaks above $94,310 (Square of Nine 90°) with a green candle, enter long.
Target: $96,472 (Square of Nine 720°), aligns with your $95,976.36.
Stop-Loss: Below $92,781 (Square of Nine -360°), risking ~$1,500.
Time: Exit by May 4 (50-day cycle).
Short for May 14 Dip:
Entry: If BTC reaches $96,472 and shows rejection, enter short.
Target: $91,567 (Square of Nine -720°).
Stop-Loss: Above $96,472, risking ~$1,000.
Time: Expect the dip by May 14 (60-day cycle).

+0.42% Gain: BTC/USD April 28th Trading Plan Success📈 BTC Trade Recap (Apr 28): Bullish breakout plan hit!
✅ Long entry @ $95,050 -> Take Profit 1 = $95,450 = +0.42% profit.
🐻 Short setup didn't trigger
💰 +0.42% profit.
You can find the trading plan in the 'Related publications' section in the lower right corner.

Time to Buy BITCOIN?I hope you guys enjoyed the video; feel free to comment down below any questions you might have.


I might be Wrong in my previous ForecastBTC may be still in correction stage and one more fall is very possible, secure your buy poitioms
new buy zone is @ 92.000
Bullish on BTCUSDAscending channel combined with continuation pattern with market structure [impulse correction impulse.
SMA LINE STRATEGY WORKS WELLIn my first idea I was based on the 1H 100SMA line and I saw the price works very good with this line. If price come closer to the line with low volume there is a big chance for the price to bounce from it depends if we are above or below the line, but if the price come closer to the line with big volume there is also a chance for the price to crash that line and change trend. Very important in this strategy is also a HTF analysis because it can say us a little bit more than 1H chart. For now I expect for the price to come higher and take some liquidity from up but if this little run will be burnout we can see a big probability to come back to this SMA line and I will look and wait for this moment and if I will see the chance for that move I will publish it here so wait for the next BTC update.

Can BTCUSD continue to be purchased? The answer is definitely.Can BTCUSD continue to be purchased? The answer is definitely.
The current trend is a rebound trend after a volatile decline. The space for a short-term increase of 1,500 points is very simple. The target position is 94,700-95,200. Friends who like to do short-term swing trading can follow.

BTC usd no sign of a topI'm not a big fan of trend lines. This chart uses Bollinger bands, ICHMOKU cloud, Candles and it is a bit crowded with things I am not paying much attention to. For now its above the Bollinger bands, above the cloud and has nice big green candles. No sign of a top yet


BTC to the upsideeAccumulation on the daily trendline..impulsive move anytime soon. Watch out for bear trap before taking off.

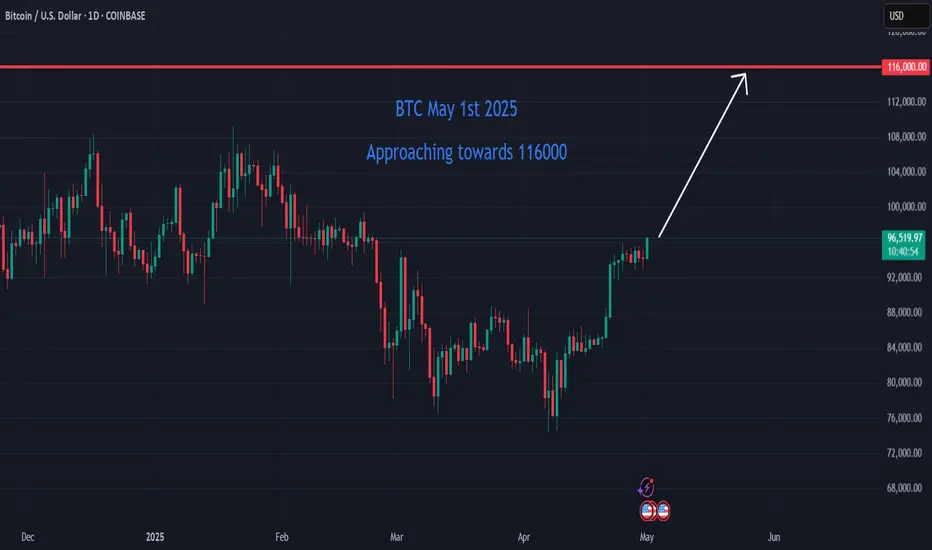
Bitcoin on the Brink: Short-Term Surge Toward $116K Bitcoin (BTC) is currently trading at approximately $96,390, approaching the $116,000 mark. Here's a short-term analysis using Cycle Analysis, Elliott Wave Theory, and Gann Analysis to inform potential trading strategies.
________________________________________
📈 Cycle Analysis: Mid-2025 Surge
Historical patterns suggest that Bitcoin tends to reach its peak between 518 and 546 days after a halving event. Given the most recent halving in April 2024, analysts anticipate a potential price peak around mid-2025, approximately 1.5 years post-halving. Notably, Bitcoin is currently about 35 days ahead of its typical cycle, indicating a possible acceleration in price growth.
________________________________________
📊 Elliott Wave Analysis: Wave 3 in Progress
Elliott Wave Theory suggests that Bitcoin is currently in the third wave of its bullish cycle, which is typically the most powerful and extended wave. Recent analyses indicate that the third wave is unfolding, with potential targets ranging from $114,500 to $120,500. A conservative estimate places the peak of this wave between $127,000 and $150,000
________________________________________
📐 Gann Analysis: Price-Time Equilibrium
Gann Analysis utilizes geometric angles to predict price movements. The "2×1 Fan" line, representing a 45-degree angle, is considered a fair value line. Historically, Bitcoin's price has peaked near this line during parabolic run-ups. Currently, Bitcoin's price is approaching this level, suggesting a potential peak.
________________________________________
🧭 Short-Term Trade Setup
✅ Entry Points:
• Accumulation Zone: $85,000 to $90,000
• Current Price: $96,390
🎯 Target Levels:
• Short-Term Peak: $116,000 to $135,000
• Medium-Term Peak: $150,000
⚠️ Risk Management:
• Potential Correction: After reaching the peak, anticipate a significant pullback, possibly 30–50%.
• Exit Strategy: Consider taking profits as Bitcoin approaches upper resistance zones.
________________________________________
🧾 Conclusion
Bitcoin is in the final stages of its current bullish cycle, with projections indicating a potential peak between $150,000 and $278,000. However, caution is warranted as market corrections are typical following such surges. Investors should consider taking profits as Bitcoin approaches upper resistance levels and prepare for potential pullbacks.
BTC moving up slowly bet carefullyBTC moving up slowly bet carefully in longer time frame. Any downward should be temporary. Draw regression in 4 hour time frame for greater clarity on movement and breakout. Careful with fake breakout as i have seen BTC is the most fake breakout asset.

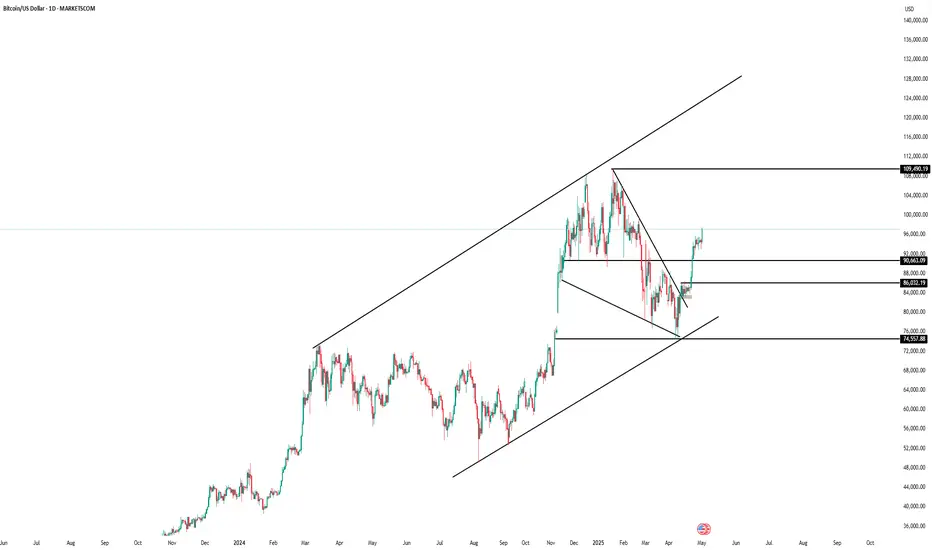
CYCLE 4 | LOG Trend Lines Chart - For Fun!Quick post looking at how BTC has historically respected 'log trend lines and how they may affect BTC future price action.
Will be fun to see how this model holds up over cycle 4 and future BTC cycles (view on a computer and use the future price action tools to see what happened past todays post date).

BTCUSD SIGNAL UPDATE READ THE CAPTAINBaddy dears friends 👋🏼
(btcusd techinal analysis signal 👇🏼
( BTCUSD ) SELL zone
( TRADE SATUP)
ENTRY POINT (95000) to (94900) 📊
FIRST TP (94700)📊
2ND TARGET (94400) 📊
LAST TARGET (94000) 📊
STOP LOOS (95350)❌
FALLOW RISK MANAGEMENT ✅

Bitcoin vs goldBitcoin priced in ounces of gold shows a clear uptrend on the long term.
Following previous cycle movement for a similar Fibonacci levels, would take us this cycle to around a 100 ounces of gold per bitcoin, which at current USD prices would be around 350.000 usd per bitcoin.
Remember, fiat money is debt. Bitcoin and gold are hard and real money. Don't fall into the unit of account trap that the USD is.
Cheers.

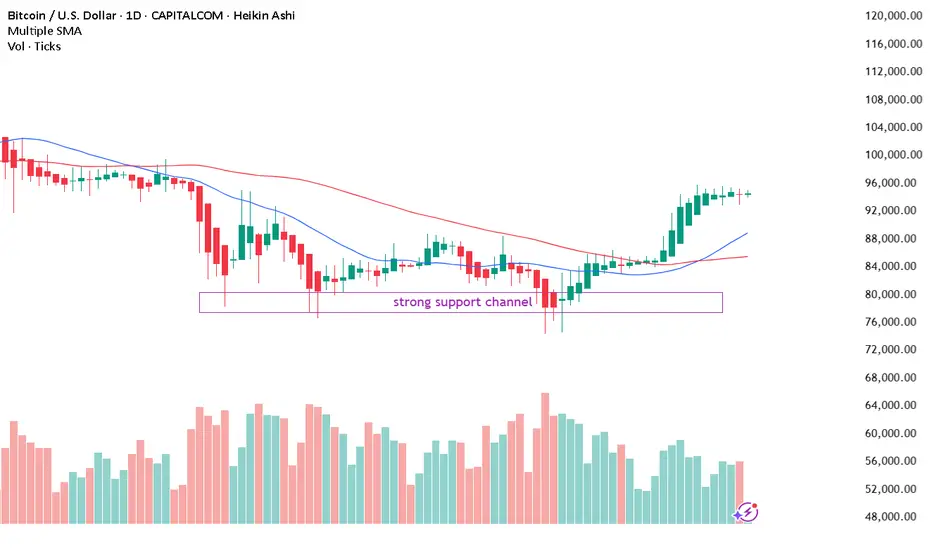
Bitcoin21 sma crossed 55 sma. Strong bullish momentum for Bitcoin. Accumulate and hold for long term trade. 55 sma is moving upwards.
Mongoose Capital | BTCUSD Daily – Momentum Breakout Consolidatio
This chart tracks BTCUSD on the daily timeframe (COINBASE), capturing the latest breakout and price consolidation around the $95,000 psychological zone.
✅ Recent momentum surge from mid-April, driving price out of range → now coiling near highs.
✅ Small yellow triangles mark momentum continuation signals.
✅ Blue/purple crosses flag minor pivot points and interim support/resistance zones.
✅ Clean price action view → no moving averages or overlays cluttering the candles.
✅ Prior structural support anchored at $75,083 for deep pullback risk.
📊 Mongoose View:
BTC is holding a bullish coil at the top of its breakout range.
→ Above $95k, risk-reward favors breakout continuation targeting new highs.
→ Break under $90k opens test of mid-range supports at $86k–$84k.
→ Major floor remains deep at $75k structural line.
This setup is tuned for momentum swing traders and trend followers, highlighting key pivots without indicator overload.

Trade Idea: BTC Long from 21 EMA with Keltner Channel Expansion
(As of April 30, 2025 – BTC/USD 4H)
Thesis
Bitcoin is in a strong uptrend and currently consolidating in a tight, sideways range above the 21 EMA, within a broader bullish structure. The price is showing respect for the cloud and remains supported by stacked EMAs.
The TTM Squeeze is in a compression phase, suggesting that volatility is coiled and may soon release. Given the strength of the prior move and lack of heavy selling volume, the setup favors a continuation higher.
The left chart (Keltner Channels) shows measured expansion targets of +2 to +3 ATR, offering a high-reward scenario if the trend resumes.
Entry
Entry Zone: Around or slightly above the 21 EMA while price holds the consolidation range
Optional scale-in if price dips slightly but holds above cloud midline or -1 ATR
Stop / Invalidation
Primary Invalidation: 4H candle close below the 21 EMA
Hard Stop: Break and close below -1 ATR or VWAP/Cloud cluster breakdown
Targeting
Target 1 (2 ATR): ~96.5–97.0K (based on upper Keltner Channel range)
Target 2 (3 ATR): ~98.0–99.0K if momentum accelerates
Optional trail remainder using higher lows or moving stop up with EMA cloud
Additional Notes
Volume profile remains supportive; no major signs of distribution
4H structure remains bullish while price stays above the 21 EMA
Expect compression to resolve soon — watch for volume to confirm breakout
Optional scale-up on squeeze fire confirmation
Summary
This is a trend continuation play with strong structure, clean risk, and asymmetric reward.
The entry is near the 21 EMA with clear invalidation and expansion targets defined by Keltner Channel volatility bands.
It reflects ideal Playbook criteria: trend, structure, momentum, compression, and clarity of risk.
