THE PLAN CHANGE A LITTLE BIT BUT RESULTS ARE THE SAMEThe idea was to hit the 100SMA at 1H chart earlier and this plan was good but it happen in a late chart and didn't expect that we can extend it like that. For now I have to wait to look what is gonna happen with volume and others things that can have a influent on the chart. Next BTC update soon and I will try to make it much clear.
BULLUSD trade ideas

BTC -- Best Zone to Long NOw..As per the previous post i have shared with you hours ago, the BTC has exactly broken down the channel inorder to grab grab the liquidity .
This is the only place we can look for LONG as the risk is very limited.
Check out how things play at 93000 zone.
If breaks, then 98000 confirmed

Bitcoin Testing 95k as Resistance TRENDLINE #Bitcoin at a CRITICAL juncture! Testing the downward trendline (double yellow) at 95K as resistance, originating from 107K in Dec.
This trendline has repeatedly rejected BTC, with multiple tests at 95K this week. Historically, rejections have led to drops to 82K support (tested 4x) or even the uptrend line at 77K (Mar/early Apr).
If BTC fails to break & hold above 95K by week's close, we may retest 82K on the 2023 uptrend (red line). BUT, if we break 95K and hold, we could target 109K, with a potential range of 125K-140K for new highs!
#Crypto #BTC #TechnicalAnalysis

Bitcoin Testing 95k as resistance TRENDLINE #Bitcoin at a CRITICAL juncture! Testing the downward trendline (double yellow) at 95K as resistance, originating from 107K in Dec.
This trendline has repeatedly rejected BTC, with multiple tests at 95K this week. Historically, rejections have led to drops to 82K support (tested 4x) or even the uptrend line at 77K (Mar/early Apr).
If BTC fails to break & hold above 95K by week's close, we may retest 82K on the 2023 uptrend (red line). BUT, if we break 95K and hold, we could target 109K, with a potential range of 125K-140K for new highs!
#Crypto #BTC #TechnicalAnalysis

BTCUSD Targets the Value Area Low: Key Trading ZonesOverview: The BTCUSD pair shows clear signs of price consolidation within a well-defined range. With critical levels such as the Point of Control (POC) and Value Area Low (VAL) identified, traders have an opportunity to plan entries and exits with precision.
Key Levels:
Point of Control (POC): $96,000 (1D TF) – The level with the highest trading activity on the daily timeframe, currently acting as a pivot zone.
Value Area Low (VAL): $88,000 (4H TF) – The boundary where buyers may potentially step in, signaling a key support area.
Current Price Zone: The market hovers near the $96,527.71 mark, moving toward the $88,000 support.
Analysis:
Volume Profile Insights: The volume profile reveals strong participation near the POC, suggesting market indecision. A breach of this zone could lead to notable momentum.
Price Movement Prediction: The chart projects a possible downward movement from the POC toward the Value Area Low around $88,000, driven by fading bullish momentum.
Risk Management: Stop-loss levels could be placed slightly above the POC for short positions, while take-profit levels near the Value Area Low ensure a balanced risk-to-reward ratio.
Trading Plan:
Short Scenario: Look for rejection signals around the POC ($96,000) and enter short positions with a target of $88,000.
Long Scenario: If price action shows strong support at the VAL, watch for bullish confirmation patterns to target a rebound back toward the POC.
Closing Remarks: Consistency, discipline, and perseverance are essential for navigating the BTCUSD market. This setup offers clarity on key levels that could shape the pair's direction in the coming sessions.


Possibility of uptrend As long as the price fluctuates above the support zone and the support trend line, the uptrend is likely to continue. Otherwise, a correction is possible.

BTCUSD Bullish Rally Incoming?The price has reached a key support level that has historically triggered strong buying interest. This zone has acted as a demand area multiple times, increasing the likelihood of a bullish reaction if buyers step in once again.

BTC BUY OpportunintyAccouding To My Plan And STarg I am Buying BTC And Make Suer Do Trade Managemetnt thanks ..

BTC looking for retesting the support inorder to go higher. BTC looking for retesting the support inorder to go higher.
In worst case, the price can break above the 96000 range and take the resistance and come down towards lower lows
if the price is first moving towards 93000 range today or tomorrow, then btc has officially become a strong candidate for long entrys.

BTC Bulls need to take commandBTC scenarios for bulls.. Break 97K run or come down a retest the break of the downtrend and retest 81K form a inverse and head n Shoulders and then run. RSI would also come down to about 50, 2D chart 200 EMA also aligns well.

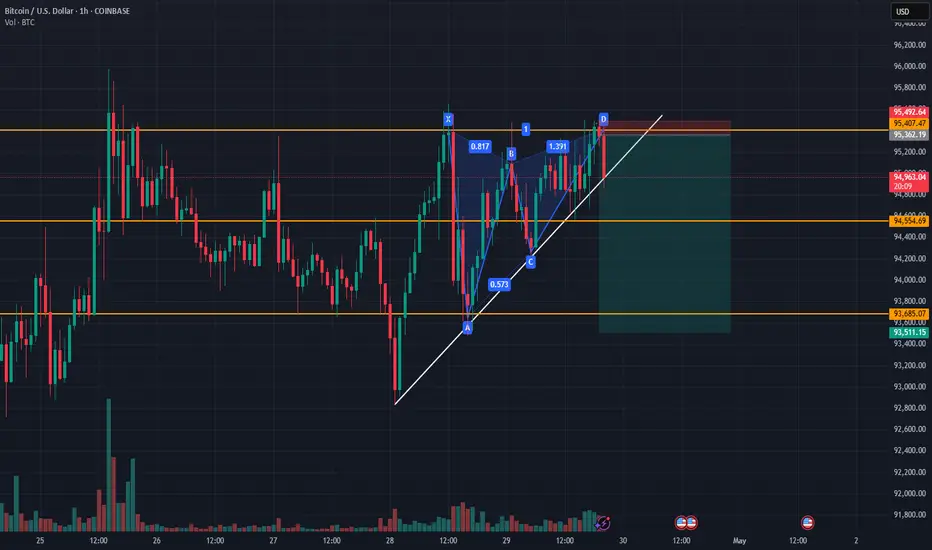
BTCUSDT BEARISH BUTTERFLY IN 1HBTCUSDT BEARISH BUTTERFLY IN 1H I go short it's only and a idea it's not a obligation to invest
Disclaimer: This is my personal opinion and not financial advice. Please manage your risk accordingly.
Bitcoin's Crossroads: Golden Cross Signals, Capital Floods In
The Bitcoin narrative is rarely static. It oscillates between fervent optimism and deep skepticism, driven by a complex interplay of technical patterns, on-chain data, macroeconomic shifts, and evolving investor perceptions. Recently, several compelling signals have converged, painting a picture of a market potentially at a significant juncture. A rare "Golden Cross" technical pattern has formed, an event often associated with the start of major bull cycles. Simultaneously, on-chain data reveals a surge in "hot supply," indicating a significant influx of new capital and heightened market activity. Adding another layer, Bitcoin demonstrated surprising resilience and relative strength against traditional assets like gold and tech stocks during recent market turbulence, exhibiting an unusually low beta that hints at potential maturation.
This confluence of technical momentum, fresh capital inflow, and changing market behavior warrants a deep dive. What exactly is the Golden Cross, and what does its appearance portend for Bitcoin? How should we interpret the nearly $40 billion in "hot supply," and what risks and opportunities does this influx of potentially newer, less experienced capital present? And critically, does Bitcoin's recent outperformance and low correlation signal a fundamental shift in its role within the broader financial landscape? This article will dissect these interconnected developments, exploring their historical context, potential implications, and the inherent uncertainties that always accompany the world's leading cryptocurrency.
Decoding the Golden Cross: A Technical Harbinger?
Technical analysis (TA) is a cornerstone of trading in many markets, including cryptocurrency. It involves studying past price action and volume data to identify patterns and trends that might predict future movements. One of the most widely recognized and discussed bullish signals in TA is the "Golden Cross."
• What is a Golden Cross? A Golden Cross occurs when a shorter-term moving average (MA) of an asset's price crosses above a longer-term moving average. The most commonly watched Golden Cross involves the 50-day simple moving average (SMA) crossing above the 200-day SMA.
o The 50-day SMA reflects the average closing price over the last 50 trading days, representing recent momentum.
o The 200-day SMA reflects the average closing price over the last 200 trading days, representing the longer-term underlying trend.
• Traditional Interpretation: When the faster-moving 50-day MA overtakes the slower 200-day MA, it suggests that recent price momentum is strengthening significantly relative to the long-term trend. Technicians interpret this as a potential confirmation that a bottom may be in, and a new, sustained uptrend could be starting. It's often seen as a lagging indicator (confirming a trend already underway) but one that can signal the potential for significant further upside. Conversely, the opposite pattern, where the 50-day MA crosses below the 200-day MA, is known as a "Death Cross" and is considered a bearish signal.
• The "Once Per Cycle" Phenomenon: The claim that this specific Golden Cross (50-day crossing 200-day) happens "once every cycle" for Bitcoin generally refers to its appearance after major bear market bottoms and preceding significant bull runs in Bitcoin's roughly four-year halving cycles. Historically, looking back at Bitcoin's chart, these crosses have indeed often preceded periods of substantial price appreciation. For example, Golden Crosses occurred in 2012, 2015, 2019, and 2020, each preceding major bull markets, albeit with varying time lags and magnitudes.
• Historical Performance and Caveats: While historically bullish for Bitcoin, the Golden Cross is not an infallible predictor.
o Lagging Nature: By the time the cross occurs, a significant portion of the initial rally off the bottom may have already happened.
o False Signals: Markets can experience "whipsaws," where a Golden Cross forms briefly only to reverse into a Death Cross shortly after, trapping overly eager bulls. This was seen briefly in some shorter timeframes or even on the daily chart during choppy periods in Bitcoin's history.
o Context Matters: The broader market environment, macroeconomic factors, and fundamental developments play crucial roles. A Golden Cross during a period of intense regulatory crackdown or global recession might not have the same impact as one occurring during quantitative easing and growing institutional interest.
o Confirmation Needed: Traders often look for confirmation signals after a Golden Cross, such as sustained price action above the moving averages, increasing volume, or bullish follow-through patterns.
What to Expect from the Golden Cross?
The formation of a Golden Cross on Bitcoin's daily chart is undeniably a positive technical development that captures market attention. It suggests underlying strength and improving medium-term momentum. Historically, it has often marked the transition from a bear market recovery phase to a more sustained uptrend.
However, expectations should be tempered with caution. It's a signal, not a guarantee. It indicates potential but requires confirmation through continued price strength and favorable market conditions. Relying solely on this pattern for investment decisions is risky. It should be considered alongside other factors – on-chain data, fundamental developments, and macroeconomic context – to form a more complete picture. The most reasonable expectation is that the Golden Cross increases the probability of further upside but doesn't eliminate the possibility of consolidation, pullbacks, or even failure of the nascent uptrend.
The Heat is On: Understanding the Surge in 'Hot Supply'
While technical analysis looks at price charts, on-chain analysis delves into the activity happening directly on the Bitcoin blockchain, providing insights into investor behavior and capital flows. A key metric highlighted recently is the rise of "Bitcoin hot supply."
• What is 'Hot Supply'? "Hot Supply" typically refers to Bitcoin that has been moved on the blockchain relatively recently, often within the last few months (definitions can vary slightly between analytics platforms, e.g., coins moved within the last 1-3 months or sometimes up to 6 months). These coins are considered "hot" because they are more likely to be involved in active trading or spending, as opposed to "cold" supply held in long-term storage (often associated with HODlers). It represents the portion of the Bitcoin supply that is more liquid and actively circulating.
• Nearing $40 Billion: The fact that this hot supply is nearing a value of $40 billion is significant. It indicates a substantial amount of Bitcoin changing hands and reflects a "surge in capital turnover," as described in the analysis. This suggests heightened market activity, increased liquidity, and, crucially, the entry of new participants or the reactivation of dormant capital.
• New Investors Flooding In (at High Prices?): The analysis explicitly links this surge to new investors and speculators taking an interest, likely attracted by Bitcoin's recent price recovery and multi-month highs. The mention of "$95K" (even if potentially a typo or hypothetical peak target in the source analysis) symbolizes the risk that many of these new entrants might have acquired Bitcoin at relatively elevated prices compared to the cycle lows. This creates a cohort of investors with a higher cost basis.
• Implications of High Hot Supply:
o Increased Liquidity: More coins moving means more potential buyers and sellers, which can facilitate smoother price discovery and larger trades.
o Fuel for Rallies: An influx of new capital provides buying pressure that can sustain upward price momentum. Speculative interest often feeds on itself in bull markets.
o Increased Volatility: Coins held by newer entrants or short-term speculators are often considered "weaker hands." These holders may be more susceptible to panic selling during price dips or quick profit-taking during rallies, potentially leading to sharper price swings in both directions.
o Potential Overhead Supply: If the price stalls or reverses, the large volume of coins acquired at recent highs ( SGX:40B worth moved recently) represents potential selling pressure as these holders seek to break even or cut losses.
Interpreting the Influx:
The surge in hot supply is a double-edged sword. On one hand, it confirms growing interest and provides the necessary capital flow to potentially validate the bullish signal from the Golden Cross. New demand is essential for sustained price increases. On the other hand, it introduces a layer of fragility. The market's ability to absorb potential selling from these newer, higher-cost-basis holders during inevitable corrections will be a key test of the underlying strength of the current trend. Monitoring whether this "hot supply" gradually cools down (moves into longer-term holding) or remains elevated will be crucial in the coming months.
Bitcoin's Relative Strength: Outshining Gold and Tech Amid Turmoil
Beyond technicals and on-chain flows, Bitcoin's performance relative to traditional assets, especially during periods of market stress, offers valuable insights into its evolving perception. The observation that Bitcoin outperformed both gold (a traditional safe-haven) and tech stocks (risk-on assets) in April, particularly amidst "tariff turmoil" or other geopolitical/economic uncertainties, is noteworthy.
• Challenging Correlations: Historically, Bitcoin often traded with a high correlation to risk assets like tech stocks, particularly during market downturns. Investors tended to sell Bitcoin alongside equities during risk-off periods. Gold, conversely, often acts as a safe haven, rallying during uncertainty. Bitcoin outperforming both simultaneously suggests a potential breakdown in these typical correlations, at least temporarily.
• Why the Outperformance? Several factors could contribute:
o Unique Drivers: Bitcoin's price is influenced by factors unique to its ecosystem, such as halving cycles, adoption news, regulatory developments, and flows into new instruments like spot ETFs. These can sometimes override broader market trends.
o Inflation Hedge Narrative: Persistent inflation concerns may lead some investors to seek alternatives to fiat currency, benefiting both gold and Bitcoin, but perhaps Bitcoin more so due to its perceived higher growth potential.
o Safe-Haven Experimentation: While gold remains the established safe haven, some investors might be tentatively allocating a small portion to Bitcoin as a potential alternative store of value or hedge against systemic risk, especially if they perceive traditional systems as vulnerable.
o Decoupling Narrative: Some proponents argue that Bitcoin is increasingly decoupling from traditional markets as it matures and establishes itself as a distinct asset class. The recent performance could be seen as evidence supporting this view.
o Coincidence/Timing: It's also possible that the timing was coincidental, with Bitcoin-specific catalysts driving its price higher while unrelated factors weighed on gold and tech stocks during that specific period.
Significance of Relative Strength:
Demonstrating strength during periods when traditional assets are struggling enhances Bitcoin's appeal. It challenges the simplistic "risk-on only" label and suggests it might offer diversification benefits. If this pattern persists over longer periods and across different market stressors, it could significantly bolster the case for Bitcoin's inclusion in traditional investment portfolios.
Maturation Signal? The Low Beta Phenomenon
Closely related to relative strength is the concept of beta. Beta measures the volatility or systematic risk of an asset compared to the overall market (often represented by an index like the S&P 500).
• Beta Explained:
o A beta of 1 indicates the asset's price tends to move with the market.
o A beta greater than 1 indicates the asset is more volatile than the market.
o A beta less than 1 indicates the asset is less volatile than the market.
o A beta of 0 suggests no correlation.
• Bitcoin's Historically High Beta: Traditionally, Bitcoin has exhibited a high beta, especially relative to equity markets. It was often seen as a high-volatility asset that amplified broader market moves, particularly to the downside during risk-off events.
• Recent Low Beta Observation: The finding that Bitcoin displayed an "unusually low beta during recent market stress" is significant. It implies that its price movements were less correlated with, and potentially less volatile than, the broader market during that period of turbulence.
• Implications of Low Beta:
o Maturation Narrative: A lower, less correlated beta is often characteristic of more mature assets or distinct asset classes. It suggests investors might be viewing Bitcoin with a longer-term perspective, less prone to knee-jerk selling based on short-term fluctuations in other markets.
o Diversification Potential: Assets with low correlation to traditional portfolios (like stocks and bonds) are valuable for diversification, as they can potentially reduce overall portfolio volatility. A sustained low beta would strengthen Bitcoin's diversification credentials.
o Shift in Holder Base?: It could indicate a shift towards more institutional and long-term holders who are less reactive to daily market noise compared to purely retail speculators.
o Store of Value Aspirations: While still highly volatile compared to traditional stores of value like gold, a decreasing beta could be interpreted as a tentative step towards fulfilling some store-of-value properties, particularly if it holds value better than risk assets during downturns.
Is it Sustainable?
While the recent low beta is an encouraging sign for Bitcoin bulls and proponents of its maturation narrative, it's crucial to question its sustainability. Was it a temporary anomaly driven by specific market conditions in April, or does it represent a durable shift? Bitcoin's correlation and beta have fluctuated throughout its history. Renewed market panic, significant regulatory shocks, or major shifts in macroeconomic policy could potentially cause correlations to snap back. Continued observation across different market environments is needed to determine if this low beta is a new regime or a fleeting characteristic.
Synthesizing the Signals: A Complex Tapestry
Bringing these threads together – the Golden Cross, the surge in hot supply, relative outperformance, and low beta – reveals a complex and somewhat contradictory picture:
1. Technical Momentum Meets New Money: The Golden Cross provides a technically bullish backdrop, potentially encouraging more participants. The SGX:40B in hot supply confirms that new capital is entering, providing the fuel that could validate the technical signal.
2. Speculation vs. Maturation: The influx of hot supply points towards increased speculation and potentially "weaker hands." Yet, the low beta and relative outperformance during stress hint at underlying strength and potential maturation, suggesting a core base of holders is becoming less reactive. This highlights the heterogeneous nature of the Bitcoin market, with different investor cohorts exhibiting different behaviors simultaneously.
3. Opportunity and Risk: The convergence creates both opportunity and risk. The opportunity lies in the potential for the Golden Cross and new capital to ignite a sustained rally, further bolstered if Bitcoin continues to act as a diversifier (low beta). The risk lies in the potential fragility introduced by the high volume of recent entrants (hot supply) who might capitulate during dips, potentially invalidating the Golden Cross and reversing the low beta trend.
The current environment suggests Bitcoin is navigating a transition. The technicals point upwards, fresh capital is flowing in, and its behavior relative to traditional markets is showing intriguing signs of change. However, the presence of significant "hot" money serves as a reminder that volatility and sharp corrections remain distinct possibilities.
Overarching Risks and Necessary Caveats
Despite the positive signals, numerous risks persist:
• Technical Analysis is Not Predictive: The Golden Cross is a historical pattern, not a crystal ball. It can fail.
• 'Hot Supply' Risk: A large cohort of investors with a high cost basis can become a source of significant selling pressure if sentiment shifts.
• Macroeconomic Headwinds: Persistent inflation, rising interest rates (globally), geopolitical conflicts, or a global recession could dampen appetite for risk assets, including Bitcoin.
• Regulatory Uncertainty: While spot ETFs marked progress, the global regulatory landscape for crypto remains fragmented and uncertain. Unexpected crackdowns remain a threat.
• Correlation Risk: The low beta and decoupling narrative could prove temporary. Bitcoin could easily recouple with risk assets during a broader market panic.
Conclusion: Bitcoin at an Inflection Point?
Bitcoin currently stands at a fascinating crossroads, illuminated by a confluence of compelling, albeit sometimes conflicting, signals. The rare Golden Cross offers a technically bullish omen, suggesting underlying momentum is shifting favorably for a potential long-term uptrend, echoing patterns seen in previous cycles. This technical optimism is fueled by tangible evidence of renewed interest, with nearly $40 billion in "hot supply" indicating a significant surge in capital turnover and the arrival of fresh speculative and investment capital.
Simultaneously, Bitcoin's recent behavior exhibits intriguing signs of potential maturation. Its ability to outperform traditional safe havens like gold and risk assets like tech stocks during periods of market stress, coupled with an unusually low beta, challenges its historical "risk-on only" profile. This suggests a growing base of investors may be viewing it through a longer-term lens, potentially as a unique store of value or a portfolio diversifier, less swayed by short-term market noise.
However, this complex picture demands caution. The very influx of capital that fuels optimism also introduces fragility, as newer entrants with higher cost bases may be quicker to sell during downturns. The Golden Cross, while historically significant, remains a lagging indicator with no guarantee of future success. And the low beta, while encouraging, could prove ephemeral in the face of severe macroeconomic shocks or shifts in market sentiment.
Ultimately, Bitcoin's trajectory towards 2030 and beyond will depend on its ability to navigate these dynamics. Can it convert the current technical momentum and capital influx into a sustainable trend? Will its utility and adoption grow sufficiently to solidify its role beyond pure speculation? Will it continue to carve out a unique space in the financial ecosystem, proving its resilience and diversification benefits across various market conditions? The current signals suggest the potential is there, but the path forward remains intrinsically linked to broader economic forces, regulatory evolution, and the ever-unpredictable psychology of the market. Bitcoin is flashing signs of both renewed vigor and evolving character, making the coming months and years critical in defining its future role.

Daily Price Action: BITCOIN BTCUSD Tuesday 4/29/2025In this video, we will be looking into the potential price action BTCUSD.

btc fibonacci levels i added new levels btc needs to hold new level 94837 buy green candle close new resistance 95751 if we break we will continue to break into new gann channels lookn for pullback around 96000 levels

BTCUSD INTRADAY uptrend continuation supported at 91940The BTC/USD pair maintains a bullish overall sentiment, underpinned by a sustained upward trend. However, recent intraday price action suggests a phase of sideways consolidation, indicating a potential buildup before the next directional move.
Key Levels:
Support: 91,940 (primary), followed by 90,200 and 88,110
Resistance: 99,300, with extended targets at 101,000 and 103,150
A corrective dip toward the key support zone at 91,940 could offer a bullish rebound opportunity. A successful bounce from this level would reinforce the uptrend and pave the way for a test of the 99,300 resistance. A breakout above this level may open the door to further gains toward 101,000 and 103,150 over the longer term.
Conversely, a decisive break and daily close below 91,940 would invalidate the bullish setup, potentially triggering a deeper pullback toward the 90,200 and 88,110 support levels.
Conclusion:
While the broader trend remains bullish, BTC/USD is currently consolidating. Traders should watch the 91,940 support closely—its defence may confirm trend continuation, while a breakdown could signal a short-term bearish reversal.
This communication is for informational purposes only and should not be viewed as any form of recommendation as to a particular course of action or as investment advice. It is not intended as an offer or solicitation for the purchase or sale of any financial instrument or as an official confirmation of any transaction. Opinions, estimates and assumptions expressed herein are made as of the date of this communication and are subject to change without notice. This communication has been prepared based upon information, including market prices, data and other information, believed to be reliable; however, Trade Nation does not warrant its completeness or accuracy. All market prices and market data contained in or attached to this communication are indicative and subject to change without notice.

Bitcoin (BTCUSD) - Key levels to watchKey levels to watch
Support zone: 90–92 K – this is where the cloud bottom & 20 EMA converge on the 1 H, and where prior buyers stepped in.
Near-term resistance: 95.3–96 K – yesterday’s swing high and the top of today’s small range.
Major target: 100 K – psychological line in the sand and top of the rising channel on the daily.
Today’s plan
If BTC drifts back toward 92–93 K:
Look for a clean hold (or small wick) off the cloud top on 1 H + a lift in 5 min RSI from oversold.
Buy triggers: 5 min close > mid-cloud (93.5 K) or 1 H close back above 94 K.
On strength above 96 K:
Consider scaling into partial longs (e.g. 20–30% size) for a run at 100 K, tacking stops just below 95 K.
Beware a breakdown under 90 K:
If that zone gives way, look for 88.8 K (dashed yellow line) as the next pivot.

Bitcoin $120,000.00 Bitcoin will soon reach the target of $120,000.00, see in the analysis that I had announced today's price in the price range of 20,000.00 a few years ago.
Sasha Charkhchian

Retracement to high to mid 20s before next leg upWe're likely nearing the bottom of this cycle (my guesstimate is 26-28k) before the next leg up. Good time to DCA for the longer term.

btc . tue . recap plan to LONG came to fruition
LONG note:
as i found wOpen heavily BULLISH - i was eager to get in early and equaly positioned:
cw0.5 . 94.200
to
cw0 . 92781
entry: 93.975
this left me with not the nicest entry . not all orders were filled . should have favoured increasing order size . one never really knows until it happens . but happy
DAY TRADE note:
a day trade of nysOpen SFP . 95.400 (to ride down for our LONG IDEA)
LONG SUPPORT will show during the day . NICE! . but not taken . it supported our search for LONG though
recap
wOpen . ASIA . LONG
nysOpen . SFP to 5.30pm . LONG
tueOpen . ASIA take profit . rotation to cw0.5 . (LONG in favour)
nysOpen . idealy tp1 : SFP . possibly rotation . (look out for SHORT and LONG)

BTC? my POV on everythin else
WHAT DO YOU FEEL
When you buy something and it goes down?
Loss is buy high and SOLD low, visa versa.
I'm not insinuating that you should loose but what you should reflect on yourself,
When you made that decision to Invest or trade.
The length of time for it to get there, volatility, range. Account size
Main thing for me is my emotional position : MY EXPECTATION
I'm sorry to upset the guru
All other people analysis and mine will fit individually.
It will not fit the world.. analysis for 3mo-- > will not tally " you who trade intraday"
analysis for today___> won't fit "those invest for 6mo"
Again... find what fits your profile.. how patience? how long you are willing to wait? if it goes to target.. how satisfied will you be on your exposure?
Too long.. of my view. Hope this reach someone.
Not your guru.. but I could be a friend
My POV dont matter.. haha

Ready to print higher lowMy guess is that price is ready for a retrace to 80k. But I don't have any crystal balls over here. Just normal ones, so 50/50 I'm right. GL
