BULLUSD trade ideas

possibility of uptrendAs long as the price fluctuates above the green support level, the upward trend is likely to continue.
A break of the red support level will cause a continuation of the downward trend.


Bitcoin– Post-Halving StructureThis monthly chart outlines Bitcoin’s long-term ascending channel with key horizontal resistance levels. Following the April 2024 halving (highlighted), price action has continued respecting the macro uptrend with higher lows. Blue projection suggests potential for continued bullish momentum, testing upper channel boundaries into late 2025.
Key zones:
• Major support: 23K (2022 low, Fibonacci zone)
• Resistance: $60K–$69K range (previous ATH supply zone)
• Current structure: Bullish continuation above trendline support
Watching for confirmation of a breakout above previous highs, with potential upside extension toward $90K–$100K by 2026 if momentum sustains

BTC PERPETUAL TRADE ,Sold at $94,450BTC PERPETUAL TRADE
BTC SELL SETUP
Currently $94,450
Sold at $94,450
(Trading plan If BTC up to $96k we will add more shorts)
Expecting target $92,500 OR DOWN
Incase of early exist will update this anaylsis
Its not a Financial advice

Bitcoin TumbleSeeing a Bitcoin drop to about 89,000 levels.
There is a slight increase after a momentum move, on declining volume. Also, Bitcoin has dropped below my pattern. If it holds in the 93,000 range, should be seeing a drop soon.

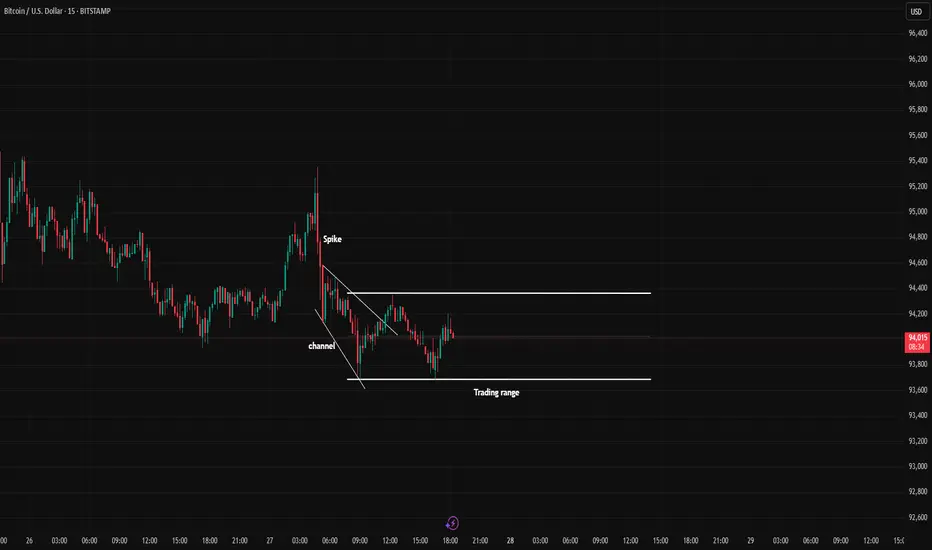
BTC cycleIn the 5-minute timeframe, you can sell at the top of the trading range and buy at the bottom of the trading range (by observing reversal candles and patterns).
Alternatively, you can wait for a breakout and enter in the direction of the breakout.
Be mindful of fake breakouts
"BTC Breakout Alert: Long Trade Setup in Action! BTC long setup triggered at 94,060 after triangle breakout.
Targeting 94,910 for a bullish move! 🚀📈

Thoughts latelyI was waiting for 75 or arround, lost my entrance, i was occupy by my other job; so the purple zone are levels in that zone that i've been watching, price bounce on top and has been carrying the run, it also cross an other support and currendly still above the trend line, I kept my position on hold due to my simple EMA's almost crossing, they spread apart on the last days; if on the following days holds above the trend, that would put us on a good bull to ride.
cheers!

BTCUSD BITCOIN
Charts again show strength in upside but trade accordingly don't trade or invest in hurry add qty slowly.

BTC long ideaBTC just touched the 4H trendline, also price looks like reversing since already stuck around this level for 12 hours. TP Daily liquidity at 98700-800. Swing tp 106.900.
Als matched with my 0.66 fib level, been sticking around there the whole day.


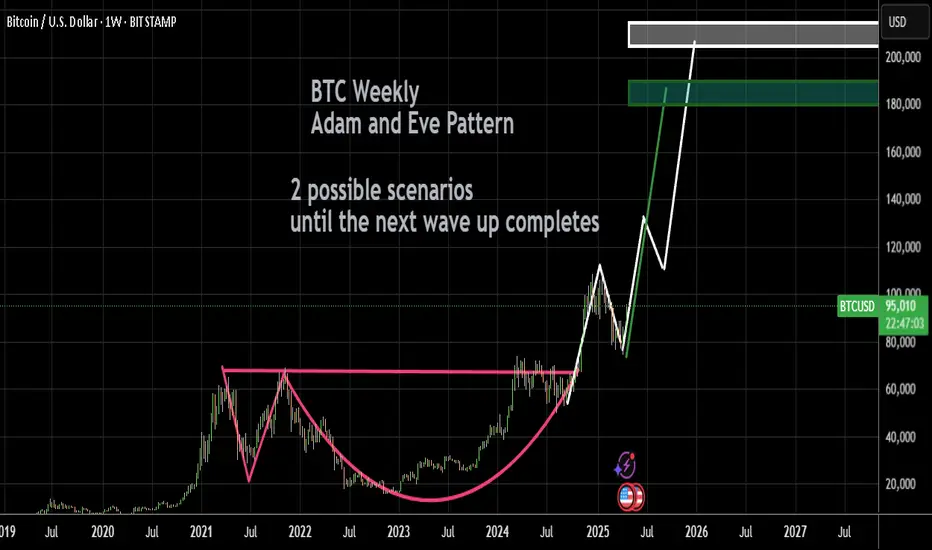
BTC retesting its cup and handle SupportThe weekly BTC chart shows a perfect cup and handle in play.
The price is retracing after breaking the $74k resistance area in Nov 2024.
Once the price reaches, the now support, and bounces from $72-74k area we can enter long positions.
Previously it took 6 weeks to reach ATH $109K
We can expect BTC to reach $110k approx. in 2 months time once it reverses from the support $72-74k
And the rest of the 2025 may be Bullish taking us to new ATH

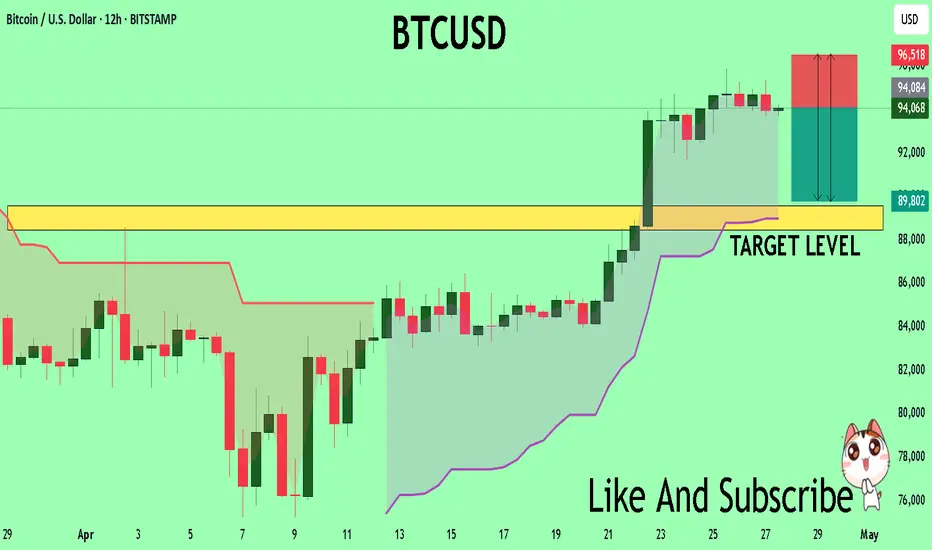
BTCUSD What Next? SELL!
My dear friends,
Please, find my technical outlook for BTCUSD below:
The price is coiling around a solid key level - 94068
Bias - Bearish
Technical Indicators: Pivot Points Low anticipates a potential price reversal.
Super trend shows a clear sell, giving a perfect indicators' convergence.
Goal - 89586
Safe Stop Loss - 96518
About Used Indicators:
The pivot point itself is simply the average of the high, low and closing prices from the previous trading day.
Disclosure: I am part of Trade Nation's Influencer program and receive a monthly fee for using their TradingView charts in my analysis.
———————————
WISH YOU ALL LUCK
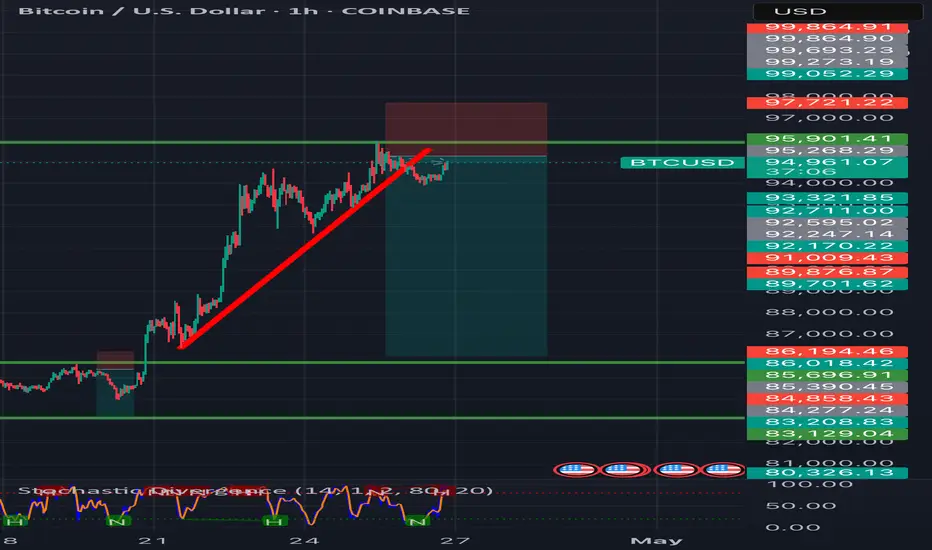
btcusd Ah, you're likely interested in liquidity in the context of this Bitcoin chart! Here's what we can infer about potential liquidity based on your setpoint:
* Above the Resistance Zone (around 95,878): The red resistance zone often coincides with areas where sellers are likely to have limit orders placed. If the price breaks above this zone, it could trigger those orders, leading to a burst of selling volume and potentially a sharp move downwards. This area could represent a pool of sell-side liquidity.
* Below the Support Level (around 93,919): Similarly, the black support line might attract buyers looking to enter the market or add to their positions. If the price breaks below this level, it could trigger stop-loss orders from buyers, resulting in significant selling pressure and a rapid price decline. This area could represent a pool of buy-side liquidity.
* Areas of Consolidation: The sideways price action within the range defined by your support and resistance levels suggests periods where buying and selling forces are relatively balanced. These periods can build up liquidity as more orders accumulate within that range. A breakout from this consolidation could then trigger a significant move as this built-up liquidity is absorbed.
* "BUY" Signals and Liquidity: Your "BUY" signals might be strategically placed to anticipate moves that could tap into existing liquidity. For example, a buy signal near the support level could be aiming to capitalize on a bounce driven by buy-side liquidity.
In essence, your support and resistance levels are key areas to watch for potential liquidity grabs. A break beyond these levels could indicate a significant influx of volume as resting orders are triggered.
Keep an eye on how the price interacts with these zones and any significant volume spikes that might confirm the triggering of liquidity.
Is there a specific type of liquidity you're interested in, or perhaps how to trade around these levels?

BTC showing a Bull Flag PatternBTC showing a Bull Flag Pattern if this pattern works we can see BTC retest level at 105k for now btc must hold support area at 92k level
A bullish triangle breakout above resistance could signal further upward movement
Conclusion:
Bullish Outlook: If Bitcoin breaks through the $95,000-$100,000 resistance, it could continue moving toward $110,000 and higher, assuming volume remains strong.
Bearish Reversal Risk: If Bitcoin fails to maintain momentum and drops below the support zone around $90,000, a pullback toward $80,000 or lower could be likely.
With Bitcoin trading at $93,852, this represents a significant price level. Let’s dive into a technical analysis based on this new price point. Here's how we can break it down:
1. Price Action Overview:
Current Trend: Given that Bitcoin is trading above $90,000, it’s in a very strong bullish phase (assuming this price is recent and not a flash spike). Bitcoin has likely been in an uptrend for some time if it's at this price point.
Price History: Look back at recent highs and lows. Is $93,852 a new all-time high? If so, it may suggest a continuation of the bullish trend or a potential retracement (correction).
2. Support and Resistance Levels:
Support Levels:
$85,000 - $90,000: This could serve as a near-term support level, as psychological levels tend to hold. Watch for price action around this level to see if it holds.
$80,000: A previous significant level, possibly acting as a major support.
Resistance Levels:
$95,000 - $100,000: These could be the next key resistance levels. If Bitcoin has not yet reached $100,000, it’s likely to encounter some selling pressure around this psychological threshold.
All-Time High: If this is the highest price Bitcoin has reached (or is close), it may face resistance as traders take profits.
3. Technical Indicators:
Moving Averages (MA):
50-Day MA: If Bitcoin is above the 50-Day Moving Average (likely the case if it’s at $93,852), this indicates a short-term bullish trend.
200-Day MA: If Bitcoin is significantly above the 200-Day MA (possibly $50,000–$60,000, depending on the trend), this suggests that the long-term trend is still bullish.
Crossovers: If the price is above both MAs, the trend is solidly bullish. A potential golden cross (50MA crossing above the 200MA) would further validate this upward trend.
Relative Strength Index (RSI):
RSI at 70 or above: If the RSI is near or above 70, Bitcoin may be entering overbought territory. This could signal that the price might face some retracement or consolidation.
RSI at 50-70: This indicates healthy momentum, and Bitcoin is still in an uptrend without signs of being overextended yet.
MACD (Moving Average Convergence Divergence):
Bullish Crossover: If the MACD line is above the signal line, it indicates positive momentum and buying pressure.
Bearish Crossover: If the MACD crosses below the signal line, it may suggest a slowdown or potential pullback. Look for any divergence between price and MACD, as it may signal an upcoming reversal.
Volume:
Increasing Volume: If Bitcoin is moving up with increasing volume, this suggests strong market participation, which is a good sign for the uptrend continuing.
Decreasing Volume: If volume is tapering off during an uptrend, this might indicate weakening momentum, and a reversal or consolidation might be coming.
4. Chart Patterns:
Bullish Continuation Patterns:
Look for bull flags or ascending triangles. These patterns indicate that after a period of consolidation, Bitcoin might continue its upward trajectory.
Reversal Patterns: If Bitcoin is forming head and shoulders, double top, or bearish divergence with high RSI, that could signal a potential reversal or correction in the near future.
5. Sentiment and Market Conditions:
Fear and Greed Index: If the Fear & Greed Index is in the “Extreme Greed” zone, this might indicate that the market is overbought, and a short-term correction could be on the horizon.
On-Chain Data: Look for any data showing whether large players (whales) are buying or selling at these levels. If whales are accumulating, it might suggest continued bullishness.
6. Potential Price Targets:
Upside Potential:
$95,000 - $100,000: This is likely the next resistance zone. If Bitcoin breaks through this range with strong momentum, it could be headed towards $110,000 or even higher, depending on how the market reacts.
Downside Risk:
$85,000 - $90,000: These levels might act as strong support. If Bitcoin breaks below $90,000, the next level of support would be around $80,000.
If it falls below $80,000, this would signal a deeper correction, and we would need to watch for further support at $70,000 and $60,000.
7. Fundamental Factors to Consider:
Global Market Sentiment: Bitcoin’s price is often influenced by traditional financial markets, especially during macroeconomic events (inflation data, interest rate changes, etc.). Pay attention to how equities, gold, and other assets are performing, as Bitcoin often moves with these.
Regulation News: Any regulatory developments, especially in the US or Europe, can have a major impact on Bitcoin’s price.
Institutional Adoption: News of large institutions or corporations adopting Bitcoin can drive the price higher. Similarly, any reports of significant sell-offs by large holders can trigger a downward price movement.

BTC LONG IDEATimeframe: 1H⏰
Analysis:
• BTC is consolidating after a strong bullish move. 📈
• The market structure remains bullish, with a high probability of continuation to the upside. ✅
• A bullish flag/channel pattern is forming. 🏳️🌈
• Strong support is located around 93,700. 🛡️
Key Zones:
• Support zone: 93,700 🧲
• Resistance zone: 95,000 → 96,500 🎯
Idea:
• Price action currently shows a bullish bias. 🔥
• Watching for a breakout or a potential retest without structural break. 🧐
• Momentum is building, supporting further upside movement. ⚡

Fearless Bulls Bought the Dip! The 75-80K range finally delivered as a strong support zone — just as anticipated.
Back in January, I marked this area as "A Sweet Spot to Pull Back," and today’s price action validates that foresight.
What's even more impressive? Bitcoin absorbed the selling pressure on both April 3rd and 4th like a champ.
Now, the 400-day EMA is stepping up as dynamic support, adding further conviction to the bullish case.

BTCUSD (4H): Short Position OpportunityHello Traders.
You may find more details in the chart!
Good Luck!
Please support with a like or comment if you find this analysis useful.❤️

TA for FX,Indices and many More!(Week 17,28Apr25)Hello fellow traders , my regular and new friends!
Which pairs or instruments should we keep a look out for?
For me I am looking at :
potentially more pullback (down) on EURUSD and the majors.(stronger USD)
SNP might have a day or 2 of upside and pullback (chance for long on the change in daily trend)
Potential H&S on EurGbp and Gold.
BTC to see potential long if there's decent pullback.
NFP this week, BOJ interest rate release as well! Take note!
Do check out my recorded video for more insights!
Do Like and Boost if you have learnt something and enjoyed the content, thank you!
-- Get the right tools and an experienced Guide, you WILL navigate your way out of this "Dangerous Jungle"! --

Bitcoin sell technical analysis Description:
Bitcoin is rejecting major resistance near $94,000 after forming a bearish engulfing candle on the 4H chart.
• Key Resistance: $94,000–$95,000 zone rejected with strong selling pressure.
• RSI Divergence: Bearish divergence between price and RSI confirms weakness.
• Break of Support: Price broke minor support at $92,800, shifting short-term structure bearish.
• Moving Averages: Trading below the 50 EMA on the 4H chart, signaling bearish momentum.
Sell Setup:
• Look for entries around $93,500–$94,000 (retest zone).
• Stop-loss above $95,000.
• TP1: $91,000
• TP2: $88,500
Bitcoin is showing clear signs of a pullback — sellers are currently in control.