The most simple BTC time chartThis simple chart have been working for many years, now the expectation is around Dec 2025
BULLUSD trade ideas

Weekly Support for BitcoinYou can check this Chart for your referrence we have weekly support around price 85k level if this level can hold or stay for 1 month we are surely Bullish for bitcoin.
As of April 26, 2025, Bitcoin (BTC) is trading at approximately $94,032 USD, reflecting a slight decrease of about 1.1% over the past 24 hours. Despite this minor dip, Bitcoin has experienced a notable upward trend, gaining nearly 10% over the past week and approaching the significant $95,000 resistance level.
Fundamental Analysis
The recent surge in Bitcoin's price is influenced by several factors:
Geopolitical Developments: A recent call between U.S. President Donald Trump and Chinese President Xi Jinping to discuss trade tariffs has positively impacted market sentiment, contributing to a rally in risk assets, including cryptocurrencies.
Institutional Interest: The Federal Reserve's rollback of certain regulations has made it easier for Wall Street institutions to engage with Bitcoin and other cryptocurrencies, potentially increasing institutional investment.
Forbes
Market Predictions: Notable figures like Robert Kiyosaki have set optimistic price targets for Bitcoin, with Kiyosaki predicting it could reach $180,000 to $200,000 by the end of 2025.
Binance
However, technical analysis indicates that Bitcoin is forming a bearish triangle pattern, suggesting potential resistance around the $95,000 mark. If the price fails to break through this resistance, it could lead to a short-term pullback.
In summary, while Bitcoin's current trajectory is upward, investors should remain cautious and monitor both technical indicators and geopolitical developments that could influence its price movement.
If you like my content Analysis Please follow me :) Thank you for support I'll be giving more daily updates on this page if I got more followers here By the way I started Crypto Trading since 2014 11 Year's now in this Trading Journey I would like to give more Idea's for you guys

BTCUSD: Trading Signal From Our Team
BTCUSD
- Classic bearish pattern
- Our team expects retracement
SUGGESTED TRADE:
Swing Trade
Sell BTCUSD
Entry - 95407
Stop - 99310
Take - 88838
Our Risk - 1%
Start protection of your profits from lower levels
Disclosure: I am part of Trade Nation's Influencer program and receive a monthly fee for using their TradingView charts in my analysis.
❤️ Please, support our work with like & comment! ❤️

Bitcoin at Key Decision Point – Two Scenarios in PlayBitcoin is approaching a major trendline resistance after a strong rally.
At this stage, I see two possible scenarios:
1️⃣ Scenario 1 (More Likely):
Price could reject from this resistance zone, triggering a pullback toward the lower blue trendline support. This move would sweep liquidity, reset the market, and set up the next bullish leg.
2️⃣ Scenario 2:
If bulls manage to break above the resistance without a deeper pullback, we could see a continuation toward new all-time highs around 114k.
However, given the extended rally and weakening momentum, a correction first seems more natural.
⚡ I'm watching for reaction around the resistance and the orange zones for confirmation.
Patience is key — no need to chase!

BTCUSD – Long Trade Setup !📈🟢
Asset: Bitcoin / U.S. Dollar (BITSTAMP: BTCUSD)
Chart: 30-Min Timeframe
Pattern: Bullish pennant breakout setup
🔹 Entry: ~$94,200 (breakout + structure support)
🔹 Stop-Loss: ~$93,000 (below pennant and trendline)
🔹 Take Profits:
TP1: ~$95,500 – Near upper channel
TP2: ~$97,000 – Measured breakout target
⚖️ Risk-Reward Calculation
– Risk per Trade: ~$1,200
– Reward to TP2: ~$2,800
– R:R Ratio: ~1:2.3 ✅
🧠 Technical Highlights
– Strong pennant consolidation after big rally
– Higher lows holding tight on 30-min frame
– Clean breakout expected above $94,500
– Previous breakout patterns confirmed bullish continuation

BTC buy scalpBreakout on H1, Looking for pullback to my entry area, bullish engulf on m1 should be the confirmation.

Bitcoin(BTC/USD) Daily Chart Analysis For Week of April 25, 2025Technical Analysis and Outlook:
Bitcoin experienced a significant rally in this week's trading session, breaking through all identified Mean Resistance levels: 86400, 90600, and 94500. This breakout led to the completion of the Interim Coin Rally at 88400. As a result, the newest identified Interim Coin Rally at 95000 has also been completed, indicating a possible pullback to the Mean Support at 92000 and a further decline potential toward an additional Mean Support target at 88500. However, it's important to recognize the chance of upward momentum emerging from a retest of the completed Interim Coin Rally at 95000, which could advance toward the next Interim Coin Rally at 100000.

BTC is ready to blast
1. Here VOLUME totally compressed in 4 hrs time line chart and price is consolidating some what.
2.rsi is not breaking 60 level and adx is smoothed above 25 level
3.ketller channel is showing for not over bought or not oversold zone
conclusion : if price is break 96000 level it will move to monthly and quarterly resistant 102500 and this will be its first stop
This setup reflects a classic smart money concept, liquidity engineering followed by a return to inefficiency. The trade idea rests on the premise that markets rarely move in a straight line and often seek to rebalance themselves after aggressive trends. By allowing price to sweep the highs, fill the imbalance, and re-establish support, we can position ourselves with the trend in a favorable risk-reward context. The bias remains bullish, but execution depends on price reaction at key levels and confirmation of intent.

BTCUSD show signs of reversal with break of Trendline.BTCUSD show signs of reversal with break of downTrendline.

Bitcoin (BTC/USD) - Cup and Handle Breakout🔍 Pattern Identified: Cup ☕ & Handle 🏆 Pattern
🕒 Timeframe: 1-Hour Chart (1H)
💥 Breakout Level: Around $95,000
🎯 Projected Target: $97,073.75
📈 Technical Overview:
Bitcoin formed a rounded cup showing accumulation at lower levels.
After completing the cup, a small pullback (handle) indicated a healthy consolidation.
A strong breakout above the neckline resistance confirms the bullish pattern.
⚡ Actionable Insights:
As long as the price stays above the neckline, momentum remains positive.
A breakout generally leads to a strong continuation rally towards the projected target.
📊 Watch for volume confirmation for added strength.
⚠️ Caution if price slips back below the neckline – breakout may invalidate.
Disclosure: I am part of TradeNation's Influencer program and receive a monthly fee for using their TradingView charts in my analysis.

$BTC Positive Scenario & Recovery Strength... 4/26/2025CRYPTOCAP:BTC Positive Scenario & Recovery Strength...
50-D SMA: Cleared
38.2% of the recent decline ($88,506): Cleared
100-D SMA: Cleared
61.8% of the recent decline ($96,904): Underway, LHU! 😅
Full recovery of the recent decline ($109,665): YTS
Positive Scenario Target ($127,845): YTS
Cheers!

BTCUSD FORECAST 26APRIL 2k25Targeting short : targeting area remark.
Reason : Btcusd has been rally up for more than 8 hours and previous daily candle showing weak bull momentum.

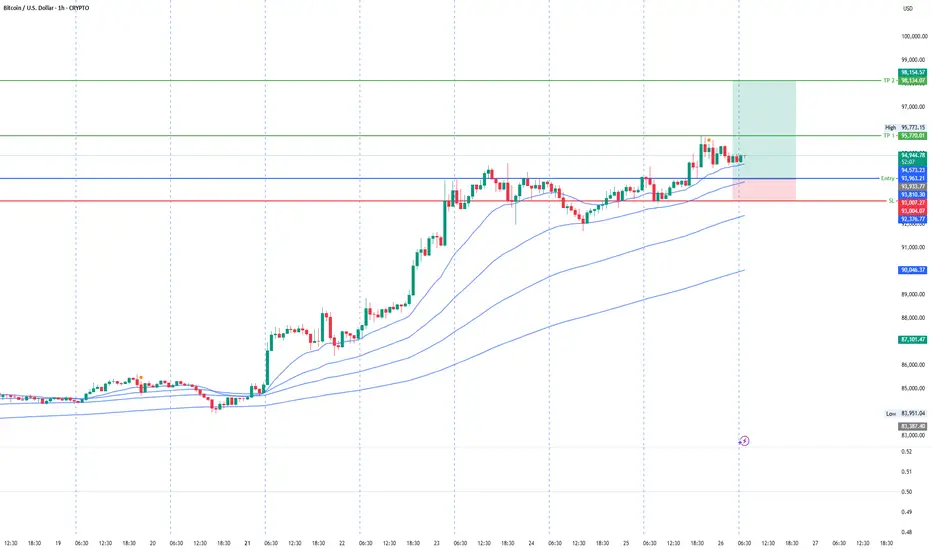
Bullish Trend Continues upto 98KUnder current market conditions, the area near 93929 has been identified as a critical support zone, where the AI model detects a high-probability trade setup.
Suppose the market demonstrates increased volume and price stability above key moving averages in the 93929 area. In that case, traders are advised to monitor for trend-continuation entry opportunities in alignment with the prevailing momentum.
Profit targets are defined at 95764 and 98143, corresponding to logical technical resistance zones. These levels are designed for staged profit-taking across different trade management styles. Stop-loss should be strictly enforced at the designated level; once breached, the strategy is considered invalidated to limit potential downside.
Nice Run on BTC. Now we will have a pull back till next ThursdayThat was a nice pump on BTC, Rest in Peace to the Shorts.
BTC now will have a pull back to .5 Fib or .618 by next Thursday.
WE ARE IN A BULL MARKET, CHART SPEAKS FOR ITSELF. TRUMP DOES NOT CONTROL THE MARKET.
If you think Trump/Covid/any media coverage move the market, then you will be forever manipulated by the media.
The market is NOT manipulated. The people are, through the media.

BTCUSD SellBitcoin 1 hour chart, consolidation between 91900-94600 levels. Now we have sell signal and target is support zone. Risk reward 1/3

USDJPY 15M FORECAST Hello guys, I hope you are well let me tell you that the price will go up now and it will go to the place where we have set the target and after that it will take a break of structure and the market will come down. The target will be our order block until the bullish.

Short on BTC - daily / weekly SupplyAfter Wyckoff delivered, I will now short BTC, based on daily Supply.
Not sure how far I'm going to take it down, (if it does go down) since I'm long term bullish.
But I expect at least a 1:1 bounce.
Will put my SL at BE then and see how far we can take it.
(Might also go to 50K or lower, but I'll be taking partials way before that.)

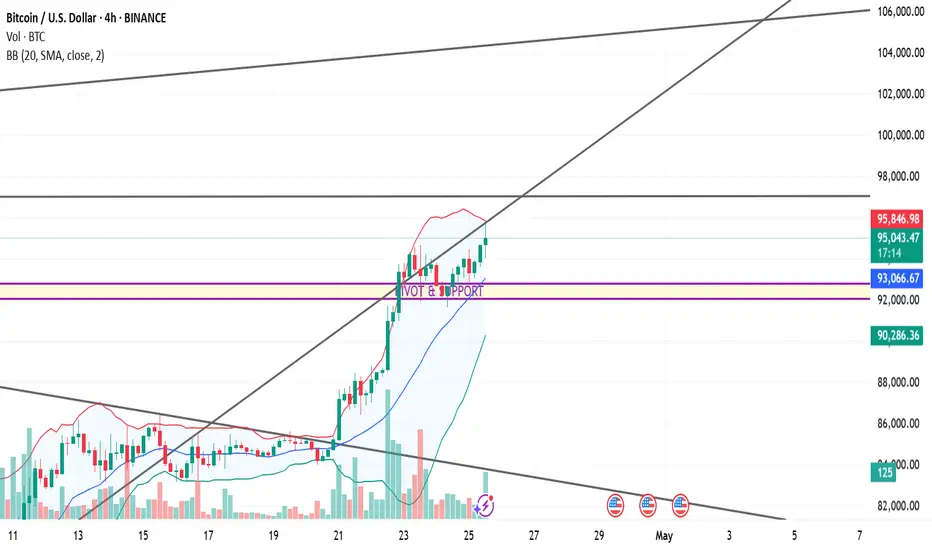
Bitcoin Technicals & FundamentalsBitcoin/US Dollar (BTC/USD)
Price Action Observations:
Trend: Strong bullish trend — price is above the middle Bollinger Band and riding the upper band.
Current Price: ~$95,410 (as of the chart time).
Immediate resistance near the upper Bollinger Band (~$95,921).
A major horizontal resistance is at around $98,000 (thick black line).
Local pivot/support zone marked around $92,400 – $93,100 (purple horizontal lines).
20-SMA (middle BB) acts as dynamic support (~$93,085).
Stronger support around $90,200 (lower BB).
Volume increasing on the bullish candles after the breakout around the 21st-22nd April.
Higher volume on green candles suggests genuine buying interest — not just a low-volume rally.
Bollinger Bands: Bands are expanding — classic signal for a volatile move.
Price is walking the upper band → continuation pattern as long as price doesn't break below the 20-SMA.
Trendlines: Ascending trendline beneath the current price → confirming higher lows.
There is a larger upper channel line sloping upwards targeting ~$105,000–$106,000.
Bias: Strong Bullish
Above 92,400–93,100 pivot zone = bullish structure maintained.
Immediate target: $98,000
Stretch target: $100,000 - $105,000 (upper channel resistance)
Invalidation: If price closes below ~$92,000 (break below pivot + mid-BB).
Fundamental Analysis (as of April 25, 2025):
If US Dollar (DXY) is weakening, it favors Bitcoin.
Fed policies — if there’s talk of rate cuts or holding rates steady, Bitcoin rallies.
Halving hype: Bitcoin halving happened earlier in 2024. Historically, it leads to a delayed but strong rally about 12-18 months later — we are now entering that "parabolic" zone.
ETF Inflows: BTC ETFs launched earlier have been drawing huge institutional interest.
Supply Shock: Fewer Bitcoins available on exchanges post-halving = price pressure upwards.
Global uncertainty (recession fears, wars, bank failures) = safe-haven demand for BTC.
Bitcoin being seen as "digital gold" strengthens its position.
My Final View:
Bitcoin remains in a strong bullish structure technically and fundamentally.
As long as it holds above ~$92,000–$93,000 zone, expect moves toward $98,000–$100,000+. A deeper retrace to $90,200 could still maintain the bull trend, but below that would signal weakness.
Btc bullish retest 100k levelBitcoin looking bullish as of this moment will try to hit 100k level again.
As of April 25, 2025, Bitcoin (BTC) is exhibiting a bullish trend, trading at approximately $95,203. This marks a significant recovery from earlier in the month when prices dipped below $76,000, and it's approaching the 2025 peak of over $100,000.
Investopedia
Several factors contribute to this positive momentum:
Macroeconomic Environment: The U.S. dollar has weakened, and gold prices have reached record highs, prompting investors to seek alternative assets like Bitcoin.
New York Post
Institutional Interest: Organizations such as ARK Invest have reaffirmed their bullish long-term outlooks for Bitcoin, with projections ranging from $300,000 to $1.5 million by 2030.
Investopedia
Regulatory Developments: Recent federal guidance has reduced oversight for banks offering crypto services, enhancing confidence in the cryptocurrency sector.
Investopedia
However, caution is advised. Market indicators suggest that Bitcoin may be approaching overheated conditions. Metrics like the Net Unrealized Profit/Loss (NUPL) and Market Value to Realized Value (MVRV) are nearing levels that historically precede corrections.
Crypto Tracker
In summary, while Bitcoin's current trajectory appears bullish, investors should remain vigilant of potential market corrections.

BTC into weekly resistanceBTC is pushing into weekly resistance, going to be interesting weekly close here, 2 more days for candle closure.
If we break above the upper blue box, we will most likely turn into buy the dip mode on higher timeframes.
If we reject here, new lows could be the target for the bears.

Geld Vision Investing with values — how ESG is changing More and more people today not only want to earn money, but also want to know where their money is going and what impact it is having . They want to invest in projects that are not only profitable, but also responsible and sustainable. This is precisely where the ESG investing approach comes into play—a concept in which returns and responsibility go hand in hand.
We explain in a simple and understandable way what ESG means, how it works and why this approach will become increasingly important in 2025.
What does ESG mean?
ESG stands for three central principles:
E — Environmental: Climate protection, CO₂ emissions, resource conservation, waste prevention
S — Social: fair working conditions, human rights, diversity and inclusion
G — Governance: Transparency, anti-corruption, ethical leadership
Companies with high ESG ratings try to act responsibly towards people, the environment and society.
Why invest in ESG?
ESG investing combines ethical values with economic rationality. The benefits are obvious:
Fewer risks. Companies with clear ESG policies are less likely to experience scandals or legal problems.
Long-term stability. Sustainable companies are more resilient to crises and more future-oriented.
Good reputation. Companies with strong values gain trust from customers and partners.
Political support. More and more countries are promoting sustainable economic activity.
The platform allows users to specifically search for ESG-compliant companies and funds and track their development.
ESG and returns – contradiction or win-win?
A common misconception: Companies that operate sustainably earn less. In fact, the opposite is often true.
Numerous studies show that ESG companies perform better in the long term because they:
be managed more efficiently,
respond better to crises,
Attract investors and talent more strongly,
be on the safe side from a regulatory perspective.
Sustainability and profit are not mutually exclusive – they complement each other.
How do I get started with ESG investing?
Clarify your own values. What's important to you? The environment, fair working conditions, equality?
Analyze companies. Many companies publish ESG reports that provide information about their goals and progress.
ESG funds are reviewed. These funds pool audited companies with good ESG ratings.
Review performance regularly. ESG is not a fad, but a long-term approach with measurable results.
GeldVision offers tools that allow you to filter, analyze, and incorporate ESG data into your investment strategy.
In which industries does ESG play a major role?
Renewable energies — solar, wind, hydrogen
Sustainable consumption — environmentally friendly packaging, recycling
Technology and digitalization — inclusive and ethically managed companies
Education and health — socially relevant sectors with great impact
FinTech — Platforms that make investing more transparent and fairer
The ESG approach can be applied across industries—it is not a trend, but a new way of thinking.
Who relies on ESG?
Young investors. Generation Z and Millennials value values.
Large investment funds. ESG is an integral part of their strategy.
Private investors. People who want to make a positive impact with their money.
So ESG is no longer just for idealists — it has become mainstream .
What does Money Vision offer?
The platform helps users invest with a clear conscience. It offers:
Access to ESG rankings and sustainability data
Filters for targeted investment decisions
Market analyses on green and social trends
Support in building a balanced portfolio
Whether you’re a beginner or a professional, Geld Vision makes sustainable investing easier and more transparent.
ESG investing is more than just a trend. It's a new, future-oriented perspective on money, markets, and responsibility.
You can invest today without betraying your values —and still achieve attractive returns. With the right knowledge, the right tools, and platforms like Geld Vision, sustainable investing becomes a true success model.
Because investing responsibly means making profits while contributing to a better world.

$BTC Just Hit $95K – Bullish Breakout in Motion🔸
Price has broken above the key $90K resistance zone and is now pushing higher with strong momentum.
🔸 Support Now at $90K:
What was resistance is now support. As long as BTC stays above this level, bulls are in control.
🔸 Next Target: $100K+
The breakout opens the path toward $100K and possibly new all-time highs.
🔸 Risk Level: $90K
If BTC falls back below $90K, we could see a pullback. Above it = bullish.
Still holding? Ride it toward $100K
Looking to enter? Wait for a retest around $91K– GETTEX:92K
Falls below $90K? Reassess trend
BTC looks strong — momentum is with the bulls!

BTC Trade Idea — React, Don’t PredictBINANCE:BTCUSD
Smart Trading Requires Patience!
Bitcoin is currently undergoing a healthy correction.
Strong support is located around $87,500, and if confirmed by price action, it could offer a great buying opportunity.
Trading without a plan = gambling!
** Alternative Scenario:
If the $87,500 level breaks with strong confirmation, after a pullback to this zone, a short
opportunity could emerge.
Follow us for more professional insights!
#CryptoAnalysis #BTCUSD #TradingStrategy #Forex #Cryptocurrency
