BTC is testing the Resistance level $95,000.00 👀 Possible scenario:
Bitcoin has rebounded above $93,000, signaling a potential end to its 52-day downtrend from the $74,400 low. A 10% rally (April 20–24), fueled by $2.2B in ETF inflows and $390M in short liquidations, puts bulls in reach of the $100,000 target. A move above $95,000 could trigger another $700M in liquidations.
Institutional demand via ETFs is reshaping the market. On April 23, Bitcoin ETF inflows hit a record $912M, suggesting renewed bullish sentiment. Meanwhile, a weakening dollar and pessimism in equities are pushing capital into BTC, now among the world’s top 8 assets by market cap. Holding $90K supports further gains; falling volumes may signal a pullback.
✅Support and Resistance Levels
Support level is now located at 83,000.00
Now, the resistance level is located at 95,000.00.
BULLUSD trade ideas

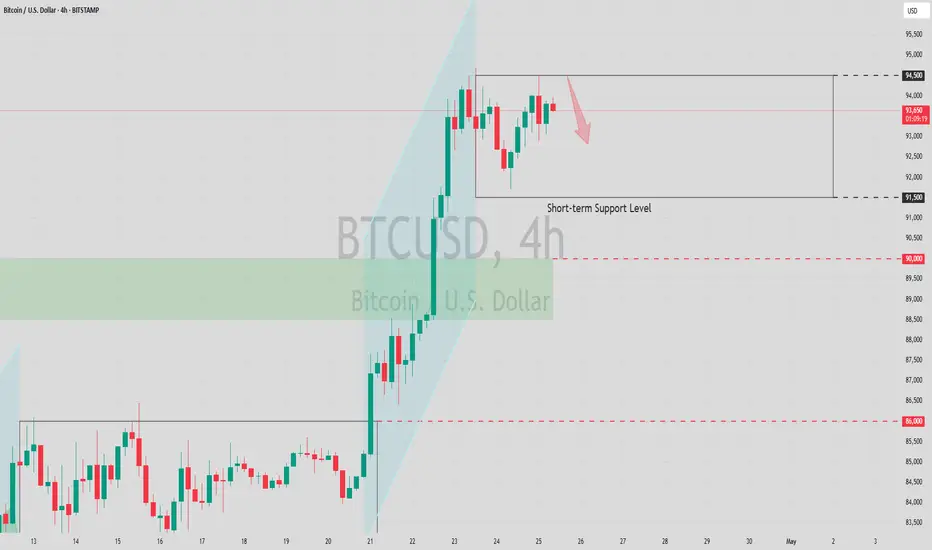
Short-term shorting opportunities emergeBTC encountered significant resistance near $94,500 during this week's rally, and short-selling operations can be attempted when approaching this price level.
BTCUSD
sell@94000-94500
tp:93000-92500
I hope this strategy will be helpful to you.
When you find yourself in a difficult situation and at a loss in trading, don't face it alone. Please get in touch with me. I'm always ready to fight side by side with you, avoid risks, and embark on a new journey towards stable profits.
btc . w4 . fancy SHORTthe 'OTF - one time frame' Break of the monthly is still due.
There was no chance for LONGS during the week for retail buyers, only late buyers.
We've traded 2 days just under resistance, accumulating:
- late LONGS
- early SHORTS
I'm willing to SHORT now on friday, once the OTF has been hit.
Scalling in from cwHigh upwards
Invalidation would be to keep pumping and then potentialy SFP on monday for downside.
R:R is alright! I like to give myself a 3% invalidation range till SL.


April 23 Bitcoin Bybit chart analysisHello
It's a Bitcoinguide.
If you have a "follower"
You can receive comment notifications on real-time travel routes and major sections.
If my analysis is helpful,
Please would like one booster button at the bottom.
Yesterday, after a long time, the participation rate on TradingView was good, so
I will continue with a series of full-public analysis articles.
At the top is the Nasdaq 30-minute chart.
There will be an indicator announcement at 11 o'clock in a little while.
Based on the gap section created at the top and bottom,
I predicted the movement of the blue finger movement path.
This is the Bitcoin 30-minute chart.
Recently, Bitcoin has been moving autonomously,
and Tether dominance is in a vertical decline.
I won't tell you the reason for the Nasdaq decoupling separately.
The core of today's strategy is trend following.
I have never talked about all possibilities up and down without a single entry point.
*One-way long position strategy when the red finger moves
1. 93,068.9 dollar long position entry section / cut-off price when the purple support line is broken
2. 96,784 dollar long position 1st target -> Good 2nd target
Please note that the possibility of a new high is very high when the Good section is broken.
From 1 to Gap 8 at the top,
if coupled with Nasdaq, it is an upward wave. (After touching the top, wait for a long entry at the bottom)
Since the success rate can be high, please consider it as a long wait without operating a separate short position
Up to section 2 is the maximum long position waiting section.
Bottom->3 is a downward sideways movement.
The reason why I set the stop loss price when the purple support line breaks today is
Because it is the place where the previous low of the daily candle created today is broken
If it is pushed hard, it can fall to the bottom 89,597 dollars (1+4) section.
Up to this point, please use my analysis article only for reference and
I hope you operate safely with principle trading and stop loss prices.
Thank you.

BTC? 2.4M Cathie said by 2030
CATHIE WOOD SAID:
www.tradingview.com
Wow..
I like the idea 24X
Below 100k will look like peanuts from moon.
300 to 17000 took 830days
3800 to 55000 took 800 days
IF now is day 5 of this bullish move >> It will end somewhr in August 2027 :)
Say you are on for this ride.
Don't look at charts daily.
A 5000$-10000$ swing/ move is jiffy
What's your plan?
Definitely for this investment is should be your... not in use $
or DCA (I heard)
IDK
All the best guys
Hope you be safe & enjoying your weekend.
Obviously not a guru

uptrendThe trend change is expected to form within the specified support range and time frame and we will witness the start of an upward trend.

Bitcoin is showing resistence this level is key level and the bitcoin might go down....swipping liquidity to the moon

$BTC - Road to $140K#Bitcoin will hit $140K but needs to firstly close above GETTEX:87K and above $109K with a mandatory retest of $106.5K DYOR.
Perfect retest of previous resistance as support backs my idea for the next bull run, although the aforementioned terms are obligatory.

double three (running)Took a harder look at the surge in the price of bitcoin. It turns out we may have a running double three (WXY) for wave 2.
W is a flat, X is a zigzag and Y is a triangle. And the end of wave 2 is higher than the end of wave 1, thus we call this double three combination a running variation. A strong and powerful wave 3 should follow next with at least 1.618 of wave 1. It could be 2.618 of wave 1, but it definitely will be an extended third wave.

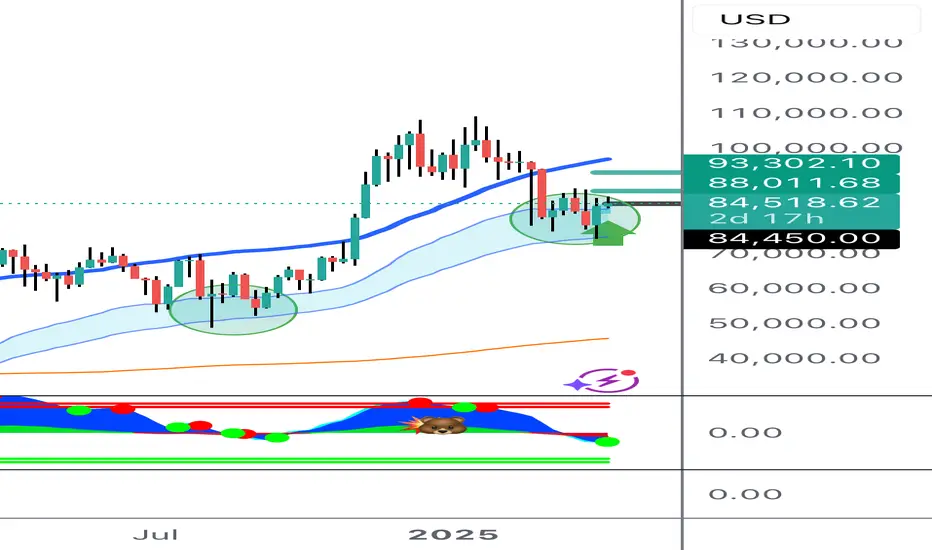
Bitcoin buy 84450 from weekly support Bitcoin declined to test weekly support SCD band.
This is second test in current run. First test was around 55000.
This second test. Usually first and second tests of blue support SCD band provide a good buying opportunities. And everything after third test is not reliable . At the same time on 4hr chart bitcoin breaking above the block of resistance moving averages and now sitting on top .
Buy 83500-84500 for continuation of the upmove to test top Bolinger on 4 hr chart first around 88000 and then test of top Bolinger in weekly around 93300.
BTCUSD will be strong B ? BTCUSD will be strong B to make new highs and go down again to close point C before going up significantly.

$BTC $GOLD Performance% Comparison Chart (Apr '24-Apr '25)Performance% Comparison Chart (Apr '24-Apr '25)...
CRYPTOCAP:BTC surges back, locking in a 42% gain alongside TVC:GOLD over a year! S&P 500 shows life, but #Oil is the big loser, taking the biggest hit with a brutal -26% decline. Let's watch the shifts! But where does the momentum go next?!🤔
CRYPTOCAP:BTC TVC:GOLD SP:SPX MARKETSCOM:OIL
Cheers!

Price targetsBased on previous moves, time over the center and momentum I marked possible price target spots and circled the general area. Enjoy!

btcusd 50% down to 50000 till end of year like 2021-2022 Bitcoin could drop -50% like in 2021-2022 Bear Market close to 40-50 000 $
One year long Bear market is possible due to economic and geopolitical turmoil by further idiotic decisions of trump administration that will surly happen many times this year

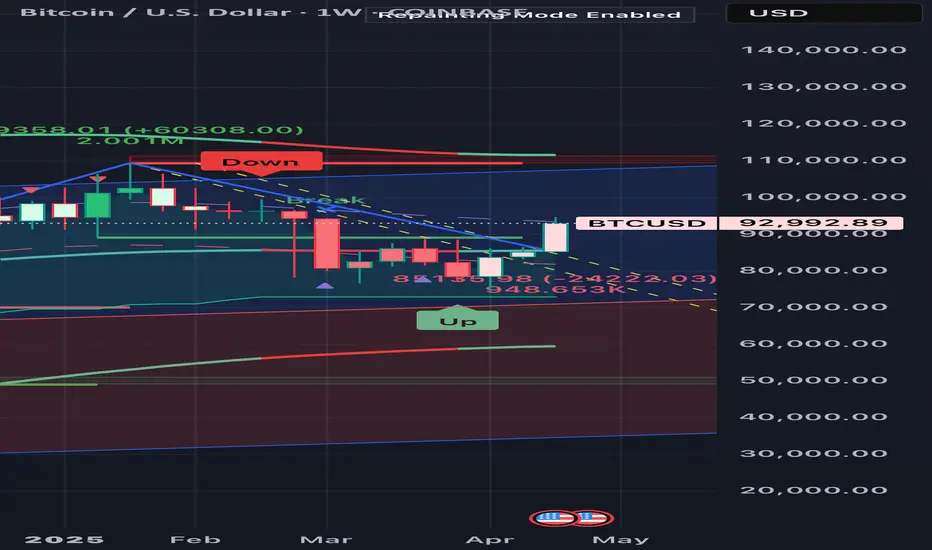
Technical Analysis Idea for BTC/USD (1W Chart - Coinbase) CurrenSuggested Strategy (just an idea):
• Speculative long entry: $93,000
• TP1: $98,000
• TP2: $103,000
• SL: $85,000
BTCUSD 1H Forecast Hello guys, I hope years are well let me tell you that right now the order is stuck at the Bearish OB, so we will sell from here and this will remain our target until the Bullish OB and after that, our next target will remain ours until the resistance area.

BTCUSD 1H ForecastHello guys I hope you are well let me tell you that right now the order is stuck at the Bearish OB, so we will sell from here and this will remain our target until the Bullish OB and after that, our next target will remain ours until the resistance area.

would you look at that ...Looks like my imaginary lines are secretly controlling the price of BTC—haha!

BTC on THE WAY UP .....Broken out of the falling Channel. just took supp at 50% of fall from ATH to recent low.
TIME TO RISE...... Lete See ;)

BitcoinBTCUSD
- Bullish Channel as an corrective pattern in Short Time Frame
- Break of Structure
- RSI - Divergence
- Change of Characteristics
- Completed " 123 " Impulsive Waves

Pullback to 87-88KMorning folks,
So, our 2-week journey successfully over, market hits 93K targets and even overcome them a bit, completing H&S AB=CD extension. Now what?
In general we expect very good 1-3 months for BTC based on our recent fundamental report. Speaking about short-term situation. Market is obviously overbought a bit. So we prefer to wait for pullback somewhere to ~87-88K area before considering any new longs.

btc . bullish tp HIT . no more LONGS . rather SHORTthe bullish progression went well. now out of the LONG trade.
we're on SELL for the DAY. NO LONGS, risk/reward is crap.
we're on LONG once we see a decline and support holding, preferably during session timing confluence.
looking to SHORT with confluence and Session timing. towards 87k or lower.
looking to LONG with confluence from 87k if holds.
