BULLUSD trade ideas

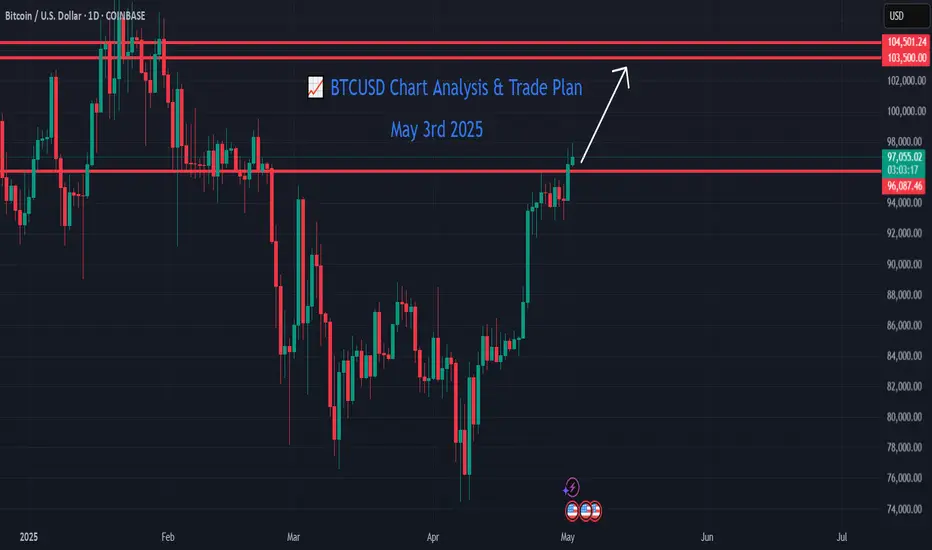
BTCUSD Chart Analysis & Trade Plan ( May 3rd 2025 )📈 BTCUSD Chart Analysis & Trade Plan
Instrument: BTCUSD
Trade Setup: Long
Entry Price: $96,900
Take Profit (TP): $103,500
Stop Loss (SL): $93,830
Risk-Reward Ratio (RRR): 2.15
Timeframe Observed: 4H / Daily
Time Horizon: 2–4 days
Strategy Type: Trend Continuation
🔍 Technical Overview
Trend: BTCUSD is exhibiting a bullish continuation pattern, forming higher lows and higher highs on both 4H and Daily charts.
Support Levels:
Primary: $96,500–$96,900 (current entry zone, previous breakout retest zone)
Secondary: $94,800 (key horizontal + Fibonacci retracement support)
Resistance Levels:
Short-term: $100,800
Medium-term: $103,500 (aligned with Gann and Elliott targets)
🌀 Elliott Wave Analysis
Primary Wave Count (4H chart):
BTCUSD appears to be in Wave 3 of (3) of a bullish impulse cycle.
Wave (2) retracement completed near $96,000 with a sharp ABC correction.
Wave (3) projection gives a Fibonacci extension target:
100% of Wave 1 = ~$103,500 — aligning with our TP zone.
Subwaves inside Wave 3:
Wave i and ii completed.
Currently progressing through Wave iii — often the strongest, highest momentum wave.
Implication: If Wave iii holds, BTCUSD could accelerate toward $103,500 within the next 48–72 hours.
📐 W.D. Gann Analysis
Gann Fan (drawn from $60,000 low):
Price has reclaimed the 1x1 line (balance of time and price) around $96,000.
Next resistance lies near the 1x2 Gann angle at ~$103,300–$103,500.
Gann Square of 9 levels:
$96,800 is a key Gann pivot price.
The next natural harmonic level on the Square of 9 lies at $103,500, affirming this zone as a major Gann target.
Implication: Gann time/price analysis supports a rally to $103,500 before the next cycle pause.
📝 Trade Plan Summary
Parameter Value
Entry $96,900
Take Profit $103,500
Stop Loss $93,830
RRR 2.15
Timeframe 2–4 Days
Justification:
Entry aligns with Elliott Wave corrective low (Wave 2).
Gann angle breakout confirms time/price balance in favor of bulls.
Confluence of Fibonacci projections, harmonic levels, and structural support.
⚠️ Risk Notes
If BTCUSD fails to hold above the $96,500–$96,000 zone, reevaluation is needed.
Global macro factors and ETF flows should be monitored, as they could cause volatility.
btc levels my last post was off because i was trying something new pit int wrong info but got new levels btc holding 97218 if can hold this and 97037 we are going to break 97483 97825 get new resistance at 98553 lock in profits

Bitcoin to create new All Time High?Fundamental Analysis
Uncertainty with the Dollar.
Institutional adoption of Bitcoin undergoing unprecedented acceleration.
COT report(Bitcoin Micro Futures) as of: April 29, 2025 shows Non-commercial traders still net short(-3,958) however, a larger percentage of investors who were short the previous week have closed their short positions(-17,401) as opposed to those long(-758).
Technical analysis(Daily TF)
Possible low of the year formed in April(on the 7th)
Displacement of sellers with buy stops above previous highs(2nd & 24th March)
-2 scenarios possible;
1. Correction to fill the liquidity void created on 20th-24th of April then continuation of the bull run or
2. If the daily FVG formed on the 1st of May holds, it could support price higher.

Btc heads and shoulder formation Longterm (Neutral)heads and shoulder forming, bullish/bearish depending if your a day trader or a hedge funder. Similarities to Jan 11 2021 Heads and shoulder, Short term bearish, long term bullish

Bitcoin - Resistance level 97262 posted on 22nd April.Look at the Resistance level 97262 posted on 22nd April. How this level is acting as a perfect resistance level.
Previously posted levels:
Upside: 97261.50 & 110958.00
Downside: 60737.50 and 47041.00
First target is hit.


BTCUSD/BITCOIN | M30 | SELL LIMIT ORDERHey There,
I'm currently waiting for the level I've targeted to enter a sell position on Bitcoin.
I've shared the exact entry level with you below.
Just a heads-up:
This trade carries high risk due to potential market manipulation.
Please trade cautiously and avoid taking on too much risk.
SIGNAL ALERT
SELL LIMIT ORDER (BTCUSD/BITCOIN) 97,000/97,500
🟢TP1:96,850
🟢TP2:96,654
🟢TP3:96,100
🔴SL: 98,390
Traders, your likes are always my biggest source of motivation for me to share analysis. For this reason, I would like to ask each and every one of my followers; please do not miss your likes.
I sincerely thank everyone who supports me with their likes.

technical analysis chart of the EUR/USD currency pair on the 1-htechnical analysis chart of the EUR/USD currency pair on the 1-hour timeframe. Here’s a breakdown of what’s visible:
Chart Setup:
The chart is for the Euro / U.S. Dollar (EUR/USD).
The current price at the time of the screenshot is around 1.13560.
The analysis includes three marked peaks (highlighted with orange circles), likely indicating a resistance zone or a head and shoulders pattern.
The lower red box represents a support zone or stop-loss area, with price levels marked between approximately 1.13305 and 1.13555.
The large green area with an upward zigzag arrow suggests a bullish projection, with a target area around 1.15426–1.15600.
Indicators:
No visible indicators are overlaid, suggesting a price-action-based analysis.
The analyst appears to anticipate a bullish reversal from the support zone.
Trading Idea:
Entry is near the current price level.
Stop-loss is set below the red zone (~1.13305).
Take-profit target is near the top of the green zone (~1.15600).
This gives a risk-reward ratio that favors long trades.

BTC Potential Long Setupwaiting for a 5 min hidden divergence on the MACD and price returning to OTE levels to confirm my setup

BTC back to ATH “The continuation of this bullish momentum should keep going. We might have a small retracement soon, but if we do not break structure. Then I see no reason to exit the trade before hitting ATH .

My buy view for BTCFollowing my previous analysis, BTC has retraced back to around $95K zone.
If the zone continues to hold, we should expect BTC to continue to rally towards north.
Lets keep our eyes on $100K target if the support zone of $95 holds strong

Bitcoin: The Path To 109K Is Now Open.In my previous article I describe the potential breakout if 88K was compromised. I pointed out, the compound double bottom in the 74 to 78K area implied a greater probability of price breaking out, it was just a matter of catalyst. IF anything this possibility should have told you that swing trade shorts are a lower probability and much riskier within that resistance zone. For those of you looking for precise calls, eventually you will learn there is no such thing, because markets adjust to new information as it becomes available but we can assign loose probabilities to scenarios. So what technical possibilities are we looking at for the upcoming week and how will this shape our expectations?
On my chart, the updated anticipated scenario (See illustration) points to a retrace back to the 90K area which is NOW a support. Since the broader trend is bullish it is within reason to expect this support to HOLD and NOT break. That means it is an ideal location for high probability swing trade longs UPON confirmation. Watch 93,250 break (see blue arrow) to confirm price is following the retrace scenario (break of previous candle low). IF this is not broken, then the retrace scenario is NOT in play.
Another fact I want to point out is a new minor impulse structure is now in effect (it is not numbered on the chart). The move from the 74K low to the current high contains 3 waves which means the next retrace is likely Wave 4 which would then open the possibility for the Wave 5 breakout beyond the 95K area. Wave 4 to 5 is the highest probability wave to anticipate because it requires 3 waves to be in place and has to adhere to the Wave 1 overlap rule. While this does not offer a specific setup to trade, it does help to shape a clear expectation. All you need from there is a system or method to confirm the bullish reversal (like the Trade Scanner Pro).
Other than that, If Bitcoin manages to maintain the support above 90K, this new rally may be the broader Wave 5 that I have talked about previously which implies a test of 109K over the next quarter. Again this is a game of gauging potential and then quantifying the risk that is associated with it. That is only the beginning of the trade idea because from there you must have a decision making process in place to manage the trade in a constantly CHANGING environment. IF you fail to have such a process then you face random results.
Thank you for considering my analysis and perspective.

BTC/USD 1-hour timeframe chart, showing a bearish setup.
This is a BTC/USD 1-hour timeframe chart, showing a bearish setup. Here are the key elements:
Sell Zone (Resistance Area):
The zone around 95,379 to 95,622 is marked as a "SELL ZONE" (highlighted in green and yellow).
This area has acted as strong resistance multiple times in the past.
Current Price:
BTC is currently trading around 94,145.
Support Levels:
First support is marked at 93,079.
The next major support level (and likely target for the bearish move) is 91,572.
Price Projection:
The expectation is that price will move up slightly into the sell zone, then get rejected.
After rejection, the price is projected to break below support and fall toward 91,572 (as indicated by the red arrow).
Market Bias:
The setup shows a bearish bias, suggesting a short (sell) trade from the resistance zone.

BTC Buy SetupROBERT055
Summary:
Entry Zone (Buy): Near around 95,500 – 96,000
TP1: 99,000
TP2: 103,000

BTC Short term Long setupLooking at the chart, the 5 min time frame showed a bullish hidden divergence. as well as a retracement back into the OTE level. i expect price to sweep the high to rebalance to equilibrium of previous range, or this could be a major reversal happening. either way I'm not predicting i react to what the market does.

Will risk-on sentiment continue to fuel Bitcoin's rally?
President Trump stated that he is open to reducing tariffs on China and that negotiations with key partner countries are progressing smoothly. However, he also revealed via social media that he has ordered a 100% tariff on certain foreign-produced films, signaling that tariff risks remain.
The ISM Services PMI for April came in at 51.6. New orders rose to 52.3, marking the highest level this year, while prices paid continued to climb for a fifth consecutive month, reaching the highest level since January 2023.
BTCUSD is consolidating between the two EMAs after breaking below the lower boundary of the ascending channel. The price is awaiting a fresh trigger to resume its uptrend. If BTCUSD falls below the EMA78, the price may decline further toward the support at 91000. Conversely, if BTCUSD re-enters the ascending channel, the price could gain upward momentum toward the resistance at 98500.

BTC Poised for Bullish continution / Smart money long setup🟢 BTCUSD | Long Setup Based on Smart Money Concepts (4H Timeframe)
Bitcoin is showing a potential bullish continuation after tapping into a key demand zone (Order Block) aligned with Smart Money Concepts.
🔍 Breakdown:
BOS (Break of Structure) confirms a shift in market structure, indicating bullish intent.
Price formed a new Higher High (HH) followed by a retracement into a 4H Bullish Order Block, highlighted in orange.
Liquidity below internal range lows has been swept, grabbing sell-side liquidity before reversing.
Strong bullish reaction from the OB zone suggests smart money accumulation.
📈 Anticipated Scenario:
Price is expected to form a new Higher Low (HL) and continue its bullish trend by breaking above recent highs — targeting levels near $97.7K, $96.1K (minor retracement), and ultimately $99.5K.
🎯 Entry Idea:
Long from the OB zone with confirmations (e.g., bullish engulfing or LTF BOS).
SL below the OB.
TP at key liquidity zones & imbalance fills.
🧠 Smart Money Bias: Bullish
Timeframe: 4H
Confirmation: Break of internal structure + bullish reaction from demand

BTCUSD... 1H CHAT PATTERN Here’s a breakdown of the BTCUSD trading idea you’ve presented:
---
### 🟢 **Trade Setup (Long Position)**
* **Entry Price:** 9692
* **Stop Loss:** 9550
* **Targets:**
* **1st Target:** 9800
* **2nd Target:** 9900
* **Final Target:** 10000
---
### 📊 **Trade Metrics**
* **Risk (Stop Loss Distance):** 9692 - 9550 = **142 points**
* **Reward:**
* **To 1st Target:** 9800 - 9692 = **108 points** (R\:R ≈ 0.76)
* **To 2nd Target:** 9900 - 9692 = **208 points** (R\:R ≈ 1.46)
* **To Final Target:** 10000 - 9692 = **308 points** (R\:R ≈ 2.17)
---
### ✅ **Key Considerations**
* The reward-to-risk ratio improves at each target level.
* Make sure price action or indicators support this long bias at 9692.
* Adjust position sizing based on your risk tolerance (typically risking 1–2% of capital).

Bitcoin - consolidation will lead to continuation (up)
Very basic chart.. only needs one markup !
- Institutional buyers are scared the price will drop
- Retail buyers are worried it drops (like so many are predicting)
But nobody knows where it will go next.
Common sense - After consolidation comes continuation... it wont go sideways much longer, its lightly to go up at least to the 100+ range.
That's my short summary for the next few weeks.

#202518 - priceactiontds - weekly update - bitcoinGood Evening and I hope you are well.
comment: Only Thursday was bullish and right now market is trying to decide if this breakout was legit or not. If bulls can stay above 95000, the breakout above has a higher chance of being succesful. Below 94000 it has likely failed and I favor the bears for more downside.
current market cycle: weekly chart says continuation of the bull trend but i highly doubt it. much more likely we are in a big trading range 73000 - 110000
key levels: 85k - 100k (if bears somehow manage to get below 85k again, we test 80k next)
bull case: Bulls want this breakout to be the start of the third leg up for 100000. That’s all there really is to it. Bull trends need higher lows and higher highs and if bulls fail to prevent the market from falling below the breakout bar under 94000, this was likely a bull trap.
Invalidation is below 94000.
bear case: Bears want a trading range 70000 - 98000 and not let market hit 100000 again because that would for sure attract more degenerates again. Bears really don’t have much here until they print a decent bear bar that gets below 94000. This looks as bullish as can be and above 98000 I expect 100k to be hit.
Invalidation is above 101k.
short term: Neutral. Below 94000 it’s likely a failed breakout and above 97000 we can expect 100000 or more. Above 100000 there would not be a reason not to go for a new ath, same as for other markets like dax.
medium-long term - Update from 2025-04-13: Bear targets for this year are met. Now we likely range before we get new impulse to either side. I wait for market reaction around 100000 before I write more here. For now my assumption is still that this will be a trading range 73000 - 100000 for longer than a retest or even new highs.

Btcusd buyThe market is in an uptrend while also taking liquidity and hitting the 61.8 fib line. The volume is show a big move coming as well.