BTC Market Outlook: Bullish Breakout or Bearish Breakdown?This idea analyzes Bitcoin's (BTC) potential market direction using a combination of RSI, MACD, and trend lines, with the 0.6 Fibonacci retracement level as key support. The Relative Strength Index (RSI) is monitored for overbought/oversold conditions, while the Moving Average Convergence Divergence (MACD) highlights momentum shifts and potential crossovers. Trend lines are drawn to identify critical resistance and support zones, with the 0.6 Fib retracement acting as a pivotal support level. A bounce from this level with bullish RSI divergence and a MACD crossover could signal a bull market continuation, targeting new highs. Conversely, a break below 0.6 Fib support, accompanied by bearish RSI and MACD confirmation, may indicate a bear market, with downside targets at lower support zones. Watch for volume spikes and price action at these levels to confirm the trend.
BULLUSD trade ideas

Time for a Bitcoin pull back?Finally bitcoin broke out of its consolidation/ down trend.
it looks like we could get lucky and have a nice little pullback to the green box.
If we are so lucky, buy with all you have. It may be the last time you see this price for a long time. When you see it next you probably wont want to touch Bitcoin with a 10 foot pole.

BTC Short from 93950Officially short BTC
via BTCZ
I think we might pop a bit more to 94400 in the morning but this should be it
I repositioned the fork so it touches previous highs (red arrows)

BTC/USD Eyes $109K After Bullish Breakout!!🧠 Chart Type and Indicators:
Chart Type: Candlestick
Indicators Used:
EMA 50 (red line): 85,335.18
EMA 200 (blue line): 85,657.29
🔍 Technical Pattern Analysis:
Pattern Identified: Ascending Triangle
The price has formed higher lows (ascending trendline support) while repeatedly testing a horizontal resistance zone (~$88,000), forming an ascending triangle.
This is typically a bullish continuation pattern when it occurs after an uptrend, though in this context, it's forming after a consolidation, giving more significance to the breakout.
🚀 Breakout Confirmation:
The price has broken above the horizontal resistance and is currently trading at $92,766.51.
Volume is not visible but should be increasing during a valid breakout.
Both EMAs have been decisively breached to the upside, signaling momentum shift in favor of bulls.
🧩 Key Levels:
Support Zone (Post-Breakout Retest): ~$88,000
Previously a resistance zone, now likely to act as support.
Immediate Resistance: ~$96,000
Historical resistance zone shown on the chart with a horizontal black line.
Extended Target (measured move): ~$109,420
Based on the height of the triangle projected from the breakout point.
📈 Price Action Forecast:
Two possible scenarios (depicted with arrows on the chart):
Bullish Continuation:
A retest of the $88,000 zone followed by continuation to $96,000, then $109,420.
Short-Term Pullback:
Price may dip to retest the breakout zone (~$88,000), consolidate, then rally higher.
✅ Bullish Signals Summary:
Breakout from a bullish ascending triangle.
EMAs crossed and price holding above them.
Clear higher highs and higher lows formation.
Momentum suggesting further upside.
🧨 Risks to Watch:
False Breakout Risk: If the price fails to hold above $88,000 and falls back into the triangle range.
Macro Factors: Bitcoin remains sensitive to macroeconomic news and regulations that could disrupt technical setups.

Bearish Butterfly on the pet rock.pretty textbook if you ask me. Seems like they want some more noob moonboi liquidity before they REK you next month.

BITCOIN RESISTANCE AHEAD|SHORT|
✅BITCIN is going up now
But a strong resistance level is ahead at 94,900$
Thus I am expecting a pullback
And a move down towards the target at 91,000$
SHORT🔥
✅Like and subscribe to never miss a new idea!✅
Disclosure: I am part of Trade Nation's Influencer program and receive a monthly fee for using their TradingView charts in my analysis.

Bitcoin short from 95500$Waiting for 95.5k npoc level and i am entering short , target 91k and 86k.
Lets see what this pump brings on.
We can also see 98k npoc close , if that does more agressive on shorts.

Forget Tariffs: Why Bitcoin Cares More About ETFs Than EarningsBitcoin's Great Decoupling: Why It Ignores Tariffs and Earnings, Fueled by Fundamentals and ETF Billions
In the complex tapestry of global finance, assets typically dance to the tune of macroeconomic news, central bank policies, corporate earnings reports, and geopolitical tensions like trade tariffs. Stocks rise on strong profits, bonds react to interest rate shifts, and currencies fluctuate with trade balances. Bitcoin, however, increasingly appears to be charting its own course, seemingly indifferent to the traditional market drivers that dictate the movements of legacy assets. This phenomenon, often termed "decoupling," isn't just a statistical anomaly; it's rooted in Bitcoin's fundamental nature and is gaining significant validation through the burgeoning success of US-listed Bitcoin Exchange Traded Funds (ETFs).
The core argument, as highlighted in recent market commentary, is compelling: Bitcoin's value proposition isn't tied to quarterly earnings calls, CEO performance, or the potential impact of import tariffs. It has no central bank adjusting its supply or setting its interest rate. Instead, its perceived value stems from a unique set of characteristics: verifiable digital scarcity capped at 21 million coins, a decentralized network resistant to single points of failure or control, and an emerging role as a neutral, global reserve asset in an increasingly politicized and fragmented world.
Fundamentals Over Fleeting News Cycles
Traditional assets are intrinsically linked to the health of economies and corporations. A weak earnings report can send a stock tumbling, while fears of a trade war can ripple through entire sectors. Bitcoin exists outside this framework. Its "earnings" are the security and finality provided by its blockchain; its "management" is the distributed network of miners and nodes enforcing consensus rules; its "monetary policy" is embedded in its immutable code.
This inherent separation means that while traditional markets might gyrate based on the latest Federal Reserve announcement or geopolitical flare-up, Bitcoin's trajectory is often more influenced by factors specific to its own ecosystem: adoption rates, network upgrades, regulatory clarity (or lack thereof), halving events that reduce new supply issuance, and, crucially, capital flows into vehicles that provide access to it.
The narrative suggests Bitcoin is maturing into something akin to a digital version of gold – an asset valued for its scarcity and neutrality, acting as a potential hedge against inflation, currency debasement, and systemic risks within the traditional financial system. In a world grappling with high debt levels, persistent inflation, and geopolitical instability (like the mentioned US trade war volatility), the appeal of a non-sovereign, mathematically scarce asset grows.
ETF Inflows: A Roaring Stamp of Approval
The most potent evidence supporting this decoupling narrative and Bitcoin's growing acceptance comes from the recent performance of US spot Bitcoin ETFs. Launched earlier in the year, these products represented a watershed moment, providing regulated, accessible exposure for institutional and retail investors alike through traditional brokerage accounts.
Recent data underscores their impact. On April 21st, these ETFs collectively witnessed their largest single-day net inflows since the initial launch frenzy in January, pulling in a remarkable $381.3 million. This surge in demand, with notable contributions like the $116.1 million flowing into the RK 21Shares Bitcoin ETF (ARKB), coincided directly with significant positive price action. Bitcoin decisively broke through previous resistance levels, reclaiming the $91,000 mark after a seven-week consolidation period.
These inflows are more than just numbers; they represent a tangible shift in capital allocation. They signal growing institutional comfort and strategic positioning in Bitcoin. Unlike speculative futures-driven rallies, inflows into spot ETFs reflect direct demand for the underlying asset, potentially building a more stable foundation for price appreciation. This influx suggests investors aren't just chasing momentum but are making longer-term allocations, viewing Bitcoin as a legitimate component of a diversified portfolio, independent of its correlation (or lack thereof) to other asset classes.
Price Action, Leverage, and the Path Ahead
The technical picture for Bitcoin has brightened considerably alongside these fundamental drivers. The recent surge saw Bitcoin break key bearish structures, establishing a higher low that many traders see as a potential launchpad for challenging previous all-time highs. The reclaiming of the $91,000 level was a significant psychological victory for bulls, reinforcing the positive sentiment fueled by the ETF flows. Market participants are now eyeing levels like the yearly open around $93,000 as the next major hurdle.
However, caution remains warranted. Analysts note that recent price surges have often been accompanied by significant leverage in the derivatives market. While leverage can amplify gains and accelerate upward moves, it also increases volatility and the risk of sharp liquidations if the market turns. The critical question is whether the consistent spot buying, particularly through ETFs, can absorb selling pressure and provide the underlying support needed to sustain these higher price levels. A rally built predominantly on leverage without corresponding spot demand is often viewed as less stable.
The comparison to gold's comeback potential amidst trade tensions is intriguing, but Bitcoin still needs to prove its resilience. While it has demonstrated periods of acting as a safe-haven asset, its correlation to risk assets like tech stocks can reappear, especially during broad market liquidity crises. The "decoupling" is not absolute, but rather a dominant trend driven by its unique value proposition gaining traction.
Conclusion: A Maturing Asset Forging Its Own Path
Bitcoin's recent performance, marked by significant ETF inflows and a price surge seemingly disconnected from traditional market anxieties like tariffs and earnings reports, lends strong support to the decoupling narrative. Its fundamental characteristics – scarcity, decentralization, and neutrality – are increasingly resonating in a complex global environment. The success of spot Bitcoin ETFs provides a regulated gateway for broader adoption and serves as tangible proof of growing institutional and retail demand, validating Bitcoin's role as an emerging reserve asset.
While challenges remain, including inherent volatility, regulatory uncertainties, and the need for spot demand to underpin leverage-driven moves, the trend is undeniable. Bitcoin is increasingly trading based on its own unique supply/demand dynamics and its perceived role in the future financial landscape, rather than simply mirroring the movements of traditional markets. It doesn't care about Q3 earnings or new import duties because its value proposition exists on a different plane. As capital continues to flow in via accessible vehicles like ETFs, recognizing its distinct properties, Bitcoin's journey towards becoming a truly independent, globally significant asset class continues, one block at a time.

BTC/USD WEIRD MARKET CONDITIONSThe price made a break but is showing signs of spikes which can mean there is slight ressistance coming from buyers and sellers overpowering.... it is at a funny and weird point where its a little hard to tell which way or where it will go but with patience and price action we can slowly start to see the story slowly... keep an eye on it and don't let FOMO ruin your trade. lets go!

Bitcoin Wave Analysis – 22 April 2025
- Bitcoin broke round resistance level 90000.00
- Likely to rise to resistance level 95000.00
Bitcoin cryptocurrency today broke the resistance area between the round resistance level 90000.00 and the 38.2% Fibonacci correction of the downward wave (A) from January.
The breakout of this resistance area should accelerate the C-wave of the active ABC correction (B) from March.
Bitcoin cryptocurrency can be expected to rise in the active C-wave to the next resistance level 95000.00 (former strong resistance from the start of March).

$BTC: We Are in a Bear Market Until Proven Otherwise🚨 CRYPTOCAP:BTC : We Are in a Bear Market Until Proven Otherwise 🚨
📌 Follow-up to my December 2024 post:
🔗
Despite record-breaking bullish news, Bitcoin is not at an all-time high. Why? Because we’re still in a bear market—until the charts say otherwise.
✅ Bullish Factors:
Michael Saylor continues buying billions
President Trump & family pushing crypto/meme coins
Rumors: Fed buying CRYPTOCAP:BTC with gold?
Trump pinned the Bitcoin white paper at the White House
U.S. banks fully onboard with crypto
ETFs accumulating CRYPTOCAP:BTC
National crypto reserve announced
❌ Bearish Signals:
Fear & Greed Index in "extreme fear" for 30+ days
Price is below the EMA50 on weekly
Monthly MACD nearing bearish crossover
Trading volume decreasing
Crypto search interest at multi-year lows
Retails not buying — this is all institutions
Powell confirmed we're in a recession
Desperate whales calling for $5M–$9M BTC to bait retail
🧭 Monthly chart check the MACD:
🔗
⚠️ Key Insight:
Every cycle, people confuse a relief rally for a new bull run. This isn't new.
A relief rally = short-term price recovery in a bear market.
(AKA a dead cat bounce or sucker rally)
📊 Past relief rallies (check the chart):
+45% (Feb 2022)
+32% (June 2022)
Current one: only +16% — still within bear territory.
📉 Price could hit $91k and still drop lower while staying in an ongoing bear Market..
🧨 Bear Market Target: GETTEX:25K – FWB:27K
📈 Invalidation? Only if we close above $101K
Don’t trade your emotions. Trade the charts. They never lie.
#Bitcoin #CryptoMarket #BTC #BearMarket #CryptoAnalysis #SPX500 #CryptoTrading #Recession2025 #BTCPrice #CryptoCrash #CryptoNews #MichaelSaylor #TrumpCrypto #BTCBearMarket


BTC: Bull Trap? Rally?Very interesting things are happening. From the 4-Hour chart to the 30-minute chart, although there are parallel patterns rising one after the other, none of them have worked yet. The price continues to rise despite the fact that Japan and Mexico have put the US on the brink regarding tariffs. We are experiencing one of the moments when classical technical analysis is helpless.
I say hold on tight when it starts to fall, the target may come up to 78,000. The Inverted Shoulder Head Shoulder on the daily is winking from the horizon, as if saying I don't recognize flag patterns.

Bitcoin Elliott Wave AnalysisHello friends
On the Bitcoin chart, we see the formation of a complete Elliott wave pattern. These waves from 1 to 3 or C are quite clear and we can even count its sub-waves.
Now a 3-wave ABC has formed. We cannot be exactly sure that this is a complete zigzag because wave C can be extended and the price will fall further.
But we consider it wave 4 assuming that this zigzag is completed.
So we will wait for the formation of an upward wave in the form of wave 5.
The target is first $86,500 and then $88,000.
Good luck and be profitable.

Taking some profits expect some resistance at 92500Looking good so far. Got through the cloud. Taking profits and wait to see if it gets to 92500 and what it does from there. Volume getting low.

UPDATE ON BTC ANALYSISBTC/USD 1D - Well as you can see price has played out exactly as we predicted yesterday providing us with an amazing push to the upside. I do however want to see price correct itself before the next push up.
I have gone ahead and marked out the order block I have in mind that I would like to see price come and clear before it continues in this hawkish way. I feel this could be a great area to get involved in those longs from.
As we know there are some great prospects for BTC so its important that we are always looking for key areas of interest for us to buy in from with this market being a bullish one.
I will keep you all posted on how this market places out over the coming days, but a big well done to anyone who may have taken advantage of the last post on this pair and profited!

Bitcoin - This Is Just Unbelievable!Bitcoin ( CRYPTO:BTCUSD ) is not dropping at all:
Click chart above to see the detailed analysis👆🏻
After we have been seeing one of the craziest weekly drops which I have experienced in my entire trading history, all major cryptos and especially Bitcoin are strongly holding their levels. Since bullish strength continues quite often, I do expect new all time highs on Bitcoin soon.
Levels to watch: $70.000, $300.000
Keep your long term vision,
Philip (BasicTrading)

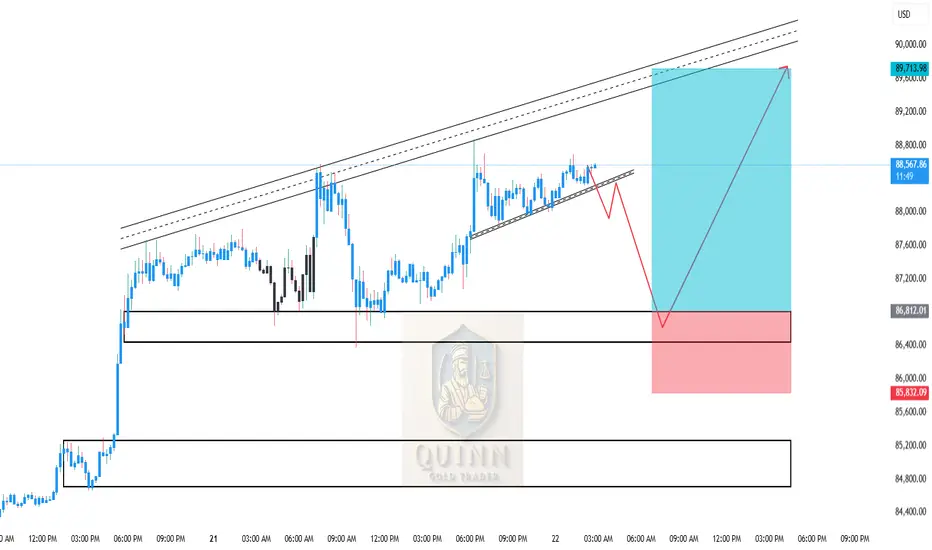
BTCUSD Intraday Move 22-04-2025📊 BTCUSD Analysis – April 22, 2025
Price action is currently forming a rising wedge, typically a bearish pattern, indicating that a short-term correction may occur before the next bullish impulse. The structure shows consolidation with weakening momentum, suggesting that a pullback to demand zones is likely.
We have two strong support zones identified:
Zone 1: 86,400 – 86,800 — minor support from recent consolidation.
Zone 2: 84,700 – 85,100 — major demand area aligned with previous breakout and price reaction.
A retracement into either of these zones offers high-probability buy opportunities for continuation toward the upper resistance trendline and prior high near 89,700.
📈 BTCUSD Buy Signal:
Buy Entry #1: 86,400 – 86,800
Buy Entry #2: 84,700 – 85,100
Take Profit: 89,700
Stop Loss:
For Entry 1: Below 86,200
For Entry 2: Below 84,500
Trade Idea: Wait for bullish price action (engulfing candle, pin bar, or volume spike) before entering.
#BTC Market Update – April 22, 2025Current Price: $90,700 (+4%)
📊 Technical Overview
• 200-Day MA: $88,356 – BTC is trading above it → Bullish sign
• RSI: 78 – Overbought zone → Possible pullback
• Resistance: $90,000 – Key psychological level
• Support: $85,000 – Watch this level on retracement
🔗 On-Chain Insight
• Long-Term Holders: Some distribution happening → Profit-taking
• Network Activity: Steady → Healthy usage
• Sentiment: Bullish → Weak USD + institutional inflows
🧭 Macro & Fundamentals
• U.S.–China tensions + Fed uncertainty → BTC seen as safe haven
• Institutions are increasing their exposure → Positive market signal
✅ Summary:
BTC shows strong bullish momentum, but RSI is overheated. Stay alert for potential short-term correction. Key levels: $85K support / $90K breakout.

BTC Elliott wave Analysis 23/4/2025I think we have close to the End of the big B wave that is the part of the the wave 4 (Start from Nov 2022 crash).We Should see a clear Divergence soon in big time frame like 2 , 4 Hours to confirm that the pivot has come.For me I think the target price that is the pivot point is around 96000-97000 since bearish shark pattern harmonic and Gann fan suggest us.

Bitcoin: The Grand Ascension Blueprint - Ready for Lift-Off!
The Most Important Bitcoin Chart You'll See This Year.. As we said before in pervious idea for enrty in 74,500
and that what happen in one month
Looking at this daily BTC/USD chart, we're witnessing the formation of a powerful technical setup that could define the rest of 2025. This isn't just another prediction—it's a strategic roadmap based on key technical levels that smart money is watching.
📊 What The Chart Is Revealing:
🔷 Perfect Channel Formation
* Bitcoin has established a massive ascending channel (gray boundaries) with textbook precision
* Current price ($77,626) testing the critical lower boundary support
* Previous touch points have all resulted in significant bounces
🔷 Triple Target Trajectory
* TP1: $82,400 - Initial relief target (conservative)
* TP2: $85,700 - Mid-channel equilibrium zone
* TP3: $89,100 - Upper resistance test before potential breakout
🔷 Historical Context Matters
* We're constructively holding above the December 2023 breakout level
* Current consolidation mirrors the pre-pump phase from late 2023
* Blue trendline break served as the first warning of trend change
Why This Pattern Has MASSIVE Implications
⚡ The Timing Effect:
The current position at channel support presents a rare low-risk, high-reward opportunity with clear invalidation points. The pattern suggests accumulation before a potential explosive move toward $130,000 by August-September.
⚡ Macro Alignment:
This technical setup coincides perfectly with post-halving supply dynamics and institutional capital flow patterns. The projected move higher follows the historical post-halving performance cycles.
⚡ Risk Management Precision:
* Invalidation point: Clear break below $74,000 with volume
* Ideal entry zone: $74,800-$75,500
* Risk:reward ratio at current levels: approximately 1:5
he Hidden Message Most Traders Are Missing
This isn't just about price targets—this formation suggests Bitcoin is preparing for its largest percentage gain phase of this cycle. The projected path (purple forecast line) indicates a potential 68% move from current levels in just 90-120 days.
Institutional positioning data supports this view. The methodical stair-stepping pattern in the forecast line suggests strategic accumulation phases between aggressive price advancement.
📊 SEE YOU AFTER 3-4 MONTHS .. FOLLOW ME FOR MORE DETAILS 📊

How One Candle Can Flip Market Sentiment | Watch These Key ZonesMarkets are emotional. One candle — that's all it takes to turn fear into greed, or hope into panic.
Over the past few weeks, traders have been caught in headlines — tariffs, global uncertainty, and endless speculation. But if you zoom out and look at the chart objectively, the structure is telling its own story.
🧠 Key Insight:
In every cycle, when fear dominates the market, it often marks the bottom.
When euphoria takes over, it’s usually the top.
This pattern repeats. The players change — the psychology doesn’t.
📌 Here’s what I’m watching on this chart:
Support zone:
Resistance to break:
Market sentiment: Currently bearish, but structure suggests potential reversal if .
📊 Always remember:
The market rewards those who focus on price action and structure, not the noise.
Let’s see how this plays out. I’ll keep updating this idea as the move develops.
Drop your thoughts below & let’s keep the analysis sharp and clear ⚔️

BUY Z DIP ON BTCWe're seeing a clear divergence on Bitcoin's chart, signaling a potential reversal at a strong support level. As the famous quote goes, "Buy when there's blood on the streets." Now is the time to take advantage of this dip, as these are the moments where the best opportunities arise. Don't miss out—this could be the entry you've been waiting for! 📉📈
#Bitcoin #BuyTheDip #CryptoOpportunity #Divergence #BTC
