$BTC Is Bullish Again — Momentum Building?Bitcoin ( BITSTAMP:BTCUSD ) is back with bullish momentum — and the charts are starting to show real strength.
🟢 Key bullish signals:
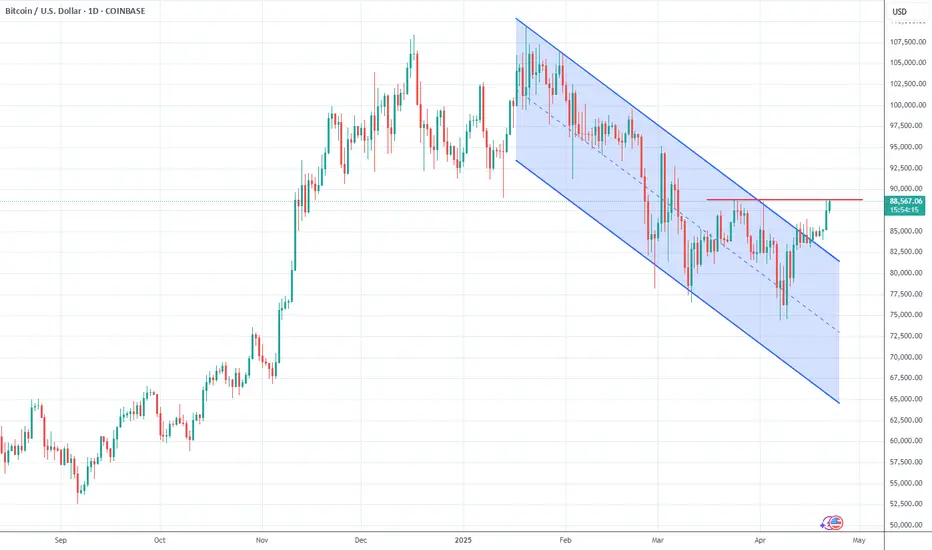
• Breakout above recent bearish channel resistance on daily chart
• Strong volume confirmation
🧠 Sentiment is shifting — fear is cooling off slighthly, and traders are eyeing higher targets.
📍 What I'm watching next:
• FWB:88K level is double top pattern neckline. Or there is a possibility that the price would bounce from the level and make another try to break it while forming head and shoulder pattern. We will see. But either way the level acts as neckline and the break would confirm a bullish move.
But let’s not forget: CPI data & macro events can still shake the market short term. Stay sharp.
Are you riding the wave or waiting for a retest?
Let me know your game plan below 👇
BULLUSD trade ideas
BTC next resistance at 94200Hope to see BTC to reach at his next resistance 94200 as no major blocks in between.

Bitcoin hits $90K for first time since MarchBitcoin has climbed above the $90K level for the first time since early March. Is this an indication of risk appetite improving, or are investors buying Bitcoin for the same reason they are buying gold? In any case, as traders, we care about the HOWs and WHEREs more than the WHYs.
With that in mind, it is worth keeping an eye on the next areas of potential support and resistance to see whether Bitcoin will break them.
Initial resistance comes in the area between $90,000 to $91,900. In this range, you have prior support meeting the 50% retracement level of the downswing from the January high. Above this, the 61.8% Fibonacci level is at $96K.
Support levels to watch now include the $88,500-$88,800 area, which was resistance previously and where the 200-day average comes into play. Below that, you have the point of origin of this week's breakout near $85,000.
By Fawad Razaqzada, market analyst with FOREX.com

Bitcoin & the Resistance...who will win?Its early 2025 any Bitcoins hashrate is hovering around 1000 EH/S! The computational power is becoming staggering. Has anyone considered the sci-fi world we currently live in and how that might affect BTC in the future? I like the version of the new matrix where a truly decentralized, pro human AI program is released on the bitcoin network to grow...lol
The future and perps markets determine bitcoins price now. There are fewer coins in circulation so everything is leveraged. Be mindful of massive head fakes but like the $96200.00 area for resistance. Might be a nice area to short for a 5x leveraged scalp...
Not financial advice and crypto has unique risks that usually end of you losing funds. Have fun and learn.

BTCUSD next move(expecting a bullish move)(22-04-2025)Go through the analysis carefully, and do trade accordingly.
Anup 'BIAS for BTCUSD (22-04-2025) (MID TERM)
Current price- 90000
"if Price stay above 83,000 then next target is 93,000, 99,000 and 1,10,000 below that 79,000.
-POSSIBILITY-1
Wait (as geopolitical situation are worsening )
-POSSIBILITY-2
Wait (as geopolitical situation are worsening)
Best of luck
Never risk 2% of principal to follow any position.
Support us by liking and sharing the post.

Just BitcoinBitcoin
Bitcoin is a decentralized digital currency created in 2009 by an anonymous person or group using the pseudonym Satoshi Nakamoto. It was the first successful cryptocurrency and remains the largest by market capitalization.
Key aspects of Bitcoin include:
Decentralization: It operates without a central authority like a bank or government
Blockchain technology: Transactions are recorded on a public ledger
Limited supply: Only 21 million bitcoins will ever exist, with the last expected to be mined around 2140
Mining: New bitcoins are created through a computational process that also validates transactions
Pseudonymity: Users can transact without revealing their identity, though all transactions are publicly visible
Bitcoin has experienced significant price volatility throughout its history, with several major bull and bear market cycles. It's primarily used as a store of value (sometimes called "digital gold"), for speculative investment, and increasingly as a payment method.
Many see Bitcoin as an inflation hedge or alternative to traditional financial systems, while critics point to concerns about energy consumption, potential use in illegal activities, and regulatory uncertainty.

BTC Full Cloud Reclaim Ichimoku Script Buy alert1. Technicals: BTC & MSTR both flashing buy signals on Ichimoku
Bitcoin (USD, daily) has just closed back above both its Tenkan‑sen/Kijun‑sen (blue/orange) and broken the downward yellow trend‑line, with price now sitting on the top edge of the cloud. That close‑above is exactly the condition you want to wait for to avoid mid‑bar whipsaws.
MicroStrategy (MSTR, daily) also closed back above its cloud, giving you a clean “BUY” arrow.
In both cases the CM_Ult_Macd has crossed back above zero and RSI sits in neutral‑to‑bullish territory.
All together that’s a pretty classic Ichimoku “trend turn” signal on the daily.
2. What the liquidation maps tell us
On the Coinglass Hyperliquidation Map, there’s a huge wall of long‑liquidation clusters sitting just below $90 000. If BTC grinds through $90 k, you can trigger a cascade of short‑squeeze buying as those long positions liquidate.
The heatmap confirms heavy leveraged interest between $88 000–$91 000. That zone could act as both resistance (big stop‑runs) or fuel a squeeze if stops get blasted.
3. Putting it together
Bullish bias now that both symbols have daily close‑above signals.
Caution around $89–90 k on BTC: big liquidity clusters live there.
A clear break and close above $90 k could flush those clusters and carry price higher.

BTCUSD: eyes now set on 105KBTCUSD has broken above 89K, confirming the reversal pattern; momentum builds toward the 105K target.

BTCUSD - POSSIBLE LONG SETUPBTC has created a Head and Shoulders pattern.
Neckline has been broken.
Now waiting for the retest, so we will have a break and retest + head and shoulders.
After that i'm going to wait for a bullish shift of structure on the 15/30min timeframe and look to enter the trade.
It also all depends on how this daily candle will close.

BTCUSD 15mint Forecast Hello guys I hope you are well let me tell you that we can buy now and our target will be $89200.

Daily Price Action BITCOIN BTC Tuesday 4/22/2025In this video, we will be looking into the potential price action of BTCUSD.

BTCUSD Weekly Analysis Targeting; 94k - 96k, Followed By 109k
BTCUSD Weekly Analysis
Bitcoin is currently trading around $88,638, showing strong recovery momentum after bouncing off the key 61.8% Fibonacci retracement level at $74,412, often referred to as the “golden pocket.” This bounce suggests that buyers are stepping in aggressively at this support zone, which has historically acted as a major turning point in bullish market structures.
On the upside, BTC has now reclaimed the 38.2% retracement level at $87,375, turning it into a short-term support zone. Holding above this level gives Bitcoin a clear path toward the next key resistance at $94,430, followed by a stronger resistance cluster around $96,211, where both Fibonacci and historical horizontal resistance align.
Technically, the weekly chart also confirms a breakout above the descending trendline, adding confluence to the bullish reversal. This move aligns with the Inverse Head & Shoulders pattern seen on the daily chart — a classic bullish formation that typically leads to strong upward continuation.
If BTC continues to hold above $87,000, the next short-term target would be $94,000–$96,000, and if that level breaks with volume, Bitcoin could be gearing up for a retest of its previous highs around $109,000. On the downside, $81,145 (50% retracement) and $74,412 (61.8%) remain critical support levels, with any break below $74K shifting the outlook back to bearish.
The chart structure, key Fibonacci zones, and bullish reversal pattern all point toward continued upside, with BTC needing to maintain above GETTEX:87K to sustain the bullish trend.

Bitcoin Tests Critical Resistance Level: What's Next?FenzoFx—Bitcoin is testing the $88,650 resistance, a level it has rejected more than three times. The Stochastic and RSI 14 indicators remain in overbought territory, indicating short-term overvaluation. Entering the market at this price is not recommended.
If BTC/USD stays below $88,650, a consolidation phase may follow, with potential dips to $88,140 and $82,810.
Bullish Scenario
The bearish outlook is invalidated if BTC closes above $88,650, potentially resuming the uptrend toward $90,000.

BTC KNOCKING ON HEAVEN'S DOORBitcoin is really knocking on the door of major resistance here, testing the key level at $88,804 for the second day in a row. What makes this even more notable is the backdrop – equities have been under pressure, yet Bitcoin is showing strong divergence and relative strength.
We saw a breakout through descending resistance yesterday, backed by a meaningful increase in volume – a solid signal that buyers are stepping up. Price is comfortably holding above the 50-day moving average, and the 200-day MA is now flattening out just below resistance, giving bulls a potential momentum shift.
A daily close above $88,804 would break the bearish market structure with a higher high and open the door to a more extended move. For now, this is an encouraging chart.

Bitcoin Tests March HighsBTC tests March highs after 2 weeks of bullish price action and a double bottom / reversal pattern on Apr 9.
Currently testing significant price levels around FWB:88K and 1D 200MA, a decisive break above could signal a push towards $92k.
Failing to reclaim FWB:88K - GETTEX:89K could lead to a retest of $85k - $86k before attempting to reclaim previous R as S.

BTCUSD | 1H | IMPORTANT LEVELSHey There;
I’ve prepared a fresh Bitcoin analysis just for you.📈
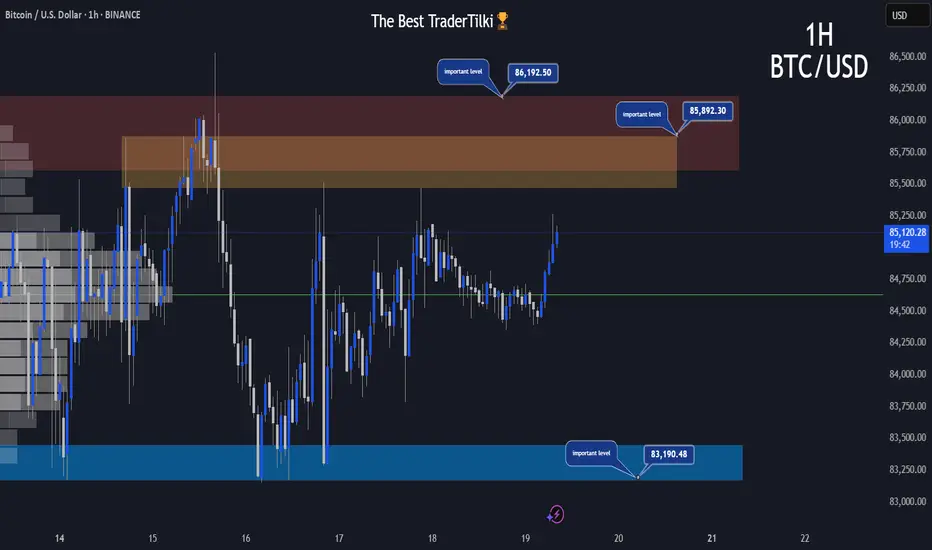
Key resistance levels for Bitcoin are 85,892.00 and 86,192.00, while the support level stands at 83,190.00.⚠️
If Bitcoin breaks above the 86,192.00 level, the next target could be around 88,860.00.📣
I truly care about you all, and keeping you informed is something I see as my responsibility.🥰
Wishing you an amazing day ahead!💙
BTC vs Nikkei 225 strong match for declineI've been using the Nikkei 225 for at least 2 years to make forecasts as the big players have been involved in the Japanese Carry Trade.
Gains in the Japanese Nikkei 225 equity market have carried onto Bitcoin BTC.
Now I am afraid BTC could collapse from 120k and above to well under 50k. Not just for a short duration but permanently. It will begin with a volatile ABC, but could commence into a deep wave 3 down, where waves before the ABC is wave 1.
You should be considering selling all your Bitcoin BTC and Crypto.
There will be no come back from this.
I'd advise followers to make use of the following SHORT methods.
1. Use Short ETF's were you cannot be scam wicked.
2. Only use European Style Put Options on short durations e.g Derebit.
3. MSTR Option Shorts and Short ETFs will be a good way to capitalize on this volatility.
Be aware that the majority of exchanges are going to go bust from this event.
It would be advisable to solely trade on a ON RAMP exchange or with a reputable Stock Broker that has insurance or Gov payback schemes on your fiat.

Bitcoin price increaseAfter the tensions between traders in the United States and the strong price fluctuations in the dollar and other stocks, and after the 3-month increase in gold, this time it will be the turn of digital currencies to increase again and there are signs of their increase in the market. For Bitcoin, two increase targets can be considered: $110,000 - $120,000.
Sasha Charkhchian

BTC/USD: Hero's Quest to the Boss Treasure BTC/USD: Hero's Quest to the Boss Treasure
Price Action Deep Dive:
BTC/USD has formed a powerful SPAWN POINT breakout on the 4H timeframe, characterized by three consecutive blue candles with minimal wicks, indicating strong buyer control
Prior to the breakout, we observed a period of tight consolidation (level 15-20 grinding phase) where price was building energy for the current upward thrust
The breakout volume significantly exceeds previous candle volumes, confirming legitimate player interest in this upward move
Recent price structure shows higher lows and higher highs, establishing a clear uptrend path toward our target zones
Current candle formation suggests momentum continuation rather than exhaustion, with minimal upper wicks indicating buyers absorbing all selling pressure
Market Structure Context:
The breakout has successfully cleared the previous resistance zone (ELITE LvL 2 HP: 2), transforming it into support for future pullbacks
The Treasure Hunter color shift preceded this move, acting as an early warning signal for observant traders
Major support trendline from previous lows remains intact, providing a "regeneration shield" for any temporary retreats
Each pullback has been increasingly shallow, demonstrating growing reluctance from sellers to engage the hero's advance
The most recent consolidation formed a bull flag pattern before the continuation, classic "power-up charging" price action
With our Hero at Level 159 with full health and the Wizard's Journey already 53% complete, all technical indicators align for continued progress toward BOSS TREASURE around $94,000-$95,000, though we should remain vigilant for temporary pullbacks to the HEALTH POTION zone around $84,000.

Are You Backtesting or Backfilling Your Ego?You build the setup.
You run the test.
It’s not quite what you hoped for…
So you tweak it. Then tweak it again. Then again. And again.
Before you know it, you’re not testing a strategy anymore
you’re editing reality until it flatters you.
That’s not refinement.
That’s backfilling your ego.
The urge to make it look right
We’re human.
Nobody likes drawdowns.
Inconsistency feels uncomfortable.
And let’s be real.. win-rates under 50% just look bad.
We don’t want to see our promising idea fall apart in the data.
So instead of facing it, we start sculpting the results to make them easier to accept.
We don’t want to see our promising idea fall apart in the data.
So instead of facing it, we start sculpting the results to make them easier to accept.
Widen the stop just a little.
Tighten the take-profit, Perfect! Now my win-rate is 60%
Add a filter that “feels logical.”
Nudge the indicator setting.
Remove the choppy day, “that was news anyway.”
And just like that, the curve is smoother.
The stats are cleaner.
You feel better.
But here’s the problem:
You’re not building a strategy that works.
You’re building a strategy that looks like it works.
Optimization isn’t the enemy, but your intentions might be
Of course, tuning is part of the process.
You should test different inputs and variables.
But stop and ask yourself: why are you doing it?
If you're refining to understand the behavior of your system, that’s good.
If you're changing things to avoid discomfort? That’s not testing. That’s denial.
The market doesn’t care how hard you worked.
It doesn’t reward effort. It rewards resilience.
If your strategy only performs when everything’s perfectly aligned
when the moving average is exactly 13.53661,
and the RSI is 42.122 instead of 40,
and your entry is two bars after a wick touch…
Then you don’t have a strategy.
You have a sandcastle.
And when the tide shifts, it’s gone.
All because you wanted it to work so badly, you sculpted the data until it told you what you wanted to hear.
A strategy worth trading doesn’t just survive the good times
Anyone can build a system that performs in a trending market.
Or when volatility is ideal.
Or when the dataset ends right before the storm hits.
But markets don’t hand out clean conditions on demand.
So ask yourself:
Have you tested your strategy in stress conditions?
Have you run it through market noise, sideways action, volatility spikes, and traps?
Have you studied its worst stretch and still said, “Yes… I’d take these trades”?
Because if the answer is no, your system isn’t ready.
You’re not building a strategy to trade.
You’re building one to feel safe.. and that’s far more dangerous.
Break it before the market does
The best traders do the opposite of comfort:
They try to break their systems before live money does it for them.
Run a Monte Carlo simulation.
Shuffle the order of trades.
Randomize outcomes.
Apply slippage or missed entries.
If your equity curve collapses under that pressure, if your belief in the system evaporates when the trades aren’t perfectly sequenced, then you didn’t build robustness.
You built a lucky curve.
Loss streaks aren’t a bug, they’re the cost of playing
Too many traders design systems that avoid losing…
instead of building ones that know how to lose..
Every real edge has pain points.
Every equity curve has drawdowns.
Every stretch of performance has some ugly days.
If your backtest doesn’t show that? Be suspicious, because the market will definitely do.
So stop trying to eliminate every loss, and start asking better questions:
Where does this strategy actually break?
What’s the worst losing streak I can expect?
Can I survive that financially and emotionally?
bottom line:
It’s truth over comfort.
Clarity over illusion.
Edge over ego.
Test it honestly, or the market will ..

April 17 Bitcoin Bybit chart analysisHello
It's a Bitcoinguide.
If you have a "follower"
You can receive comment notifications on real-time travel routes and major sections.
If my analysis is helpful,
Please would like one booster button at the bottom.
This is the Bitcoin 30-minute chart.
Nasdaq indicators will be announced at 9:30 in a little while.
The purple finger section on the left
is connected to the short->long switching section that was performed on the 16th.
* When the blue finger moves,
Bidirectional neutral
Short->long switching strategy or long waiting if it goes down right away.
1. 85,728.6 dollars short position switching / cut-off price when orange resistance line is broken
2. 84,595.8 dollars long position switching / cut-off price when green support line is broken
3. 86,871.5 dollars long position 1st target -> Good 2nd target
Today's 12-hour chart MACD dead cross is an ignoring strategy. Check if the purple support line deviates from the current position,
and from the 1st section of the green support line deviates,
even those who have been holding long positions since yesterday can operate at the same stop loss price.
If the short position entry section at the top comes down without touching,
the 2nd section at the bottom is the final long waiting section (6+12 pattern),
and if the rebound is not good in this section and it is pushed,
it may continue to fall to the 3rd section at the bottom due to the pressure of the 12-hour chart MACD dead cross.
Up to this point, please use my analysis article only for reference and use,
and I hope you operate safely with the principle trading and stop loss price.
Thank you.

BITCOIN - Bullish Double BottomHello Traders !
The BTC price formed a double bottom pattern.
Currently, The neckline is broken !
So, I expect a bullish move🚀
______________
TARGET: 88700🎯

Bitcoin could surprise with new ATHs- one of the more tricky analysis since technically BTC could be in a HTF downtrend so looking for very high upside targets is not the best idea
- that said, there are some interesting developments here:
1. PA has broken the very clear downtrend line
2. S/R flip just recently confirmed on the 4H time-frame suggests the bull strength is real
3. perhaps most importantly, Bitcoin has traded differently to US equities for the last couple of days with SPX heading sharply lower but Bitcoin not really following and even rallying (something unheard of until this year!)
It is too early to tell whether this is a new dynamic between the two and certainly far too early to say that Bitcoin has become a risk-off/alternative asset but with Trump fundamentally changing the flow of goods, services and most importantly capital it may be time to discard all the old, known asset correlations aside.
High conviction that Bitcoin heads to at least the 92k - 94k region. Possibility of a surprise run towards previous and perhaps even new ATHs is present and would be confirmed if Bitcoin starts holding the 95 - 96k level.
Ultimately, it is rather likely that the upcoming move is fake/nothing but a bear rally and lower prices are expected or at the very least it is unlikely upside PA for Bitcoin gets sustained in the long term UNTIL
.. as long as Solana is not trading below 80$, chances are we are still in a bear(ish) market.
