THOUGHTS ON BTC/USDBTC/USD 1D - As you can see price has traded us down and into a level of Demand and has shown some signs of potentially reversing back to the upside. In order for us to have confirmation of this we need to see a relevant break in structure.
I have gone ahead and marked out the last protected high on the 1H timeframes within this bearish corrective wave, once we see a break in that we have the confluence we need.
As we all know a break in the last high would confirm to us that the bearish structure we are seeing at the moment within this corrective wave has finished an a new trend to the upside is ready to take place.
It confirms that enough Demand has been introduced into the market to flip the S&D balance. Giving us enough confirmation to look to take this market long once again, as we know there are big prospects for BTC and the prevailing trend backs that.
BULLUSD trade ideas

BTC/USD - The Bitcoin Cycle TopBTC has recently broken below a key uptrend line that had been guiding price for some time. I’m watching for a potential backtest of that broken trendline, a rather classic move that could set the stage for a final upwards squeeze, possibly printing a quick higher high to trap late longs.
I’m watching the circled area closely as a potential exhaustion zone. Key levels and price action around the trendline will be critical, breaking of upwards trendlines after backtesting may mark the beginning of the larger unwind.
We could see multiple backtests of the broken trendline over time, with the trendline now likely acting as resistance.
Note: I’m publishing this idea simply to have a timestamped record. This post is my way of putting a clear marker in the sand. I’m not looking to debate or go deeper into the reasoning, and I generally won’t be responding to comments.

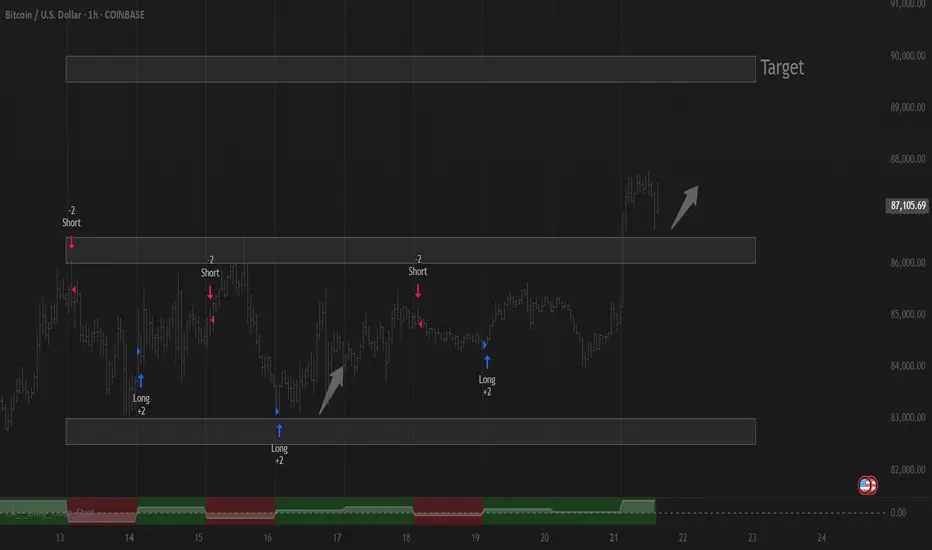
BTCUSD 30M CHART PATTERNThis chart shows a BTC/USD (Bitcoin to US Dollar) trading setup on the 30-minute timeframe. Here's a breakdown of what it's indicating:
1. Pattern Formation: A potential bullish flag or ascending triangle setup is forming after a strong upward move, suggesting continuation.
2. Entry Point: The chart suggests a breakout above the consolidation zone (the horizontal blue line) as a possible buy signal.
3. Take Profit Targets:
First Take Profit: Just above the breakout zone.
Second Take Profit: At a projected target based on the previous bullish move (the "flagpole" height).
4. Stop Loss: Placed below the support zone (highlighted in red), protecting the trade if price breaks down instead.
5. Current Price: Around $87,106, just below the breakout level.
This is a classic risk/reward setup traders use for continuation plays. Do you want help calculating the exact entry, stop loss, and target levels based on this chart?

Trading balanceTrading balance The price of the asset has rebounded from the balance zone. With the prospect of growth into the resistance zone.
BTC RESISTANCESMight have some reaction when the levels got hit. Let's see and review it in the future.
based on just price level and price reactions

BTCUSD Rising Wedge Breakdown – Short Opportunity Underway!Price rejecting near $87.8 resistance zone
Bearish wedge forming below rising trendline
Breakdown confirmation opens short trade setup
First target near $85,822 key level

BTC/USD..Bitcoin 1day chart pattern✨ ETHUSD Trade Setup
Technical Analysis: Ethereum (ETH) has broken out of the descending channel, signaling a potential trend reversal. The MACD is showing bullish momentum, supporting a Buy signal.
Entry: 1,600
Targets:
Target 1: 2,100
Target 2: 2,800
Stop Loss: 1,399
Bias: Bullish
Confirmation: Channel breakout + MACD bullish crossover
---
Let me know if you want a chart image, a version for social media, or to track this trade over time.

uptrendGiven the completion of the corrective pattern and the breakdown of the resistance trend line, we are expected to witness the beginning of the upward trend.

BTC/USD Rallies Above $82,140FenzoFx—Bitcoin has surged past $82,140 resistance and is now trading near $86,800, correcting 1.0% of its recent gains.
The bullish trend persists above the 50-period simple moving average, with immediate support at $86,140 offering a potential entry point for buyers. If this level holds, the uptrend could target $89,000.
Conversely, a dip below $86,140 might push prices toward $84,000 or $82,811.
>>> No Deposit Bonus
>>> %100 Deposit Bonus
>>> Forex Analysis Contest
All at FenzoFx Decentralized Forex Broker

BTC BREAKING OUT!Bitcoin just printed a textbook breakout on the daily chart – pushing cleanly through descending resistance from the all-time high. The move came on increasing volume, which adds credibility to the breakout and shows buyers are finally stepping in with conviction. We need to see it hold and close the day like this for confirmation.
Price is now well above the 50-day moving average, which is curling upward, offering short-term support. This is the healthiest the chart has looked in weeks.
That said, we’re not out of the woods yet. The 200-day moving average is still looming just above, along with the key horizontal level at $88,804. A close above that level would break market structure and confirm a higher high – a bullish shift worth watching.
For now, momentum is clearly with the bulls, but the next 24–48 hours will be critical to see if they can seal the deal.

BTC is crossing 87000 crucial levelIf BTC will close above 87000 today, it is high chance to cross 91000 mark.
Note: This is not a buy sell call, trade at your own will, use stop loss.

Bitcoin: slowing downAs markets continue to be highly concerned regarding trade tariffs imposed by the US Administration to the rest of the world, supporting the price of gold, the BTC continues to be somehow left behind the attention of investors. Considering high volatility on other financial markets, and general negative market sentiment, this might actually be good news for BTC.
The price of BTC was moving in a relatively short range during the previous week, between levels of $86K, down to $83,5. However, the majority of deals were around $85K. This is the level currently tested for its potential to the upside. In line with BTC movements, the RSI also remained flat, moving around the level of 52. Moving averages of 50 and 200 days are confirming the cross made two weeks ago, with MA 50 currently diverging from MA 200.
As previously noted, BTC is currently testing the $85K resistance line, for its potential toward the upside. It also should be considered that Friday and Monday are not working days on Western markets due to Easter holiday. In this sense, modest moves could be expected at the start of the week ahead. In case that the $85K is not breached, then the market will modestly revert toward the downside. In this sense, the level of $ 82K could be shortly tested, but the support level currently stands at $80K.

BTC, THE ONLY ONE THAT WORTH LONGING !Introduction
Crypto Didn’t Make It — Just Admit It
Long positions in crypto are usually pointless and super risky, because crypto simply didn’t make it .
Think of it like the dot-com era—when every company with a website was booming… until they all turned to dust .So there won’t be another altseason.
Crypto had its own version of that in 2021 . Unfortunately, it didn’t deliver anything meaningful to the world. Just sh!tcoin after sh!tcoin.
And let’s be clear: I’m talking about everything except Bitcoin .
The rest? Still pointless. Still super risky. At least until blockchain tech becomes much faster , more advanced, and actually gets used in real, profitable projects that benefit stakeholders — not just hype and tokenomics.
Who am I to say that? Just a trader since 2017 and a blockchain developer (not your average “Web3 dev” who just learned how to deploy a token).
BTC looks primed for a long.
Weekly EMA 55 (orange line) is the key — price above it = bullish, below = bearish. Simple as that.
Right now, BTC is holding strong above it and looks ready to move.
(And yeah, crypto doesn’t care about world news — remember that.)
Entry: ~76,500
Stop Loss: 69,217
Targets:
TP1: 87,196
TP2: 93,985
TP3: 101,900
TP4: 115,534

longa probable long although expecting price to reach 90,000 on btc . there has been an impulsive move so far on btc while it is currently ranging. we are expecting a more move to the upside.

U scared, I'm eyeing $100k by May.What beautiful price action.
We are going higher.
disagree if you want.
But you should probably hedge that viewpoint, with a bullish bet.
BALLA JI!
WE WILL WIN.

Bitcoin - Is Bitcoin on the way up?!Bitcoin is above the EMA50 and EMA200 on the four-hour timeframe and has broken out of its descending channel. The continuation of Bitcoin’s upward trend will depend on maintaining the drawn upward trend line.
A valid break of this trend line will cause Bitcoin’s price to correct to the 80,000 range. It should be noted that there is a possibility of heavy fluctuations and shadows due to the movement of whales in the market and compliance with capital management in the cryptocurrency market will be more important. If the downward trend continues, we can buy within the demand range.
Following the announcement of new trade tariffs by the United States, Bitcoin experienced a 16.7% drop in price. However, it partially recovered from its 26.7% plunge. The total global cryptocurrency market capitalization has now reached $2.74 trillion, marking a 1.71% increase compared to the previous day.
Over the past 24 hours, the total crypto market trading volume hit $60.7 billion, reflecting a 32.28% rise. Within this, DeFi transactions account for $5.25 billion, making up 8.65% of the total 24-hour market volume. Meanwhile, stablecoins have dominated trading activity with $55.84 billion in volume, representing 92% of the total market volume for the day.
When comparing Bitcoin’s performance to other major assets, gold leads with a 12.9% gain. In contrast, both silver and the U.S. Dollar Index saw a 4.8% decline. The S&P 500 fell by 13.8%, while the Nasdaq dropped 17.5%. Despite its volatility, Bitcoin sits between oil and the Nasdaq in performance, showing signs of partial recovery. However, its behavior still diverges from that of traditional safe-haven assets like gold.
On the political front, Hong Joon-pyo, a presidential candidate from South Korea’s conservative party, pledged that if elected, he would implement reforms in blockchain and cryptocurrency regulations. He also promised to integrate blockchain technology into public sector and administrative services. Additionally, Hong plans to invest at least 50 trillion Korean won (approximately $35.1 billion) over the next five years in research and development across artificial intelligence, quantum technology, and room-temperature superconductors. These initiatives are part of his broader strategy focused on growth driven by emerging technologies.
In Q1 2025, publicly traded companies collectively acquired 95,431 bitcoins, bringing their total holdings to 688,000 BTC. This amount represents 3.28% of Bitcoin’s fixed supply of 21 million coins.
The Coinbase Premium Index, which tracks the difference in Bitcoin demand between U.S. markets and global exchanges, has shown reduced volatility since March 2024. It appears to be forming a pattern often seen before bullish market trends.
Robert Kiyosaki, renowned entrepreneur and author of the best-selling book Rich Dad Poor Dad, has forecasted that Bitcoin’s price could rise to between $180,000 and $200,000 by the end of 2025. Kiyosaki has long been an outspoken supporter of Bitcoin, portraying it as a safe hedge against inflation and economic instability.

BITCOIN Most POWERFUL Signal Activated—Former ATH IS NOW SUPPORTBitcoin (BTCUSD) completed two straight green 1W candles and has started off this week equally impressive, approaching 4-week Highs! This is a direct consequence of the 1W MA50 (blue trend-line) holding as a Support, similar to what happened on the last two Higher Lows of the 3-year Channel Up on August 05 2024 and September 11 2023.
The hidden catalyst perhaps behind this strong move may be the fact that the April 07 2025 Low, besides the 1W MA50, it also rebounded on the former All Time High (ATH) Resistance Zone (red), which now turned into Support (green). This is the Zone that started with the November 08 2021 Cycle High and rejected BT on March 11 2024, April 08 2024, June 03 2024 and July 29 2024.
As long as this critical Support cluster (1W MA50, 2021 ATH Zone) holds, we are expecting the 1W MACD to form a new Bullish Cross, the first since October 14 2024, which technically confirmed the new Bullish Leg of the 3-year Channel Up.
In fact all previous 3 Bullish Legs got confirmed by a 1W MACD Bullish Leg and the minimum the rose by was +105.30%. As a result, after the Bullish Cross is confirmed, we will be expecting to see at least $150000 on this current bull run.
But what do you think? Can this hugely important Support cluster lead Bitcoin to $150k? Feel free to let us know in the comments section below!
-------------------------------------------------------------------------------
** Please LIKE 👍, FOLLOW ✅, SHARE 🙌 and COMMENT ✍ if you enjoy this idea! Also share your ideas and charts in the comments section below! This is best way to keep it relevant, support us, keep the content here free and allow the idea to reach as many people as possible. **
-------------------------------------------------------------------------------
💸💸💸💸💸💸
👇 👇 👇 👇 👇 👇

btc wOpen . bullish and not finished . watch and preparethe weekend was finished with a pump through all resistance zones. all SL accumulated, done with.
so now, bullish wOpen. too high to LONG,
a return to wOpen - sweep low - during a nice session timing, that be great.
otherwise, wait for the progress of upside and prepare to find the short entry.

88.5KHappy Easter,
So, our bullish trade is started well. But for now we wouldn't consider too extended targets. Based on AB=CD that we have on 4H chart , next extension is around 93K.
But here is a tricky moment exists and it relates to the H&S shape and strong 87-89K daily resistance. The point is that the right arm is yet to be formed, and it could be started right around 88.5K 1H chart targets.
That's why we're focused on just near standing targets. If Somehow, BTC will jump above 90K, then, the different scenario could appear. But for now we think it would be better to not take more risk and try to extract as much as good result from current positive position.

BTCDISCLAMER !!!
BTC is breakout trendline bearish short-term
Target 1 is in the green box, for the long term you can hold on

Bitcoin $200k in June 2025Despite the fact that US stocks look bleak, there is no better time for growth than the spring-summer of 2025. By the end of the year, the statistics will start to come out quite sad, and if you do All Time High, then only now. I am waiting for positive news
I estimate the probability of such a scenario at 65%

bitcoin short sellSignificant key levels reactions
#trends
#analysis
#forex
use proper risk management

BTC go long only after approx 90800 resitance breaks and retraceBTC go long only after approx 90800 resitance breaks and retrace. 3 resistance is standing to welcome Bulls.
