Bitcoin is going higherThrough my analysis I have seen that Bitcoin is gonna move a little higher until Monday on New York station we know that the market will make a new high from the last week though
BULLUSD trade ideas

Bitcoin may see $67k - Monthly timeframeHere is the monthly chart of the bitcoin. Based on price action analysis, we have a broad bull channel. We can see 2 price action signs here:
1- Second leg in the bull channel, we call it second leg trap
2- A climactic move to the top of the channel (biggest bull bar late in the trend)
Given the context, there is 60% chance that we see the bottom of the climactic move, which is $67,000.
The pessimistic perspective is that the bitcoin may see and test the bottom of the channel, around $50k.


A Bear Cycle has been started. BTC is now entering in it's bearish cycle. So avoid buying and start shorting/selling it.

BTCUSD - Technical Structure Shows Bullish Continuation AheadBitcoin is currently showing signs of strength as it consolidates around the $85,000 level, with technical evidence suggesting a higher probability move to the upside. The chart depicts a recovery from the recent support zone (highlighted in blue) around $76,000-$77,000, with price action forming a series of higher lows since early April. While some short-term volatility may persist, the overall structure appears bullish as BTC continues to hold above the critical $85,000 horizontal level. Traders should watch for a potential pullback before the anticipated upward continuation, as suggested by the brief downward movement in the arrow pattern, which could offer an attractive entry opportunity before the next leg higher.
Disclosure: I am part of Trade Nation's Influencer program and receive a monthly fee for using their TradingView charts in my analysis.

Bitcoin needs a upward correction.Market needs to full fill the upper side liquidity. BTC funding rate is also increasing. so there is a good possibility market will cover up the up side liquidity.

BTC Setup SundayBitcoin’s short- to medium-term outlook is cautiously constructive but nuanced by mixed signals across on-chain fundamentals, technicals, and market flows.
On-Chain Fundamentals:
Network security remains robust with rising hash-rate and difficulty, supporting long-term confidence. Active addresses and transaction volumes are stable, indicating steady user engagement. Whale supply share is stable, showing no aggressive accumulation or distribution, which suggests no imminent large-scale directional shifts from major holders. MVRV metrics place Bitcoin in a mid-optimism phase, implying moderate valuation support but not exuberance.
Technical Signals:
Short-term (15m to 1d) technicals show consolidation with a slight bullish bias—MACD bullish crossovers and neutral RSI support potential breakouts near $85,000 resistance. However, overbought Stochastic RSI and weekly bearish patterns (Double Top, Three Black Crows) caution against strong upward conviction without confirmation. The weekly MACD remains bearish but narrowing, hinting at a possible trend reversal if momentum builds.
Exchange Liquidity & Fund Flows:
Institutional fund flows have been negative for three consecutive weeks, with significant Bitcoin outflows totaling $751m last week, reflecting risk aversion amid macro uncertainty (tariffs, rising yields). Outflows are broad-based geographically and across product types, indicating widespread caution rather than localized profit-taking. Short Bitcoin products also saw outflows, suggesting reduced bearish positioning.
Whale Movements:
Whale supply remains steady without notable accumulation or distribution, implying that large holders are currently sidelined or holding, which reduces the risk of sudden large sell-offs but also limits strong buying pressure.
Trading Opportunities & Risks
Opportunities:
A confirmed daily close above $85,310 with volume surge could trigger a momentum-driven breakout trade targeting $95,000 and beyond.
Short-term bullish reversal patterns and MACD signals support tactical long entries on dips near demand zones (~$77,000-$83,000).
Range-bound trading between $77k demand and FWB:88K supply zones offers mean-reversion setups with defined risk.
Risks:
Overbought Stochastic RSI and weekly bearish patterns warn of potential pullbacks or failed breakouts.
Continued institutional outflows and macro uncertainty may suppress sustained rallies.
Failure to break above $85,310 resistance could lead to consolidation or retracement toward lower support levels.
Summary:
Bitcoin is in a consolidation phase with a slight bullish tilt but faces key resistance near $85,000. On-chain strength and stable whale behavior provide a solid foundation, yet institutional caution and mixed technical signals advise prudence. Traders should watch for breakout confirmation or signs of rejection at supply zones, balancing momentum and mean-reversion strategies accordingly.

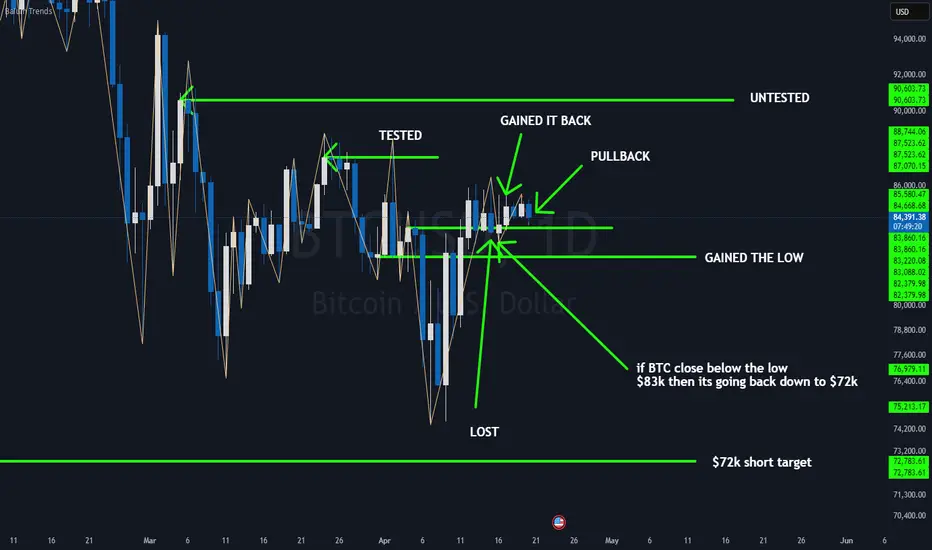
BTC TARGETTING $90KBTC recently dipped to the 83K level before bouncing to around 84K. It appears to be pulling back to retest support at 83K. If it holds, we could see a move toward the previously tested 87K level, with an untested target at 90K. However, if 83K support fails, 72K becomes the confirmed downside target.
“Does size matter?” when it comes to backtesting?It’s the kind of question that gets a few smirks, sure. But when it comes to backtesting trading strategies, it’s not a joke, it’s the difference between confidence and false hope.
Let’s get real for a minute: the size of your candles absolutely matters.
What you don’t see can hurt you
Most people start testing on bigger timeframes. It’s faster, easier on the eyes, and the results look clean. But clean doesn’t mean correct.
Larger candles blur the details. That one nice-looking 4-hour candle? Inside, price could’ve spiked, reversed, chopped around, or triggered your stop before closing where it did. You’d never know. And that’s the problem.
You might think your entry worked beautifully… but only because the data smoothed out everything that actually happened.
A backtest should feel like a real trade
Trading isn't just about the final price. It’s about what price does to get there. That messy movement inside the candle? That’s where most trades are made or broken.
If your strategy is even remotely reactive, waiting for structure, confirmation, retests, or anything time-sensitive, you need to see what price did between the open and close.
And the only way to see that? Use smaller candles.
Smaller data, clearer picture
1-minute candles might look overwhelming at first, but they give you something the higher timeframes just can’t: behavior.
Not just outcomes. Not just win/loss stats. But the actual shape of the move, the hesitation, the fakeouts, the precise moment when the trade made sense—or didn’t.
And once you start testing with that level of detail, your strategy either earns your trust… or shows its cracks.
So how small should you go?
There’s no one-size-fits-all here. But as a general rule: if your idea relies on precision, go small. Test it on 1-minute or 5-minute charts, even if you plan to execute on higher timeframes. You’ll quickly see if the entry makes sense, or if you’ve been relying on candle-close hindsight.
Yes, it takes longer. Yes, you’ll stare at noisy charts for hours. But your strategy will thank you.
Watch out for “too good to be true”
One last thing, if your backtest results look flawless on 1h or 4h candles, pause. That’s often a sign that you’re testing a story, not a strategy.
Zoom in. See what actually happens. You might be surprised at how different the same trade looks when you’re not glossing over the details.
TL;DR:
In backtesting, size absolutely matters. Smaller candles reveal real behavior. Bigger ones hide the truth. So if you care about how your strategy actually performs not just how it looks.
go smaller. Your backtesting will get sharper, and your confidence? Way more earned.

15 Mins BTCUSDOn 15min timeframe Price breaks trendline to the upside. Enter on first Blue candle that close above trendline, Stops at pervious support level and go for risk 1 to 1.5.

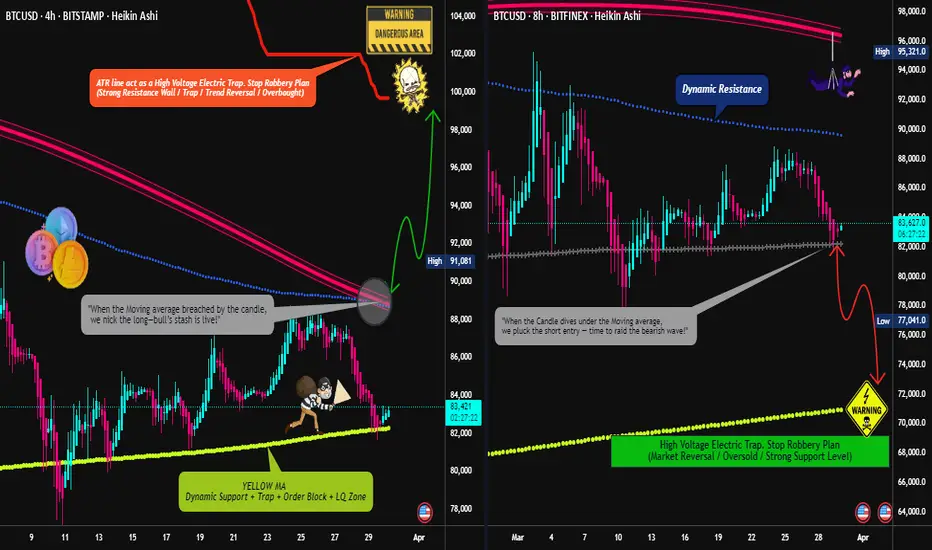
BTC/USD "Bitcoin vs U.S.Dollar" Crypto Market Heist (Swing/Day)🌟Hi! Hola! Ola! Bonjour! Hallo! Marhaba!🌟
Dear Money Makers & Robbers, 🤑💰✈️
Based on 🔥Thief Trading style technical and fundamental analysis🔥, here is our master plan to heist the BTC/USD "Bitcoin vs U.S.Dollar" Crypto Market. Please adhere to the strategy I've outlined in the chart, which emphasizes long entry and short entry. 🏆💸Be wealthy and safe trade.💪🏆🎉
Entry 📈 :
"The loot's within reach! Wait for the breakout, then grab your share - whether you're a Bullish thief or a Bearish bandit!"
🏁Buy entry above 89000
🏁Sell Entry below 81000
📌However, I recommended to place buy stop for bullish side and sell stop for bearish side.
Stop Loss 🛑:
🚩Thief SL placed at 84000 for Bullish Trade
🚩Thief SL placed at 88000 for Bearish Trade
Using the 4H period, the recent / swing low or high level.
SL is based on your risk of the trade, lot size and how many multiple orders you have to take.
Target 🎯:
🏴☠️Bullish Robbers TP 99000 (or) Escape Before the Target
🏴☠️Bearish Robbers TP 72000 (or) Escape Before the Target
BTC/USD "Bitcoin vs U.S.Dollar" Crypto Market Heist Plan is currently experiencing a neutral trend,., driven by several key factors.
📰🗞️Get & Read the Fundamental, Macro, COT Report, On Chain Analysis, Sentimental Outlook, Intermarket Analysis, Future trend targets.. go ahead to check 👉👉👉🔗
⚠️Trading Alert : News Releases and Position Management 📰 🗞️ 🚫🚏
As a reminder, news releases can have a significant impact on market prices and volatility. To minimize potential losses and protect your running positions,
we recommend the following:
Avoid taking new trades during news releases
Use trailing stop-loss orders to protect your running positions and lock in profits
💖Supporting our robbery plan 💥Hit the Boost Button💥 will enable us to effortlessly make and steal money 💰💵. Boost the strength of our robbery team. Every day in this market make money with ease by using the Thief Trading Style.🏆💪🤝❤️🎉🚀
I'll see you soon with another heist plan, so stay tuned 🤑🐱👤🤗🤩
BTCUSD Eyes Reversal at $83,642 – Key Bounce Zone Ahead!Price is completing a potential bullish harmonic move toward the $83,642 zone, which aligns with a strong support level. If buyers step in here, we may see a reversal toward $84,591 and possibly higher. However, if $83,411 breaks, downside risk increases.
🟢 Watch for bullish price action near $83,642
🔴 Invalidation below $83,411
📈 Previous rejection from $85,822 led to current pullback

BTCUSD: Bulls Are Winning! Long!
My dear friends,
Today we will analyse BTCUSD together☺️
The recent price action suggests a shift in mid-term momentum. A break above the current local range around 84,334.50 will confirm the new direction upwards with the target being the next key level of 84,988.36 and a reconvened placement of a stop-loss beyond the range.
❤️Sending you lots of Love and Hugs❤️

Bitcoin’s Breakout Blueprint: Eyeing $92KAs of April 20, 2025, Bitcoin (BTC) is trading around $84,500, having recently tested the $92,000 level multiple times. This price point is significant, serving as both a psychological barrier and a technical resistance level.
Technical Analysis:
Resistance and Support Levels: Bitcoin has encountered resistance near $92,000, a level that has been tested repeatedly. A sustained move above this could open the path toward $100,000 and potentially $108,000, the previous all-time high from December 2024. On the downside, support is observed around $85,650, aligning with the 200-day EMA. Further support lies at $78,000 and $74,500, marking previous consolidation zones.
Chart Patterns: The formation of a bullish pennant on the daily chart suggests potential for an upward breakout. If confirmed, this pattern could propel BTC toward $137,000 by Q3 2025.
Volume and Momentum: Recent trading volumes have been moderate, with a slight uptick during price advances, indicating growing buyer interest. Momentum indicators, such as the RSI, are neutral, leaving room for further price movements in either direction.
Fundamental Factors:
Institutional Inflows: Significant capital inflows into Bitcoin ETFs, exceeding $70 billion, have been observed, reflecting strong institutional interest.
CryptoRank
Macroeconomic Environment: Liquidity injections by the U.S. Treasury, amounting to $500 billion since February 2025, have increased market liquidity, which historically correlates with Bitcoin price appreciation.
Halving Effect: The April 2024 Bitcoin halving event has reduced the supply of new BTC, a factor that has historically led to substantial price increases in subsequent months.
Mid-Term Outlook:
Considering the technical and fundamental factors, Bitcoin's mid-term target remains at $92,000. A decisive break above this level could lead to a retest of the $100,000 psychological barrier and potentially higher targets. However, failure to maintain support above $85,650 may result in a consolidation phase or a retest of lower support levels.
Investors should monitor key resistance and support levels, institutional investment trends, and macroeconomic indicators to assess Bitcoin's trajectory in the coming months.

BTC will head towards S1 and may even head towards S21. Objective
• Primary Target (TP1): Support 1 at 84,417
• Secondary Target (TP2): Support 2 at 83,801
2. Timeframes
• Analysis: 4‑hour chart (H4) to confirm medium‑term bearish bias
• Execution & Confirmation: 1‑hour chart (H1)
3. Entry Criteria
1. H4 Breakdown: Close below the minor resistance zone (~84,700) on H4.
2. H1 Confirmation: A H1 candle closes below S1 (84,417) with above‑average sell volume.
3. RSI Filter: H1 RSI < 50 but ≥ 30, indicating room to drop further before oversold.
4. Position Sizing & Risk Management
• Risk per Trade: 1–2 % of account equity.
• Stop‑Loss Options:
• Tighter: Above the broken minor resistance (~84,700), or
• Wider: Above the Pivot Point (85,016).
• Risk/Reward Ratios:
• Entry → TP1: aim for at least 1:2 RR
• Entry → TP2: overall position RR of at least 1:3
5. Exit Plan
1. Partial Take‑Profit: Close 50 % of the position at S1 (84,417).
2. Breakeven & Trail:
• Move stop to breakeven once TP1 is hit.
• Then trail stop above the most recent swing high (e.g. ~84,500) as price heads toward S2.
3. Final Exit: Close remaining position at S2 (83,801).
6. Alternative Scenario (False Break )
• Signal: If price revisits S1 but forms a bullish rejection candle (hammer/engulfing) with rising buy volume.
• Action:
• Cancel the short, or
• Flip to a quick long scalp toward the broken resistance (~84,700) with a tight SL below the reversal low.
7. Monitoring & Adjustment
• RSI (H1/H4):
• Beware when RSI approaches oversold (<30) without further breakdown—it may signal a rebound.
• Watch for bullish divergence (lower low price + higher low RSI) as an early reversal cue.
• Volume:
• Require sell‑volume on entry bars to exceed the 20‑period average.
• Economic Calendar:
• Avoid new entries around high‑impact news releases (red‑icon events).


BTCUSD 15MIN ORBTrading strategy on BTCUSD, I've made this to start helping myself with my journey & control. I started on the 2nd of august 2024. I will be sharing my trades plus what I think price will be doing next, mainly on XAUUSD BTCUSD, I'm open to any advice or constructive criticism as this will only help me going forward. this is my first video and will be trading a 10k funded

BTCUSDselling BTCUSD
sl 85700
tp 75849
1% risk on each trade
like an follow
short on btc/usd
NOTE: Like in life, risk management
is important if a forex trader wishes to survive.
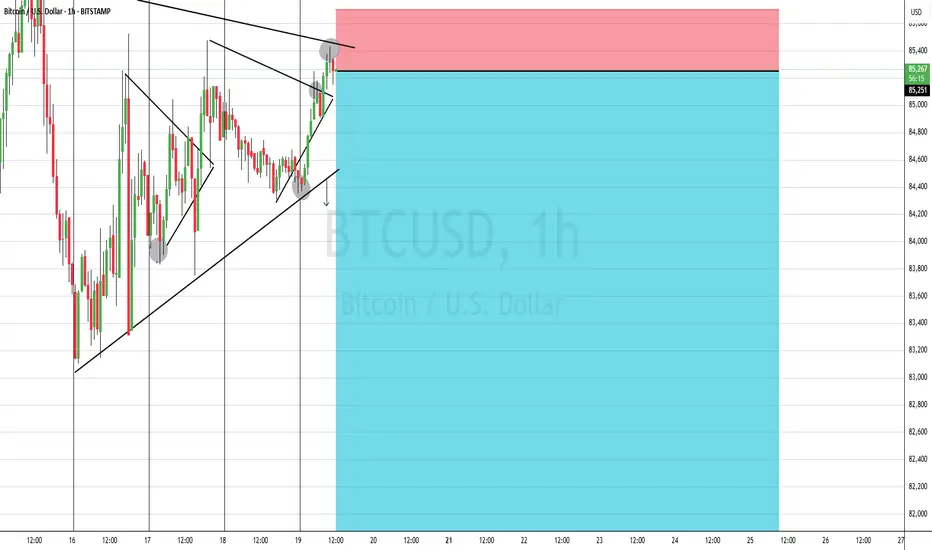
BITCOIN BEARISH TRADE IDEA (H1)BTC/USD has been rejected at the resistance zone of $85,148-$85,714, which aligns with a descending trendline, signaling potential bearish momentum. The price is currently testing an ascending trendline from $74,000.
Analysis
The rejection at $85,148-$85,714, combined with the descending trendline, indicates strong selling pressure at this level.
The ascending trendline is providing support, but a break below it could lead to a move toward lower support levels.
A break above the resistance zone would invalidate the bearish setup and suggest potential bullish continuation.
Key Levels to Watch
Resistance: $85,148-$85,714
Support: Around $81,410
Ascending trendline: A break below is an extra confirmation for bearish momentum.
Rationale
The confluence of the resistance zone and the descending trendline marks a critical decision point. The recent rejection strengthens the bearish outlook, but the ascending trendline remains a pivotal factor for the next move.

bitcoin buy longnew sentiment long, 3rd touch trendline
#forex
#bitcoin
#crypto
use proper risk management


BTCUSD 4/20/2025Come Tap into the mind of SnipeGoat, as he gives you a beautiful, orchestrated analysis of Prices past endeavors, to Precisely determine Bitcoin's next move.
_SnipeGoat_
_TheeCandleReadingGURU_
#PriceAction #MarketStructure #TechnicalAnalysis #Bearish #Bullish #Bitcoin #Crypto #BTCUSD #Forex #NakedChartReader #ZEROindicators #PreciseLevels #ProperTiming #PerfectDirection #ScalpingTrader #IntradayTrader #DayTrader #SwingTrader #PositionalTrader #HighLevelTrader #MambaMentality #GodMode #UltraInstinct #TheeBibleStrategy

bitcoin short sellbearish
lowers lows
momentum downwards
#crypto
#forex
# bitcoin
use proper risk management
