BTC/USD Eyes $109K After Bullish Breakout!!🧠 Chart Type and Indicators:
Chart Type: Candlestick
Indicators Used:
EMA 50 (red line): 85,335.18
EMA 200 (blue line): 85,657.29
🔍 Technical Pattern Analysis:
Pattern Identified: Ascending Triangle
The price has formed higher lows (ascending trendline support) while repeatedly testing a horizontal resistance zone (~$88,000), forming an ascending triangle.
This is typically a bullish continuation pattern when it occurs after an uptrend, though in this context, it's forming after a consolidation, giving more significance to the breakout.
🚀 Breakout Confirmation:
The price has broken above the horizontal resistance and is currently trading at $92,766.51.
Volume is not visible but should be increasing during a valid breakout.
Both EMAs have been decisively breached to the upside, signaling momentum shift in favor of bulls.
🧩 Key Levels:
Support Zone (Post-Breakout Retest): ~$88,000
Previously a resistance zone, now likely to act as support.
Immediate Resistance: ~$96,000
Historical resistance zone shown on the chart with a horizontal black line.
Extended Target (measured move): ~$109,420
Based on the height of the triangle projected from the breakout point.
📈 Price Action Forecast:
Two possible scenarios (depicted with arrows on the chart):
Bullish Continuation:
A retest of the $88,000 zone followed by continuation to $96,000, then $109,420.
Short-Term Pullback:
Price may dip to retest the breakout zone (~$88,000), consolidate, then rally higher.
✅ Bullish Signals Summary:
Breakout from a bullish ascending triangle.
EMAs crossed and price holding above them.
Clear higher highs and higher lows formation.
Momentum suggesting further upside.
🧨 Risks to Watch:
False Breakout Risk: If the price fails to hold above $88,000 and falls back into the triangle range.
Macro Factors: Bitcoin remains sensitive to macroeconomic news and regulations that could disrupt technical setups.
BULLUSD trade ideas

Is this the perfect time to buy Bitcoin? Hello,
While the significant market correction since January 2025 has left many feeling fearful, we believe this presents a perfect opportunity for those with a long-term investment horizon. The recent pullback in asset prices, particularly in the cryptocurrency space and equities, has created an attractive entry point for seasoned investors.
President Trump's ongoing commitment to positioning the United States as the global capital for cryptocurrency, with Bitcoin as a key component of the nation's reserves, reinforces the enduring fundamental strength of this digital asset. Despite the short-term volatility, Bitcoin's long-term prospects remain robust, supported by this high-level governmental endorsement .
Since its peak in January, Bitcoin has experienced a correction exceeding 25%, bringing it to levels that we view as an ideal accumulation zone. Our technical analysis further confirms this perspective, as the cryptocurrency approaches a critical upward trendline, suggesting that buyers may soon step in to drive a resurgence. Additionally, the MACD indicator is on the cusp of a bullish zero crossover, providing additional confirmation of an impending rebound.
For patient, forward-thinking investors, we strongly recommend initiating or increasing Bitcoin positions at these current prices. By adopting a disciplined, long-term approach and weathering the near-term fluctuations, you can position yourself to capitalize on the substantial upside potential as Bitcoin's trajectory aligns with the supportive stance of the U.S. government.
Disclosure: I am part of Trade Nation's Influencer program and receive a monthly fee for using their TradingView charts in my analysis.

Bitcoin .618 and two legs Up .crossroads time againthe chart posted of bitcoin . I was looking for a 72500 print it was at 74544 instead sometimes you miss things but now we have two legs up or 1/2 1/2 Not sure yet But will sit and wait . I would NOT want to see it ever go back under79910 ever if it did we will decline well below 74500

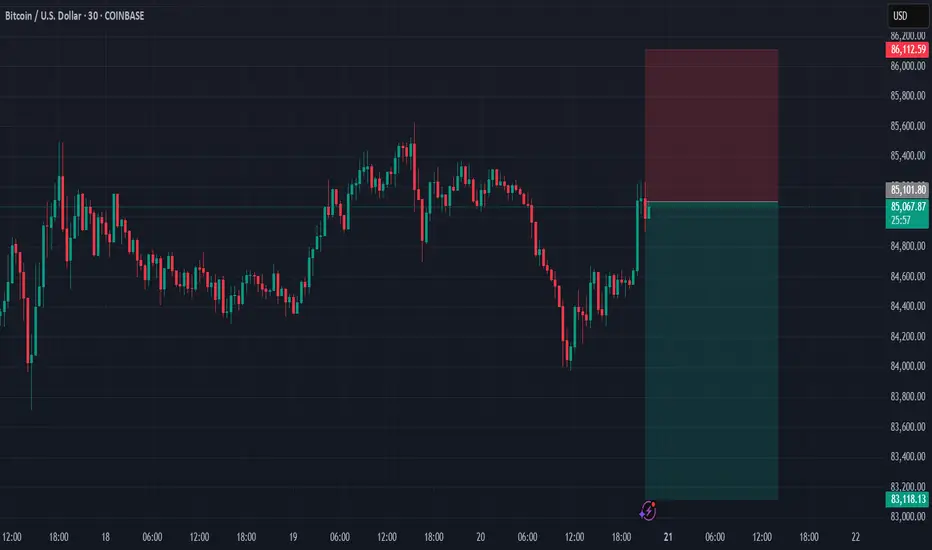
BTCUSD Sell Signal @ 85100A bearish signal has been triggered for Bitcoin against the US Dollar at the 85,100 level. This indicates a potential trend reversal or correction from recent highs, suggesting sellers may be stepping in at this price point. Traders might consider this an opportunity to short BTCUSD or take profits on long positions. As always, proper risk management and confirmation from additional technical indicators (e.g., RSI, MACD, trendlines) are recommended before taking action.
BTC Elliott wave analysis 4/19/2025I think now we have come to the Wave B of the Big 4 wave. So I think we might be going down to the micro b for a bit before going up to micro c to complete the C wave around 96000-97000 And then we will going down to the Wave C of big 4 wave around 71,000-69000 before we have the big 5 wave of the Grand Super Cycle

BTC 2026 Bearish We can see after 2 halving cycle BTC will reach the Top Price Cycle within 500 days and will enter Bearish Cycle with the correction of almost 70 to 80 % for approx 300 + days. Will the 70 to 80% correction happen again even after Many Country make BTC legal and Put BTC into their Backup Fund ? Or It will happen but the correction only 30 to 40 % ? Let's see. 2026 will be Interesting

BITCOIN - Bullish Double BottomHello Traders !
The BTC price formed a double bottom pattern.
Currently, The neckline is broken !
So, I expect a bullish move🚀
______________
TARGET: 88700🎯

BITCOIN RESISTANCE AHEAD|SHORT|
✅BITCIN is going up now
But a strong resistance level is ahead at 94,900$
Thus I am expecting a pullback
And a move down towards the target at 91,000$
SHORT🔥
✅Like and subscribe to never miss a new idea!✅
Disclosure: I am part of Trade Nation's Influencer program and receive a monthly fee for using their TradingView charts in my analysis.

Taking some profits expect some resistance at 92500Looking good so far. Got through the cloud. Taking profits and wait to see if it gets to 92500 and what it does from there. Volume getting low.

Coinbase Bitcoin Monthly VWAPShows the Monthly VWAP of Bitcoin from Coinbase's quoted pricing. Not sure how to do historical months though, as it only presents the current month.

Happening NOW, breakout on Daily, 4hour and 60min timeframesUsing simple trend lines, a buy signal has happened on the Daily, 4-hour and 1-hour charts.
I'm using the candle bodies for my trend lines.

Weekly Cryptocurrency Market Analysis:Bitcoin(BTC)–Issue274(FreeThe analyst believes that the price of Bitcoin will decrease within the time specified on the countdown timer. This prediction is based on a quantitative analysis of the price trend.
___Please note that the specified take-profit level does not imply a prediction that the price will reach that point. In this framework of analysis and trading, unlike the stop-loss, which is mandatory, setting a take-profit level is optional. Whether the price reaches the take-profit level or not is of no significance, as the results are calculated based on the start and end times. The take-profit level merely indicates the potential maximum price fluctuation within that time frame.

w3 april . recap it's been a sideways week. was mainly gonna look for short to lower and bigger entry level for this pwUptrend. The short wasnt strong enough though. we're crawling upwards. bullish weekly open. trade the trend.

BTC NEXT MOVE ANALYSIS Bitcoin is showing strong bullish momentum, with a potential pullback setup forming. We are currently watching the $93,300 zone for short term reaction, but our primary interest lies lower.
A buy limit is planned at $90,500, aligning with a high-probability demand zone and market structure support. This area could provide an optimal entry for a continued push toward the draw of liquidity near $96,500.
Stay patient any dip toward this zone is a buying opportunity.
Setup is valid unless price closes below $90,000.
Stay Tuned For More 🤝🎖️🫡

Will BTC emerge from the local downtrend channel on top?Hello everyone, let's look at the 1D BTC to USD chart, in this situation we can see how the price is moving in a downtrend channel in which we can currently observe an attempt to exit on the top. In such a situation, it must be borne in mind that often exiting the channel gives energy for growth close to the height of the channel itself, which in this situation could give a valuation in the region of $ 100,000 for 1 BTC.
However, before this happens, the price must positively exit the channel and break the first resistance line at $ 88,800, and then a significant level at $ 94,200.
Looking the other way, when the price bounces off the upper boundary of the channel and starts to fall again, we have a visible support zone from $ 85,150 to $ 83,000, and then a second very strong zone from $ 77,200 to $ 74,100.

w3 april . zoomed out2h timeframe to show on the bigger picture what i was looking for in terms of SHORT at pwHigher Range, to get the lower bigger LONG entry, but as visible here better, the SHORT wasnt strong enough. Trade the trend, meaning, BULLISH wOpen.

Bitcoin Bearish Reversal Setup: Rising Wedge Breakdown Targeting1. Entry Point:
Marked around $86,853, this is where a potential short (sell) trade might have been initiated.
2. Stop Loss:
Placed above $88,783, protecting the trade in case the market goes against the position.
3. Target Point (Take Profit):
Aiming down toward $74,443.76, suggesting a large bearish move is anticipated.
4. EMA Indicators:
30 EMA (Red Line) at ~$84,271: Indicates short-term trend.
200 EMA (Blue Line) at ~$83,496: Indicates long-term trend.
Price is currently trading above the 200 EMA but slightly below the 30 EMA, showing mixed short-term momentum.

Bitcoin Bulls Eye $95K as Upside Momentum BuildsAfter a bullish wedge break and having cleared the key 50-day moving average earlier this week, bitcoin bulls will now be eyeing a break above $95,000, especially with indicators such as RSI (14) and MACD signalling strengthening topside momentum.
A break and close above $95,000 would generate a bullish setup, allowing for longs to be established above with a stop beneath for protection. While some resistance may be encountered around $100,000, a move beyond that psychologically important level may encourage bulls to look for a run towards the record high above $108,000.
In the interim, bids have been noted at $91,750 with sellers emerging on pushes above $94,000.
Good luck!
DS

Bitcoin 240k next 10k on bear marketOn chart I see good support level created on Covid times and good liquidity compression which must be grabed well. Alternative scenario we must see very good move upside to 500k+ but I don't believe in it.

Bitcoin is approaching as the global liquidity explosion reachesThese fractal patterns don’t lie — Bitcoin has found its dip, and it’s time to reverse upward. We are ready for the explosion, because everything is repeating once again. The M2 liquidity index has reached a new level. Wish you success, Mr. Ghasemi.

Bitcoin Blasts to $95,800: Next Stop $96,500?Bitcoin is on FIRE! Just hit $95,800 & climbing in a perfect rising channel!
Breakout after breakout — next stop $96,500?
Check the 1H chart but beware of potential pullbacks!

BITCOIN just triggered the ultimate post-Halving BUY SIGNAL!Bitcoin (BTCUSD) hit last week the top of the green Gaussian Channel (GC), a key indicator as last time it did (September 02 2024), kickstarted the massive 2024 rally towards the end of the year.
In fact, it can be argued that when BTC makes contact with the GC during a Bull Cycle, it is the ultimate pull-back Buy Signal after Halving events. More specifically, during the previous Cycle and after the May 2020 Halving, the price touched the GC three times (August 31 2020, July 19 2021 and September 20 2021), all of which were the most optimal pull-back Buy Entries as Bitcoin rebounded instantly.
So far during this Cycle and after the April 2024 Halving, this is the 2nd time the GC is tested. As mentioned the first also initiated an instant rebound. As a result, the current GC test is technically considered a very strong buy opportunity for the remainder of the Cycle, which based on the Time Cycles of the last 2 Cycle Tops, it should peak around October 06 2025.
So what do you think? If buying now towards a potential October 2025 Top, the perfect opportunity? Feel free to let us know in the comments section below!
-------------------------------------------------------------------------------
** Please LIKE 👍, FOLLOW ✅, SHARE 🙌 and COMMENT ✍ if you enjoy this idea! Also share your ideas and charts in the comments section below! This is best way to keep it relevant, support us, keep the content here free and allow the idea to reach as many people as possible. **
-------------------------------------------------------------------------------
💸💸💸💸💸💸
👇 👇 👇 👇 👇 👇

TheKing Cycles- Nothing can be perfect in Life or in Trading, but you can always brighten up your day.
- Remember "Cycles are Cycles"
- Everything is in graph
- You can follow bears, predicting 10 years of recession, but we are in a big recession and for a long time already.
- You can fall in the deep and predict the darkness.
- i like to see the sunshine in the morning and i will always radiate warmth.
- Follow Hope, and always believe in your own judgement.
- Be Bold and do the opposite of what commons peoples think.
Happy Tr4Ding !
