BTC/USDT – Trap Activated: Is the Final Flush Coming?📆 Follow-up to our April 16 idea:
Back then we warned:
“Fake pump to 85.8K, followed by a drop to 81.5K. Tape is rotten, stops are baited, and Delta screams ‘run!’”
Well... here’s what’s happened since:
✅ What’s been confirmed:
BTC pushed into the 85.5K–85.8K trap zone and got rejected hard
Delta turned positive briefly – but with no price continuation
OI stayed flat = no real conviction = stealth distribution
Tape showed clear absorption at the highs
🎯 The trap we predicted is now active. Bulls walked right into it.
❗ What’s still to come (likely very soon):
The final flush of long positions hasn't happened yet.
Updated liquidation maps (1D & 48H) show massive clusters below 82.8K–81.2K full of over-leveraged longs.
⚠️ If price breaks below 83K with volume + strong red delta...
💣 Expect a liquidation cascade.
🧠 Strategy (Still Aligned with April 16)
🔻 SHORT (Primary Idea)
Entry: Rejection at 85.5K–85.8K
SL: 86.2K
TP1: 83.2K
TP2: 81.5K
🔺 LONG (Only if the flush comes first)
Entry: Sweep down to 82.8K + delta reversal + OI spike
SL: 81.8K
TP: 84.8–85.2K
🌍 Updated Macro Context:
USD still strong 💵
Fed not pivoting anytime soon 🏦
Trump’s BTC reserve news = bullish narrative, but no short-term impact yet
📉 Macro still favors risk-off sentiment
🎭 Final Words from the Pôncio Doctrine:
“The trap is active. The stops are aligned.
Now we just wait for one institutional candle to wipe the board.”
If this breaks… you’ve officially been Pônciado.
BULLUSD trade ideas

BITCOIN just triggered the ultimate post-Halving BUY SIGNAL!Bitcoin (BTCUSD) hit last week the top of the green Gaussian Channel (GC), a key indicator as last time it did (September 02 2024), kickstarted the massive 2024 rally towards the end of the year.
In fact, it can be argued that when BTC makes contact with the GC during a Bull Cycle, it is the ultimate pull-back Buy Signal after Halving events. More specifically, during the previous Cycle and after the May 2020 Halving, the price touched the GC three times (August 31 2020, July 19 2021 and September 20 2021), all of which were the most optimal pull-back Buy Entries as Bitcoin rebounded instantly.
So far during this Cycle and after the April 2024 Halving, this is the 2nd time the GC is tested. As mentioned the first also initiated an instant rebound. As a result, the current GC test is technically considered a very strong buy opportunity for the remainder of the Cycle, which based on the Time Cycles of the last 2 Cycle Tops, it should peak around October 06 2025.
So what do you think? If buying now towards a potential October 2025 Top, the perfect opportunity? Feel free to let us know in the comments section below!
-------------------------------------------------------------------------------
** Please LIKE 👍, FOLLOW ✅, SHARE 🙌 and COMMENT ✍ if you enjoy this idea! Also share your ideas and charts in the comments section below! This is best way to keep it relevant, support us, keep the content here free and allow the idea to reach as many people as possible. **
-------------------------------------------------------------------------------
💸💸💸💸💸💸
👇 👇 👇 👇 👇 👇

BTC has upside chances until it holds above 81K areaMorning folks,
So, picture barely has changes since our last discussion. Right now we do not see any ready-to-trade setups. But suggest some bullish support to the market. After major XOP target has been reached - BTC has not dropped but remains in tight consolidation. This is more a bullish sign.
In general, we could suggest here a kind of reverse H&S shape. It makes us think that until BTC price is above ~ 81K area, it keeps chances on upside breakout. Drop below 81K will lead BTC back to the previous lows.
So, if you would like to buy - try to do this as closer to the lows of consolidation as possible. We consider no shorts by far.

Btcusd possible sell analysis.This analysis is expected to play out when price break and closes below the 83,659 price on the 4H TF. For entry, wait for a second sell candle close on the 15min TF.
Kindly note that this is for educational/learning purpose only.

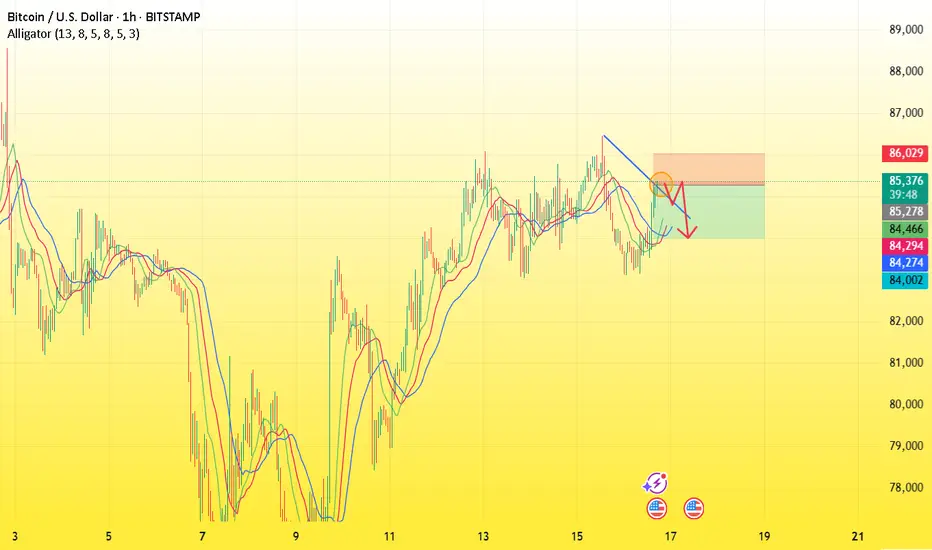
Bitcoin Bearish Reversal Setup: Rising Wedge Breakdown Targeting1. Entry Point:
Marked around $86,853, this is where a potential short (sell) trade might have been initiated.
2. Stop Loss:
Placed above $88,783, protecting the trade in case the market goes against the position.
3. Target Point (Take Profit):
Aiming down toward $74,443.76, suggesting a large bearish move is anticipated.
4. EMA Indicators:
30 EMA (Red Line) at ~$84,271: Indicates short-term trend.
200 EMA (Blue Line) at ~$83,496: Indicates long-term trend.
Price is currently trading above the 200 EMA but slightly below the 30 EMA, showing mixed short-term momentum.

BTCUSD - Buy Trade CallOn daily TF, since 20 Jan 2025 BTC was in downtrend following regression channel.
MACD also was mostly indicating short trade. However, now MACD is showing likely upward movement. Moreover, Williams Alligator also suggesting a likely change of trend to bullish.
Coupling that with USA falling stocks, BTC is a gaining attraction of US investors.
Therefore, one may take a BUY trade now or technically very correct entry would be after price crosses the resistance level ($ 88,950) which is also previous Lower High.

Bitcoin: Are We Facing a Financial Paradigm Shift?Ion Jauregui – Analyst at ActivTrades
Bitcoin is undergoing a crucial moment in its evolution. Fifteen years after its creation, this cryptocurrency has transformed from a simple digital alternative to traditional money into a consolidated unit of measurement, payment method, and potential store of value. And perhaps most importantly, it could be entering a new structural phase amidst a global transformation of the monetary system.
A Response to the Fiat System
Originally conceived as a reaction to the excessive money printing by central banks and the loss of purchasing power of fiat currencies, Bitcoin has become an increasingly utilized tool. Not only in everyday transactions —BTC ATMs can now be found in many cities worldwide— but also as a real alternative to traditional assets.
Stability and Market Maturity
Over the last year, Bitcoin's price has shown a much more stable evolution than in previous cycles, leaving behind extreme levels of volatility. Zones that previously acted as ceilings now serve as supports, suggesting maturation of the asset and greater institutional and retail acceptance.
Bitcoin vs. the Rest of the Crypto Ecosystem
While other cryptocurrencies like Ethereum continue to reflect significant fluctuations, Bitcoin stands out as the most robust asset in the crypto ecosystem. This position is further reinforced in a context of global monetary expansion, where the money supply has grown again after a brief contraction, surpassing even the peaks seen in 2024.
Bitcoin as a Safe Haven Amid Fiscal and Monetary Imbalances
This environment strengthens the narrative of Bitcoin as a hedge against inflation and currency depreciation. With governments increasing debt, deficits, and public spending, and central banks maintaining accommodative monetary policies, traditional limits seem to blur. Especially in emerging economies, where the deterioration of purchasing power is more pronounced, Bitcoin is solidifying its position as an alternative safe haven.
Technical Analysis
Currently, Bitcoin's price in recent weeks has shown a strong correlation with the fluctuations driven by Trump’s tariffs. After hitting lows on Monday the 7th and Wednesday the 9th, the precious token has appreciated back to the mid-range it has been pivoting in since February. The lower end of a long-term range fluctuating between $93,490 and $81,378. The RSI indicator currently shows no significant movements, confirming the point of control (POC) around the current price of $84,745. The moving averages from the Asian and European markets suggest that the price does not seem likely to move far from the POC for the moment. Observing Fibonacci retracements, we can see the price is currently fluctuating between 61.80% and 78.60%. This is generally a zone where a correction could occur towards the 50% level, which aligns with the lower range at $81,378. Delta zones indicate strong bearish pressure in this area, so the price might revisit this level before reinforcing the price tested more than four times.
Why Has Bitcoin Recently Fallen, Along with the Rest of the Market?
Despite this structural evolution, Bitcoin has experienced a correction in recent days, in line with the general drop in risk assets. Some of the main factors explaining this pullback include:
• Strengthening of the U.S. Dollar: The rise of the DXY index has pressured several dollar-denominated assets, including Bitcoin.
• Increase in Bond Yields: The rise in the 10-year Treasury bond yields has encouraged capital rotation towards safer instruments, at the expense of more volatile assets.
• Geopolitical Tensions: The growing uncertainty in the Middle East has generated risk aversion, favoring gold while penalizing the crypto market.
• Profit-Taking After the Halving: After the strong appreciation following April’s halving, many investors opted to lock in profits, creating additional bearish pressure.
• Liquidations in the Derivatives Market: High leveraged exposure triggered a cascade of automatic liquidations when key technical levels were broken.
A Temporary Adjustment or a Structural Opportunity?
Ultimately, although Bitcoin has suffered a recent correction, its long-term fundamentals appear to remain strong. The cryptocurrency has not only passed multiple tests throughout its history but now projects itself as a systemic asset in the new financial order. Just as gold did in earlier times, Bitcoin may be positioning itself as the mirror of the monetary excesses in the current system.
*******************************************************************************************
The information provided does not constitute investment research. The material has not been prepared in accordance with the legal requirements designed to promote the independence of investment research and such should be considered a marketing communication.
All information has been prepared by ActivTrades ("AT"). The information does not contain a record of AT's prices, or an offer of or solicitation for a transaction in any financial instrument. No representation or warranty is given as to the accuracy or completeness of this information.
Any material provided does not have regard to the specific investment objective and financial situation of any person who may receive it. Past performance is not reliable indicator of future performance. AT provides an execution-only service. Consequently, any person acting on the information provided does so at their own risk.

What factors could drive Bitcoin(BTC/USD) to reach the $68KGiven the current market conditions, Bitcoin has not managed to establish a new high in its recent upward movement. Various factors, including uncertainty regarding upcoming economic changes, reduced liquidity, the focus of financial institutions on the decline of stock markets, and the market's inability to react to sudden shifts, have contributed to the lack of a clear directional trend.
However, based on the presented analysis and chart review, it is anticipated that Bitcoin will reach the level of $68,000 in the coming weeks, paving the way for the initiation of a strong bullish trend. This upward movement is expected to first drive Bitcoin's price to approximately $130,000, and after a brief correction, the upward momentum may continue, potentially pushing the price to levels as high as $179,000.

BTC Falling Wedge .Displaying a Falling Wedge pattern, there will be some downside to come, but after that, we will see a push-up to the north.
SUPPORT AT $73,805
$111K TP

BTC USD ENTRY point 85200 target 84000 stop loss 86000Here's the setup for your BTC/USD short trade:
Entry: 85,200
Target: 84,000
Stop Loss: 86,000
Trade Breakdown:
Risk (SL - Entry): 800 pips
Reward (Entry - TP): 1,200 pips
Risk-to-Reward Ratio: 1:1.5 (solid)
Quick Tips:
Watch for a lower high or bearish candle formation at/near 85,200 before entry.
Set alerts near 84,400 to consider trailing your stop or partial close.
If BTC is trending strongly, wait for signs of exhaustion before entering short.
Need help stacking confluences for the trade or checking current market sentiment?
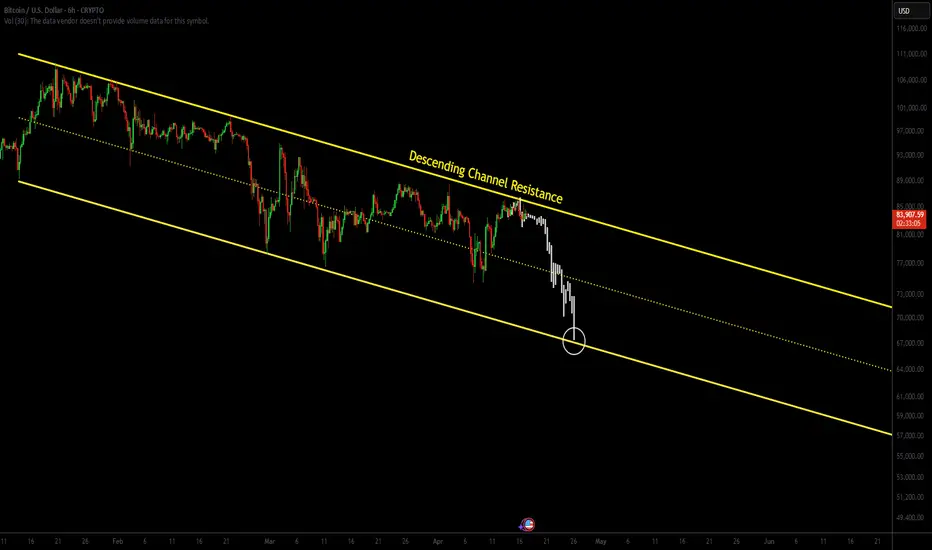
Bitcoin Pressing Against Descending Channel ResistanceIn today’s analysis, we examine Bitcoin’s price action as it continues to respect a descending channel pattern. With current price consolidating at the upper boundary of this channel, traders are now questioning whether BTC will break out or reject and rotate lower.
Key Points Covered in This Article:
- Bitcoin is currently consolidating at resistance of the descending channel
- A break of the recent swing low could lead to a drop to $67,400 support
- Confirmation of bullish breakout requires volume-backed move above channel resistance
Bitcoin is currently pressing into the top boundary of a descending channel, where resistance is holding firm. On the lower time frame, price action has entered a period of consolidation — a key sign of indecision. However, from a structural point of view, resistance remains resistance until broken. A failure to break through the upper boundary could accelerate downside momentum.
Should the current swing low be breached, traders can expect a move toward the lower boundary of this descending channel, situated around $67,400. This level will act as the next significant support, and it may provide a potential entry for reversal plays, depending on how price behaves upon reaching it.
For bullish continuation to occur, Bitcoin must decisively break above the descending channel with strong volume confirmation. Without this signal, any moves to the upside may be short-lived and potentially lead to liquidity grabs before another rotation lower. Traders should stay patient and wait for either a clear breakout or confirmation of further downside before entering positions.
GLD/SPX as a risk-off signal for BTC/SPXFor all the "Bitcoin will follow gold" crowd...
This chart tells a very different story.
Every time we’ve seen GLD/SPX rally sharply, BTC/SPX has underperformed for months afterward.
📉 See the shaded red zones – they highlight periods when:
GLD/SPX (gold line) made strong relative moves,
BTC/SPX (aqua line) lagged or outright dropped.
We're in another one of those zones right now.
Unless you’ve got a strong reason why "this time is different," the base case is clear:
BTC/SPX likely underperforms for another 3–6 months.
If you're positioning long BTC expecting it to mimic gold's run, be aware — that hasn't played out well historically.
🧭 Trade Idea:
Patience: Don't rush the BTC long. Let the GLD/SPX spike play out.
Timeframe: Revisit BTC/SPX for potential re-entry mid-to-late 2025.


BtcusdFirstly my apologies for the messy chart,Pattern broker and retested and I had a three move touch on my resistance marked with a rectangle

* BTC Elliot Waves Update: 2 Scenarios *I hope everybody has been making money these past few days!
I'm once again bringing an update on the scenarios we currently have.
These are the scenarios I'll be watching for the rest of this week.
Enjoy it!

Bitcoins path to sub 10KTake a look at the fractal from 21. The parabola and all the EMA's line up almost perfect...
BE CAUTIOUS HERE!!!
