What if I show you Bitcoin is at end of 1st cycle only ?
The Chart above involves TWO things we may need to pay attention to.
There is so much involved in this and I could go on for hours because, for me, this opens the door to so many things for Bitcoin.
And I am now looking at this past 14 years as the "Beginnings".
And we need to wait and see Where we go next before we label that
So..
What do we have here.
The ARC of Resistance. - I have talked about this before. Simply put, PA on every ATH since 2011 has been rejected by the same line / Arc - This needs no more than the Arc on a chart to see...
It is as simple as that.
Beneath this, we have that Dashed line of Support that has Never been Broken. Created off a High in 2011, it got retested as support in 2015 and not again until 2023.
Between these two points, you will notice how that Arc of resistance was at its furthest points from the line of support below.
It is like the Beginning and End of a sequence.......
The next thing we have is a Very interesting thing called the Trend-Based FIB Time.
It is important to understand what this is, So ;-
Trend-Based Fib Time is a technical analysis tool that uses the Fibonacci sequence to predict probable price corrections within an existing trend. It is represented by vertical lines at specific time intervals that show potential areas where a swing high, low, or reversal could occur. These intervals are based on the Fibonacci sequence and are not concerned with price levels but rather with time. The tool helps traders identify how far a wave is likely to travel in the trend.
Note what is in Bold there.
And then look at the chart..It clearly shows us, where PA touched that line of support twice, the Cycle / Wave. The RED zones. And between these was the Trend. The over all Gain in price, over Time.
We have 3 Waves in total. The 3 ATH to ATH from 2017 to now
To further support this idea, see how PA did not come down to the Line of support between the 2017 - > 2021 ATH's
That was MID CYCLE - Strength
And so now, while we all wait for the next push up, I want to show you a zoomed, Daily version of this chart
The Current ATH we have was absolutely on the day of the END of this Fib Time cycle.
I promise you I did not "Adjust this to suit." That was the genuine result.
And I was Stunned.
And more than that, This image also very clearly shows us that Time and Room is running out for PA.
It faces the strongest lines of Support and resistance it has ever faced and these lines reach an apex in Dec.....
PA ALWAYS REACTS BEFORE THE APEX
So, What is Next ?
The chances of Bitcoin crashing to the Floor are highly unlikely unless all the corporations that have been buying BTC, decide to sell them all at the same time.
This IS a possibility ONLY if they are working with the TradFi banking organisations, that tried to Crash BTC in 2022 / 2023
OK OK, that involves ridiculous amounts of Losses for many ..so..NO
BUT PA IS GETTING SQUEEZED
And so we wait....and Wait till we see Bitcoin PA break out, Enter a Brand New Trend..a Long Term Cycle.....and we may call it Adulthood.....
Or, we will have a Story to tell our Grandchildren about a Dream of breaking Free of Banking that Came Oh so Close
I cannot wait to see what happens Next - and I am HODL
BULLUSD trade ideas

$BTC Bull Trap Clear As DayI’m probably the biggest 3-Year perma-bull on this app, and even I can tell this is most likely a bull trap.
This is either the beginning of the long awaited parabola, or else we’ll correct back down to at least the 200DMA in the next week, or the 50DMA within the next month.
Lack of volume on the move and RSI becoming overheated gives me feels for the latter
Remember, never trust a weekend pump 💯
Bookmark this.

Eyes Fresh Upside Within Ascending Channel 📈🟢 BTCUSD Eyes Fresh Upside Within Ascending Channel 🚀💰
No time to wait for the open – this dip might already be the setup! 🔍
Bitcoin continues to respect the ascending channel, with the latest touch on the lower boundary lining up perfectly with the 95,568 zone. Historically, each visit to this trendline has produced a strong bounce – and we can see it clearly through the green arrows across the chart.
As of now, price is holding just above the key support at 95,120, and unless we see a strong break below that level (with confirmation below 94,806), this looks like another textbook “buy the dip” scenario. 🛒
Upside targets remain:
🔹 97,432 – mid-channel resistance
🔹 99,161 – channel top, potential exhaustion zone
I’ll be watching for a minor pullback or consolidation (as shown), but I’m not waiting on the sidelines for the open – structure supports continuation. Don’t fight the trend when the channel is this clean. 📊
Key support levels to monitor on downside invalidation:
⚠️ 94,806
⚠️ 94,120
⚠️ 93,806
⚠️ 92,709 (channel invalidation below here)
Stick to structure, trust the levels, and respect the momentum. And if we end up under the channel remember it becomes resistance. Long ONLY over 95600 here.
One Love,
The FXPROFESSOR 💙

BITCOIN Why is this rally surprising you?Bitcoin (BTCUSD) has completed 3 straight green weeks, with an impressive last 1W candle closing and started the new one right where it left. This rise shouldn't be surprising to most as it has fulfilled all the conditions that initiated all major rallies since the November 2022 Bear market bottom.
The first week of April rebounded strongly on the 1W MA50 (blue trend-line), which as mentioned numerous times on our channel, has been this Bull Cycle's main Support and kickstarted the Q4 2023 and Q4 2024 rallies.
At the same time, the 1W RSI broke last week above its MA, which has been the final confirmation of those Bullish Legs. With the 1W Bollinger Bands (BB) still ranged, the top trend-line is expected to rise aggressively as BTC's uptrend accelerates, something that resembles October 2023 and October 2024.
Throughout this Bull Cycle, those rallies have lasted around the same time, the longest being 14 weeks. As a result, the latest the current Bullish Leg tops should be on the week of July 14 2025 and a +92% rise as February - March 2024 should deliver a test of the Higher Highs trend-line around $140000.
Do you think that's the most probable scenario? Feel free to let us know in the comments section below!
-------------------------------------------------------------------------------
** Please LIKE 👍, FOLLOW ✅, SHARE 🙌 and COMMENT ✍ if you enjoy this idea! Also share your ideas and charts in the comments section below! This is best way to keep it relevant, support us, keep the content here free and allow the idea to reach as many people as possible. **
-------------------------------------------------------------------------------
💸💸💸💸💸💸
👇 👇 👇 👇 👇 👇

BTCUSD: The catching up to Gold has started.Bitcoin is having an excellent day turning almost overbought on its 1D technical outlook (RSI = 69.867, MACD = 3107.700, ADX = 41.327) and that is normally a signal for more upside to come. Adding Gold to the mix, we see that in recent past when Gold topped, Bitcoin was at the start of its uptrend and eventually caught up to Gold. Today's rise is probably similar to early November 2024, so we expect another 1.5 - 2 month upside before the next short term pullback.
## If you like our free content follow our profile to get more daily ideas. ##
## Comments and likes are greatly appreciated. ##

It is yours to take...Back in 2024 after the early August low Bitcoin produced three weeks green. There was first a small bounce, a higher low followed by three weeks candles closing green. Today is the same. After these three weeks one last red week and then the start of major advance. Bitcoin grew from a low of $52,500 to a high of $110,000.
The rise started with the three white soldiers signal again today is the same, what will you do?
It was a rise of more than 100% and yet still not the bull market year based on the halving and past history.
Bitcoin launched 2009 four years later the first major bull market and All-Time High, we all know the story in 2013. MtGox and the rest. It continues and exactly four years later we get a new All-Time High, major growth and Bitcoin goes mainstream, everybody knows about Bitcoin now and it is 2017. It doesn't stop, it continues.
Then the market crashes the end is near and people start to quit, none of those are like me who continue to post, to publish, to fight, to persist and to win. In 2021 the story is not new already old, Bitcoin hits a new All-Time High, exactly four years later and four years after 2021 is 2025... We are already in late April and no bullish action this year, are we late?
If the August low marks the start of the current advance a new All-Time High can happen in August 2025 but no, too soon, right now there are too many Altcoins.
In November 2024 Bitcoin broke above $80,000 for the first time in its history and this is the biggest development in years from a bullish perspective. So we can take November as the starting date. If we calculate one year then the next All-Time High can happen in November 2025 are we late?
Any buy below $100,000 is still a bargain we are not late at all. The next All-Time High can happen in August, in November, in December 2025 or even in Mach 2026 that doesn't matter at all, really. What truly matters right now is to buy and hold and go LONG do you agree?
That's it. This is the opportunity that your life will change.
It is right in front of you right now, it is yours to take.
Buy Bitcoin and hold.
You will be happy with the results.
Namaste.

BTCUSD: 1H Death Cross might be dangerous but expect $100k if inBitcoin remains bullish on its 1D technical outlook (RSI = 61.614, MACD = 2557.800, ADX = 37.923) despite the correction since Friday's high. This is because the underlying pattern is a Bullish Megaphone which just bottomed. On the other hand, the 1H timeframe just formed a Death Cross. If this is invalidated and the price remains inside the Bullish Megaphone (also see that the 1H RSI is on a Bullish Divergence), we can see $100k on the next leg up (1.5 Fib extension like the 2 HH before). If the Bullish Megaphone breaks, testing the 1D MA200 at least, is veyr likely.
## If you like our free content follow our profile to get more daily ideas. ##
## Comments and likes are greatly appreciated. ##

BITCOIN's Trump effect: The 2025 PARABOLIC FINALE is coming!Bitcoin (BTCUSD) has completed 3 straight green 1W candles, making an impressive start into Q2 2025. But is it a coincidence or systemic behavior of technical trends?
It certainly is no coincidence the structure that the market has with Trump under President. Q1 has been undoubtedly disastrous due to the Trade War fueled by back and forth tariffs. But this is a pattern we've seen before and more specifically in Trump's 1st Term during Q1 2017.
As you can see, BTC was again under heavy volatility during Trump's 1st Term Q1, even though the correction wasn't as hard initially. What's more interesting however, is that in both Terms, the U.S. Dollar Index (DXY, blue trend-line) topped in Q1 and started collapsing. In 2017 that was the catalyst that fueled BTC's insane Parabolic Rally for the rest of the year.
Can the current Dollar collapse kick-start a rally for the rest of 2025? If the Trade War stabilizes, it certainly looks so. It is no coincidence that in 2017 Trump came out storming that the Dollar was too high just like he states now that the Interest Rates are too high, pressuring the Fed to cut.
So what do you think? Is the rest of 2025 destined to be as strong as 2017? Feel free to let us know in the comments section below!
-------------------------------------------------------------------------------
** Please LIKE 👍, FOLLOW ✅, SHARE 🙌 and COMMENT ✍ if you enjoy this idea! Also share your ideas and charts in the comments section below! This is best way to keep it relevant, support us, keep the content here free and allow the idea to reach as many people as possible. **
-------------------------------------------------------------------------------
💸💸💸💸💸💸
👇 👇 👇 👇 👇 👇

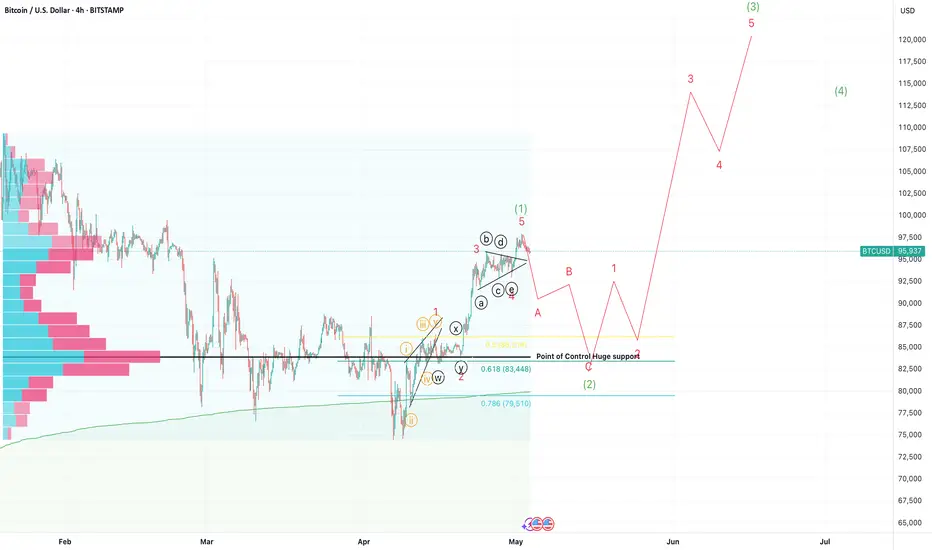
Bitcoin Short Term Top(update)Bitcoin has completed wave 1 of a bigger 5 wave move up. Expecting a correction to the $84,000 zone before a huge move up.
Bitcoin has a strong bullish momentum, could it rise further?The price is falling towards the pivot which is a pullback support and could bounce to the pullback resistance.
Pivot: 92,947.86
1st Support: 88,510.65
1st Resistance: 99,514.34
Risk Warning:
Trading Forex and CFDs carries a high level of risk to your capital and you should only trade with money you can afford to lose. Trading Forex and CFDs may not be suitable for all investors, so please ensure that you fully understand the risks involved and seek independent advice if necessary.
Disclaimer:
The above opinions given constitute general market commentary, and do not constitute the opinion or advice of IC Markets or any form of personal or investment advice.
Any opinions, news, research, analyses, prices, other information, or links to third-party sites contained on this website are provided on an "as-is" basis, are intended only to be informative, is not an advice nor a recommendation, nor research, or a record of our trading prices, or an offer of, or solicitation for a transaction in any financial instrument and thus should not be treated as such. The information provided does not involve any specific investment objectives, financial situation and needs of any specific person who may receive it. Please be aware, that past performance is not a reliable indicator of future performance and/or results. Past Performance or Forward-looking scenarios based upon the reasonable beliefs of the third-party provider are not a guarantee of future performance. Actual results may differ materially from those anticipated in forward-looking or past performance statements. IC Markets makes no representation or warranty and assumes no liability as to the accuracy or completeness of the information provided, nor any loss arising from any investment based on a recommendation, forecast or any information supplied by any third-party.

Temporal Aspect of FractalityIn this publication, I would like to bring some clarity to the series of my unconventional analysis.
At this stage of my research I have no doubt that market's natural growth patterns can be defined by historic range and power exponents of Phi. Essentially, it's just two overall fib channels that cover structural boundaries of bullruns from ATH to new ATH mapped to bottom as 3rd coordinate. When we have angle of fibs derived from chronological highs, the ratios would cover the levels of oscillation from price scale perspective.
Whereas the temporal aspect of fractality, requires looking for frequency of reversals in price dynamics. So instead of connecting pivots of same classification, we interconnect opposite points of extremes in order to tune fib direction to the angle of trend and map 3 coordinate to next swing point. This way the spacings that come with the fib proportions would indicate rhythm of trend occurrence.
The primary objective of this publication is to expose traders to the forces underlying market behavior. Specifically for illustrating temporal rhythms, the end result seen in interactive chart looks like a more simplified version of works i've shared earlier.

Sell@97500, TP 96000 - 95000 - 94000🎉 Yesterday, I accurately predicted that the price of BTC would break through 97,000! 🚀 Now, a pullback is on the horizon ⬇️. Keep an eye on the support level at 93,000! 👀
⚡⚡⚡ BTCUSD ⚡⚡⚡
🚀 Sell@97500
🚀 TP 96000 - 95000 - 94000
Accurate signals are updated every day 📈 If you encounter any problems during trading, these signals can serve as your reliable guide 🧭 Feel free to refer to them! I sincerely hope they'll be of great help to you 🌟

$97,769 and 44 cents Coinbase: BTC Genesis Fib a MAJOR barrier Shown here is a single Fib series in three different timeframes.
The "Genesis Sequence" has caught all major turns since 2015.
First fib above the Golden Genesis is likely to get a reaction.
It is PROBABLE that we "orbit" this fib a few times.
It is POSSIBLE that we Break-and-Retest to continue.
It is PLAUSIBLE that we Reject for a significant Top.
=======================================================
Previous Plots below
=======================================================
$75k Long entry:
$105k Top call
$85.3k Break entry:
=======================================================
.

BTC tries to break out of rectangle, eyes 3% rallyBitcoin is breaking out from a tight range with a potential 3% move to 98,500, but it needs to gain momentum fast to avoid a false breakout.
This content is not directed to residents of the EU or UK. Any opinions, news, research, analyses, prices or other information contained on this website is provided as general market commentary and does not constitute investment advice. ThinkMarkets will not accept liability for any loss or damage including, without limitation, to any loss of profit which may arise directly or indirectly from use of or reliance on such information.

Watching for 88.5-89KMorning folks,
So, upside spike has happened and our 3-Drive + butterfly patterns are done. Although we haven't got continuation to 98K area that also was on a table.
Now short-term sentiment has changed. Recent data shows that the Fed doesn't need to hurry up with rate cut, yields turns up, so BTC also could follow the common tendency with deeper retracement.
This is the reason why we do not consider any longs today. As a nearest area that might be reached we consider 88.5-89K support.
So, for bulls it is nothing to do. If you're intraday trader, you could consider bearish positions from predefined Fib levels on the picture. 3-Drive hasn't reached its target yet, so 92.5-93K area still could be reached...

BTCUSD bullish momentum continuesBTCUSD bullish momentum continues. It may retrace for a while before uptrend continues.

BITCOIN Will Keep Growing! Buy!
Hello,Traders!
BITCOIN is trading in an
Uptrend an the coin made
A bullish breakout of the
Key horizontal level of 94k$
Which is now a support and
Is now going up again so we
Are bullish biased and we will
Be expecting a further
Bullish continuation
Buy!
Comment and subscribe to help us grow!
Check out other forecasts below too!
Disclosure: I am part of Trade Nation's Influencer program and receive a monthly fee for using their TradingView charts in my analysis.

In - depth Analysis of BTC: Can the 97,000 Target be Achieved?96000: This is the resistance level near the upper trend - line of the current ascending wedge. The price has tested this area several times but failed to break through effectively, indicating strong selling pressure at this level 💥.
⚡⚡⚡ BTCUSD ⚡⚡⚡
🚀 Buy@92000 - 93000
🚀 TP 95000 - 96000 - 97000
Accurate signals are updated every day 📈 If you encounter any problems during trading, these signals can serve as your reliable guide 🧭 Feel free to refer to them! I sincerely hope they'll be of great help to you 🌟

BITCOIN (BTCUSD): Strong Bullish Signs?! ₿
Bitcoin has probably completed the accumulation
stage after a completion of a strong bullish wave a week ago.
I see a breakout of a resistance line of a symmetrical triangle
on a daily time frame.
It is an important sign of strength of the buyers.
The price may continue going up now and reach 98.180 level.
❤️Please, support my work with like, thank you!❤️

a bull trap?A bull trap in trading refers to a situation where a stock or other asset appears to be breaking out upwards, attracting buyers (thinking it's going to continue rising), but then the price reverses and starts to fall. Essentially, it's a false signal of an upward trend, tricking traders into thinking it's safe to buy, only for the price to drop soon after.
Here’s how it typically works:
Upward Movement: The asset experiences a strong price movement to the upside, making it look like a breakout.
Fake Confirmation: Traders interpret this as a signal that the asset is starting a new bullish trend, so they jump in to buy.
Sudden Reversal: After a short period of gains, the price reverses direction and starts to drop, trapping the traders who bought in.
Losses: The traders who entered during the "trap" are now stuck with losses, as they bought at the higher price and the asset's value starts to fall.
Bull traps are a danger to traders who rely on technical indicators or breakouts without confirming broader market conditions. It's important to wait for confirmation signals before jumping in on a trade, as bull traps can lead to significant losses if not recognized early.
Watch out zone this support zone if the price of bitcoin can hold abot 92589 we can see that the price of Bitcoin is bullish
breaking down this area we may see retest down to 85k level

SELL BTCUSD for bullish trend reversal STOP LOSS : 97,861SELL BTCUSD for bullish trend reversal
STOP LOSS : 97,861

BTC at Key Inflection Zone – Breakout or Rejection Ahead?Asset: BTC/USD
Timeframe: 4H or Daily (based on visual pattern structure)
As of: May 6, 2025
Indicators:
50 EMA (Red): $91,615.79
200 EMA (Blue): $89,305.75
Key Technical Zones:
🔴 Resistance Zone: ~$104,000 – $108,000
This area has historically acted as a major supply zone.
Price has been rejected from this level multiple times, indicating strong selling pressure.
🔁 Flip Zone (Resistance turned Support/Support turned Resistance): ~$95,500 – $100,000
The current price ($95,234.23) is testing this zone from below.
A confirmed break and hold above could signal continuation toward the higher resistance.
🟢 Strong Support Zone: ~$88,000 – $91,000
Confluence of 50 EMA and 200 EMA adds strength to this demand zone.
Previous breakout level and accumulation area.
EMA Outlook:
50 EMA > 200 EMA: Short-term bullish crossover is active, indicating bullish momentum.
Both EMAs are sloping upward slightly, suggesting trend strengthening.
Price is currently above both EMAs, which acts as dynamic support.
Potential Scenarios:
✅ Bullish Scenario:
If price reclaims the $95,500–$100,000 resistance-turned-support zone:
Expect upward momentum to continue.
Target: $104,000–$108,000 zone.
Break of $108K could lead to a macro bull continuation.
⚠️ Bearish Scenario:
If price rejects the current zone and fails to hold above the $91,000 support:
Look for retest of $88,000–$89,000 area (confluence with EMAs).
Breakdown below that zone would invalidate bullish structure and signal potential deeper correction.
Summary:
Bias: Bullish above $91K, Neutral between FWB:88K –$91K, Bearish below $88K.
Key Confirmation Needed: Daily close above $100,000 for strong bullish continuation.
Risk Management: Watch for fakeouts within the $95K–$100K range due to past volatility.

98+ actionMorning folks,
So, market mostly stands at the same place where we leave it last time :)
But now our monthly bullish pattern is officially confirmed, so mid term direction is up with 110K target at least and potential progress up to 127K.
Now we see a lot of minor bullish signs pointing on upside breakout attempt. Last time we talked about 3-Drive, but today it seems that it could go out of its limits. Not just to 97K but up to 103 K AB-CD upside target.
Until price is above 91.5K lows we do not consider any shorts. Following expected downside pullback is still on the table but not for this week probably. We return to it later as soon as upside action will be over.
