SPY/QQQ Plan Your Trade For 4-28 : Inside Breakaway In TRENDToday's Inside Breakaway pattern in Trend mode suggests the SPY will attempt to break away from Friday's body range. The Weekly Bias turned to BULLISH last week.
I believe today's price move will be indicative of the rest of the week. We are moving into a very strong Major CRUSH pattern on Friday and I believe that pattern will be a big breakdown move in price.
Thus, I believe the early trading this week (today and tomorrow) will set the tone for the rest of the week.
If we see a rotation in price near the 550 level (to the downside) then my May Low pattern will likely transition into a price breakdown this week.
If we see more upside price action on Monday/Tuesday, then I would be very cautious of the end of this week as a sudden price breakdown may happen.
Gold and Silver will likely stay very muted for the next two trading days. The Canadian Elections will likely cause the US to briefly pause as one of our closest neighbors and trading partners moves through this pivotal election.
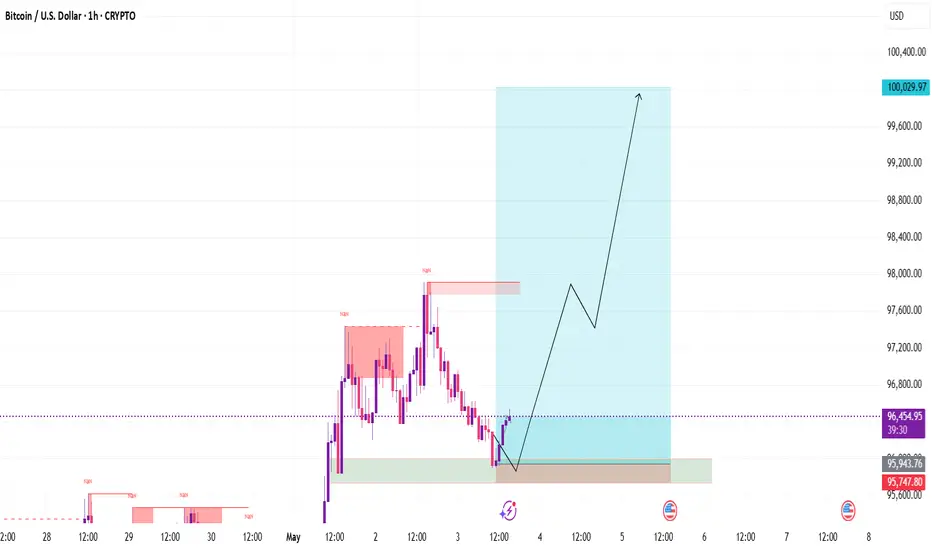
Bitcoin will also likely pause a bit in early trading this week and BTCUSD moves up to the $95-96k upper resistance area.
I suggest traders take advantage of this pause in price action to HEDGE their open positions. I believe the bigger move is still to the downside, but I also believe the markets could continue to push a bit higher before ROLLING into that May 2-5 Major Bottom.
At this point, near the 50% Fib retracement level, the markets could break in either direction. But I still believe the May 2-5 Major Bottom will play out as a unique lower low price level - below $525-530 on the SPY.
Get some.
#trading #research #investing #tradingalgos #tradingsignals #cycles #fibonacci #elliotwave #modelingsystems #stocks #bitcoin #btcusd #cryptos #spy #gold #nq #investing #trading #spytrading #spymarket #tradingmarket #stockmarket #silver
BULLUSD trade ideas

BTCUSD is in an ascending triangleBTCUSD has been consolidating for the entire week within this ascending triangle, showing bullish pressure. However, I believe that this is just a trap considering current economical events. People are still flocking to gold as a safe haven as cryptocurrency has yet to establish itself amongst the older audiences. Hence, we may see the ascending triangle fail. The setup will be invalidated if the resistance up top is breached.
Please do not risk more than 1% per trade!
If you like the idea, please help like the post and comment down your thoughts below! I would love to hear your thoughts!

Highlighted in green between approximately $96,500 and $97,050.a 1-hour chart of Bitcoin (BTC/USD) on the BITSTAMP exchange. Here’s a breakdown of the chart:
Current Price: Around $96,479.
Sell Zone: Highlighted in green between approximately $96,500 and $97,050. This is likely a resistance zone where the trader expects selling pressure.
Red Zone Below: Represents the expected price drop area, indicating a bearish outlook.
Price Action: The chart shows a sharp move up into the Sell Zone, followed by a small pullback, and then a projected drop.
Target Zone: Around $93,242, with an extended potential drop to $91,572, indicated by the arrow.
Support Zone: The yellow rectangle near $93,200 is a key support area where price might stabilize or bounce.
This chart suggests a short (sell) trade setup, anticipating a reversal from the current high back toward support levels.

Bitcoin, ATHs test on the Horizon.Niiiiiiiice, After a nice run up from the Weekly and Daily pov confirming a test to the ATHs is on the horizon.
Now that we have the EMAs in sync with price is TIME for a retrace to test the 55ema (orange line) and then bounce to continue higher.
Even if price drops to the $84k line the UPtrend will still intact.
Buckle up ladies and gentlemen ATHs and above is on the horizon.

Bitcoin at a Crossroads: Breakout Imminent, Orders in PlaceBitcoin continues to consolidate between 93,500 and 95,900.
Typically, the longer an asset consolidates, the stronger the breakout that follows.
There are two possible outcomes , and I won’t even try to guess which one will play out—but I do have a feeling that the odds slightly favor an upward move . To be clear, this isn’t analysis, nor is it based on chart patterns or some kind of insight—just my personal opinion. And I’m not going to trade based on that intuition. Why? Because I’d rather miss the very beginning of a move and enter with more confidence and lower risk.
📝 Trading plan:
1. Go long on a breakout above 96,000 with a target of 109,000.
2. Go short on a breakdown below 92,900 with a target of 74,500.
This sideways structure will inevitably end in a strong move. My orders are set—I’m ready.

BTC Breakout: Symmetrical Triangle Formation Near Key Resistance Bitcoin highlights a symmetrical triangle pattern forming just below a descending trendline and key resistance zone around $96,000–$96,600. The price action is consolidating within narrowing support and resistance lines, suggesting a potential breakout. A bullish breakout above the red trendline and consolidation above $96,000 could lead to a strong upward move toward the resistance zone. Traders should watch for volume confirmation and breakout retest opportunities for optimal entry points.

BTC Traders: Buy the Dip or Wait for the Break?Bitcoin broke out of its range, hit 97K, and is now consolidating near key resistance at 99K. Traders are watching for either a bullish breakout or a dip to buy. Watch the video to learn more.
This content is not directed to residents of the EU or UK. Any opinions, news, research, analyses, prices or other information contained on this website is provided as general market commentary and does not constitute investment advice. ThinkMarkets will not accept liability for any loss or damage including, without limitation, to any loss of profit which may arise directly or indirectly from use of or reliance on such information.

Bitcoin (BTC): Looking For Re-Test of $92,000Weekends were pretty bloody, where we had a strong sell-off on the markets, but yet we did not see the proper re-test of the local resistance zone (which is still the resistance and now proper support zone).
We are looking for the price to decline back towards the GETTEX:92K , where we will be looking either for further downward movement or upward movement.
We set both sell and buy entry zones for us so let's wait now
Swallow Academy

April 30 Bitcoin Bybit chart analysisHello
It's a Bitcoinguide.
If you have a "follower"
You can receive comment notifications on real-time travel routes and major sections.
If my analysis is helpful,
Please would like one booster button at the bottom.
Here is the Bitcoin 30-minute chart.
There will be two Nasdaq indicator announcements at 9:30 and 11:00.
On the lower left, I marked the long position entry section that I entered on the 25th and 29th,
and created today's strategy based on the Nasdaq movement.
*Red finger movement path
Long position strategy
1. 94,698.2 dollar long position entry section / cut-off price when the green support line is broken
2. 95,784 dollar long position 1st target -> Good 2nd target
The 1st and 2nd sections at the top are sideways.
After the 1st touch, in the rising wave, if you enter a 94.6K long position,
the probability of the strategy succeeding increases.
If it comes down right away without touching the 1st section,
The final long position is waiting in the 2nd section, and the stop loss price is the same when the green support line is broken.
When the top section is touched, the long position re-entry utilization section and
I left a simulation with a pink finger on the upper right.
The bottom touch is a downward sideways movement
The 3rd section is the 6+12 support line where the mid-term pattern is restored.
Also, tomorrow is Labor Day,
So all countries around the world, including the US, are closed.
I also have work to do, so I will take a day off tomorrow.
I intentionally left the analysis article on the right until May 2nd.
Up to this point, please just refer to and use my analysis article,
And I hope you operate safely with the principle trading and stop loss price.
Thank you.

Two must-have charts to anticipate the altcoin seasonIntroduction: The bitcoin price has rebounded strongly since the beginning of April, against the backdrop of the trade diplomacy sequence between the USA and its main trading partners, confirmed US disinflation and a strong rebound in global M2 liquidity. On this subject of the positive correlation between the bitcoin price and global liquidity, we invite you to reread our previous analyses (in the list of analyses related to our new article of the day).
The price of BTC in US dollars has thus bounced back from US$74,000 to over US$95,000, the bullish cycle linked to the Spring 2024 halving has been relaunched, so could an altcoin season get underway in the coming weeks?
To answer this question, we suggest you keep a close eye on two key barometers: the ratio between altcoins and bitcoin, and bitcoin dominance.
1) The ratio between altcoin depth and bitcoin price
The basic principle of a mathematical ratio is as follows: if the curve is bullish, then the numerator is outperforming, and if the curve is bearish, then the denominator is outperforming (and vice versa). On the chart below, you can see a graphical analysis of the OTHERS/BITCOIN ratio, i.e. the ratio between altcoins above the top 10 in terms of market capitalization and the bitcoin price.
A bullish reversal in this ratio is needed to see the onset of an altcoin season, i.e. a market phase in which altcoins perform relatively better than BTC, which is quite rare in the current cycle. At this stage, the ratio is stabilizing in contact with a long-term uptrend line, and a potential bullish divergence is present. But there is no bullish signal yet. Until this ratio validates a bullish reversal, there is no altcoin season.
2) The underlying dynamics of bitcoin's dominance of the crypto market
Bitcoin's dominance represents the relative weight of BTC within the total market capitalization of the crypto market. The last true altcoin season dates back to the previous cycle, with BTC's dominance plummeting in the first part of 2021. There is no altcoin season as long as BTC's dominance remains on an upward trend.
Conclusion: While BTC's bullish cycle remains intact for the year 2025, altcoins remain on the back foot for the time being. We invite you to keep a close eye on the two barometers presented above, as they are the early indicators of a possible new altcoin season.
DISCLAIMER:
This content is intended for individuals who are familiar with financial markets and instruments and is for information purposes only. The presented idea (including market commentary, market data and observations) is not a work product of any research department of Swissquote or its affiliates. This material is intended to highlight market action and does not constitute investment, legal or tax advice. If you are a retail investor or lack experience in trading complex financial products, it is advisable to seek professional advice from licensed advisor before making any financial decisions.
This content is not intended to manipulate the market or encourage any specific financial behavior.
Swissquote makes no representation or warranty as to the quality, completeness, accuracy, comprehensiveness or non-infringement of such content. The views expressed are those of the consultant and are provided for educational purposes only. Any information provided relating to a product or market should not be construed as recommending an investment strategy or transaction. Past performance is not a guarantee of future results.
Swissquote and its employees and representatives shall in no event be held liable for any damages or losses arising directly or indirectly from decisions made on the basis of this content.
The use of any third-party brands or trademarks is for information only and does not imply endorsement by Swissquote, or that the trademark owner has authorised Swissquote to promote its products or services.
Swissquote is the marketing brand for the activities of Swissquote Bank Ltd (Switzerland) regulated by FINMA, Swissquote Capital Markets Limited regulated by CySEC (Cyprus), Swissquote Bank Europe SA (Luxembourg) regulated by the CSSF, Swissquote Ltd (UK) regulated by the FCA, Swissquote Financial Services (Malta) Ltd regulated by the Malta Financial Services Authority, Swissquote MEA Ltd. (UAE) regulated by the Dubai Financial Services Authority, Swissquote Pte Ltd (Singapore) regulated by the Monetary Authority of Singapore, Swissquote Asia Limited (Hong Kong) licensed by the Hong Kong Securities and Futures Commission (SFC) and Swissquote South Africa (Pty) Ltd supervised by the FSCA.
Products and services of Swissquote are only intended for those permitted to receive them under local law.
All investments carry a degree of risk. The risk of loss in trading or holding financial instruments can be substantial. The value of financial instruments, including but not limited to stocks, bonds, cryptocurrencies, and other assets, can fluctuate both upwards and downwards. There is a significant risk of financial loss when buying, selling, holding, staking, or investing in these instruments. SQBE makes no recommendations regarding any specific investment, transaction, or the use of any particular investment strategy.
CFDs are complex instruments and come with a high risk of losing money rapidly due to leverage. The vast majority of retail client accounts suffer capital losses when trading in CFDs. You should consider whether you understand how CFDs work and whether you can afford to take the high risk of losing your money.
Digital Assets are unregulated in most countries and consumer protection rules may not apply. As highly volatile speculative investments, Digital Assets are not suitable for investors without a high-risk tolerance. Make sure you understand each Digital Asset before you trade.
Cryptocurrencies are not considered legal tender in some jurisdictions and are subject to regulatory uncertainties.
The use of Internet-based systems can involve high risks, including, but not limited to, fraud, cyber-attacks, network and communication failures, as well as identity theft and phishing attacks related to crypto-assets.

BITCOIN UPDATELooking good....looking good. Bitcoin holding very good so far. Bitcoin just completed its first stage on the 4hrs retrace move . Knowing where the 4 hrs is heading we can forecast the 1hr tf next move for the next 2 to 3 days and its as shown on the 1hr chart. Once we have the 1hr tf cycle completed we will have the 4hrs tf cycle getting ready to re-take its UPtrend, and once it re-takes its UPtrend move and by the time the 4hrs tf cycle is mid-way up then the Daily will joint them to push prices to new highs and that will be around the 9th or the 12th and as long as price doesn't cross below its Zero Line. Place your bets ladies and gentlemen and buckle up cause we are heading for a wild ride.

Bitcoin - The Bottom Is In!Bitcoin ( CRYPTO:BTCUSD ) is reversing right now:
Click chart above to see the detailed analysis👆🏻
It was really just a matter of time until Bitcoin actually manages to create a potential short term and longer term bottom. With this monthly candle, bulls are taking over again and starting to buy cryptos quite heavily. The chart just tells us that this is not the end, but rather the continuation.
Levels to watch: $70.000, $300.000
Keep your long term vision,
Philip (BasicTrading)

BTCUSD Long setup price BTCUSD Long setup price tapped into H-4 There are two targets 9 8000 and 1,00,000 1% risk #forextrader #forex #btc
Bitcoin Struggles at the $95,000 BarrierIn today’s session, BTC has once again posted a decline of over 2%, as the previous bullish bias struggles to break through the $95,000 resistance level. The neutrality forming on the chart around this zone reflects the uncertainty in market sentiment, which is also evident in the Crypto Fear and Greed Index, currently oscillating in the neutral range at 45 points. The market appears to be watching closely for developments in the trade war and the Federal Reserve's interest rate decision on Wednesday before resuming the buying pressure that has driven BTC in recent weeks.
Short-Term Bullish Trend
Since April 9, a sustained bullish trend has been forming in BTC’s price, until momentum stalled near the $95,000 resistance zone. Prolonged price neutrality around this level may begin to slow the upward momentum that had been developing and lead to a consolidation phase. However, the long-term outlook still shows a clear dominance of buying interest.
Technical Indicators:
RSI: The RSI line approached the overbought zone near the 70 level, but has since begun to trend downward, suggesting that the recent buying momentum is weakening. This opens the door for potential short-term bearish corrections.
MACD: The MACD histogram is slowly approaching the zero line, which may indicate a balance of forces in the market. Furthermore, if a crossover between the MACD line and the signal line occurs in the short term, it could be interpreted as the start of a sustained bearish momentum that may affect upward price movements.
Key Levels to Watch:
$95,000 – Major Resistance: The most relevant resistance level for BTC, aligned with the 61.8% Fibonacci retracement. A breakout above this zone could confirm the strength of buying interest and pave the way for a more extended bullish trend.
$90,000 – Nearby Support: This level aligns with neutral consolidation areas from previous sessions and could serve as a short-term support in the face of potential pullbacks.
$86,500 – Key Support: This level is marked by the 50-period simple moving average. A drop to this level could break the short-term bullish structure and extend bearish momentum.
Written by Julian Pineda, CFA – Market Analyst

BTCUSD SIGNAL UPDATE READ THE CAPTAINBtcusd signal technical analysis satup 👇🏼
( Btcusd ) Buy zone
( TRADE SATUP)
ENTRY POINT (94700) to (94600) 📊
FIRST TP (95100)📊
2ND TARGET (95700) 📊
LAST TARGET (96300) 📊
STOP LOOS (94000)❌
FALLOW RISK MANAGEMENT ✅

BITCOIN Support Ahead! Buy!
Hello,Traders!
BITCOIN is trading in an
Uptrend but is making a
Local bearish correction
However, a horizontal
Support level is ahead
Around 92,191$ so after
The retest we will be expecting
A local bullish rebound
And a move up
Buy!
Comment and subscribe to help us grow!
Check out other forecasts below too!
Disclosure: I am part of Trade Nation's Influencer program and receive a monthly fee for using their TradingView charts in my analysis.

Bitcoin H4 | Potential bullish bounceBitcoin (BTC/USD) is falling towards a swing-low support and could potentially bounce off this level to climb higher.
Buy entry is at 91,933.60 which is a swing-low support that aligns close to the 23.6% Fibonacci retracement.
Stop loss is at 87,400.00 which is a level that lies underneath a pullback support.
Take profit is at 99,342.60 which is a swing-high resistance.
High Risk Investment Warning
Trading Forex/CFDs on margin carries a high level of risk and may not be suitable for all investors. Leverage can work against you.
Stratos Markets Limited (tradu.com):
CFDs are complex instruments and come with a high risk of losing money rapidly due to leverage. 63% of retail investor accounts lose money when trading CFDs with this provider. You should consider whether you understand how CFDs work and whether you can afford to take the high risk of losing your money.
Stratos Europe Ltd (tradu.com):
CFDs are complex instruments and come with a high risk of losing money rapidly due to leverage. 63% of retail investor accounts lose money when trading CFDs with this provider. You should consider whether you understand how CFDs work and whether you can afford to take the high risk of losing your money.
Stratos Global LLC (tradu.com):
Losses can exceed deposits.
Please be advised that the information presented on TradingView is provided to Tradu (‘Company’, ‘we’) by a third-party provider (‘TFA Global Pte Ltd’). Please be reminded that you are solely responsible for the trading decisions on your account. There is a very high degree of risk involved in trading. Any information and/or content is intended entirely for research, educational and informational purposes only and does not constitute investment or consultation advice or investment strategy. The information is not tailored to the investment needs of any specific person and therefore does not involve a consideration of any of the investment objectives, financial situation or needs of any viewer that may receive it. Kindly also note that past performance is not a reliable indicator of future results. Actual results may differ materially from those anticipated in forward-looking or past performance statements. We assume no liability as to the accuracy or completeness of any of the information and/or content provided herein and the Company cannot be held responsible for any omission, mistake nor for any loss or damage including without limitation to any loss of profit which may arise from reliance on any information supplied by TFA Global Pte Ltd.
The speaker(s) is neither an employee, agent nor representative of Tradu and is therefore acting independently. The opinions given are their own, constitute general market commentary, and do not constitute the opinion or advice of Tradu or any form of personal or investment advice. Tradu neither endorses nor guarantees offerings of third-party speakers, nor is Tradu responsible for the content, veracity or opinions of third-party speakers, presenters or participants.

BTC/USD) Trend channel analysis setup Read The ChaptianSMC Trading point update
technical analysis of Bitcoin (BTC/USD) on the 1-hour timeframe. It showcases a potential breakout continuation vs. pullback scenario, depending on how price reacts around a key short-term resistance area.
---
Key Observations:
1. Current Price:
$93,754 — Price is consolidating just below a local high.
2. Support and Resistance Zones:
Support BOS (Break of Structure): Around the $87,351 level, highlighted in yellow.
Upper Target Zone: $98,954–$98,983
200 EMA: Near $86,926, offering dynamic support.
3. Two Possible Scenarios:
A. Bullish Continuation:
If the price holds above the immediate structure and breaks out of the short-term consolidation near the top:
It may surge toward the upper target zone ($98,983).
This aligns with the ascending channel and continuation pattern.
B. Bearish Pullback:
If the price fails to sustain above the resistance area:
A correction down to the support BOS zone (~$87,351) is likely.
This pullback may be temporary, potentially offering a re-entry zone for bulls.
4. RSI Analysis (Bottom of Chart):
RSI is showing signs of bearish divergence (price making higher highs while RSI makes lower highs).
This suggests momentum is weakening, and a short-term pullback could occur.
---
Trade Ideas:
Long Setup (Breakout):
Entry: Above recent high (~$94,500).
Target: ~$98,950
Stop Loss: Below ~$92,000
Short Setup (Rejection):
Entry: Rejection near ~$94,000–$94,500
Target: ~$87,350
Stop Loss: Above ~$94,800
Mr SMC Trading point
---
Summary:
This analysis reflects a critical decision point for BTC/USD. Price is nearing a local high with RSI divergence suggesting a pullback may come first — but if buyers remain strong and break resistance, a continuation toward GETTEX:98K is likely. Wait for confirmation of direction before entering.
Pales support boost 🚀 analysis follow)

Btcusd rebound? Btcusd has raised its local peak to 97,900, and while
the market structure is generally favorable, it is
still reliant on the S&P 500's performance and
fundamental background.
The improvement in the US tariff situation and
the relationship with China are the main factors
that contributed to the development. As the
SP500 index, with which Bitcoin has a fairly
good connection, increased, so did Bitcoin's
growth. The price broke out of the two-week
consolidation in the second half of this week,
upgrading the local maximum and breaking
over the 95,500 resistance level. It is producing
a correction in the local upward channel.
The liquidity and risk zone is 95,000. In other
words, Bitcoin will keep rising in the near and
medium term if the bulls maintain their defense
above 95K throughout the retest. If not, a 95K
pause might cause a decline to 92K-88K.
The 95.5K support level, below which a sizable
liquidity pool has developed, is the focus of all
attention. A retest (false breakout of support)
and an imbalance of market forces can both
impact growth. However, since the market will
respond to economic data, we must exercise
caution. However! The inability to continue
growing and a return of prices to the selling
zone (below 95000 to 95500) may lead to a
correction and liquidation.

Bitcoin Trading RangesBitcoin trading ranges can be very useful in assessing what Bitcoin will do next.

BITCOIN - April ReviewIt's a make or break for Bitcoin right about now guys.....
Either we see all-time highs booked at $109,000 or we see capitulation to $73,000 and lower! Right about now, I can't seem to make a confident decision on whether Bitcoin will gravitate lower into lower timeframe PD arrays before targeting ATH or if a news event occurs plummeting the price in a heartbeat down to record levels.
You think $40,000 is not possible??

FIRST TP DONEAS I WAS SAYING FIRST TARGET AT 1H 100SMA IS DONE. Waiting for the price to reach our 2h 100SMA line and then we are going to wait to hit our 4H 100SMA.

Say hello to the $110k Bitcoin !The BTC will increase $15K and reach to the top of the wedge in the coming weeks .
Give me some energy !!
✨We spend hours finding potential opportunities and writing useful ideas, we would be happy if you support us.
Best regards CobraVanguard.💚
_ _ _ _ __ _ _ _ _ _ _ _ _ _ _ _ _ _ _ _ _ _ _ _ _ _ _ _ _ _ _ _
✅Thank you, and for more ideas, hit ❤️Like❤️ and 🌟Follow🌟!
⚠️Things can change...
The markets are always changing and even with all these signals, the market changes tend to be strong and fast!!
