BTC LONG TP:99,500 03-05-2025🚀 Continuation in motion!
We’re going LONG toward 99,500, with the 2H timeframe showing clear bullish continuation 📈
Entry zone sits between 95,500 and 94,200 — solid range to average in smart.
This move should play out within 17 to 30 hours, so precision matters ⏳
We’re seeing acceleration in bullish momentum, and this could be the final spike pushing BTC to 107–108k in the coming week.
Don’t miss the ride. Follow me for updates and let’s lock in those gains together 💰🔥
BULLUSD trade ideas

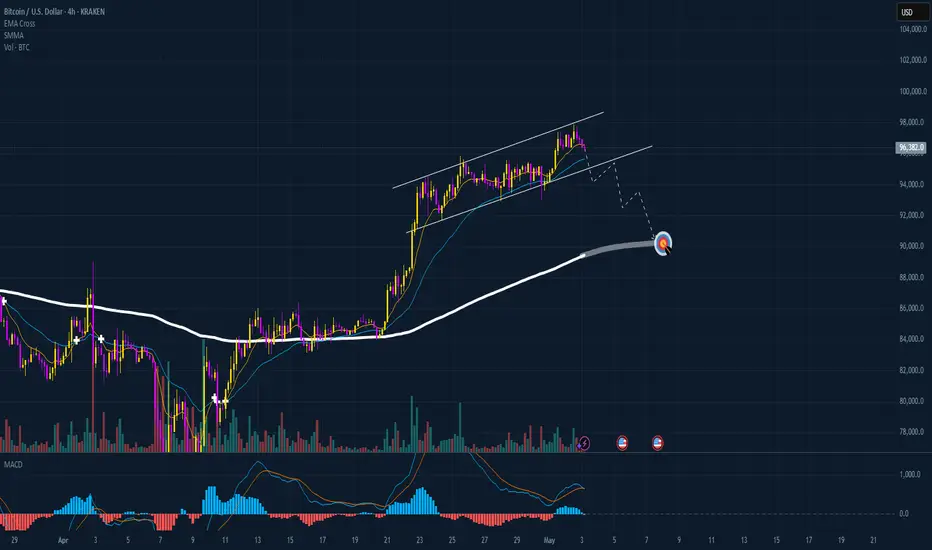
BTC HAVE A HIGH PROBABILITY TO FALL DOWN!!!The BTC starts looking weak and it's perfect time to long for a short. We are almost at the top of this run from last weeks and we can see that BTC made a perfect divergence pattern. My indicator shows me also that we are entering a mid-term bearish trend and there is a high chance that we are gonna fall much deeper than in last weeks. My target is clear and I'm holding my strategy so I wait for the price to hit my SMA line like it was in the last days but now I wait for the price to hit the SMA line at 4H chart because we didn't hit it since 2 weeks so in this moment we can see even in a few candles that the price is gonna touch it. I am actually in the short and waiting for the price to go for my target, we also have a weekend so the price will be probably slow but everything can happen. In my opinion next week are gonna be red and the price should touch my target. I recommend to watch a 1H and 2H chart and looking when price will hit the SMA line on these timeframes because my target is set in a 4H chart but we can book profits even when the price will hit the SMA at 1H and at 2H chart. Be careful and stay focused.
Bitcoin Bulls Break Free — Smart Money Sets Sights on $125K
BTCUSD has pushed above its downtrend resistance and is now consolidating just above the $95,000 zone — a key level of breakout and retest. The setup is supported by COT data pointing to long-term bullish positioning:
82.9% of non-commercial traders are net long (as of April 27)
Institutions added 2,411 long contracts the week prior
Short positions are decreasing and net positions improving over time
Technicals + smart money alignment = potential for sustained upside momentum.
Target: $125,299
Stop Loss Zone: Below $90,759
Key Confirmation Level: Daily close above $96,000

BTC/USD...1d chart pattern..BITCOIN TARGET
**Key Levels:**
- **Support:** $92,000 (critical buy zone)
- **Targets:** $99,000 (TP1) → $107,000 (TP2)
**Chart Pattern (1D):**
Likely forming a **bullish continuation pattern** (e.g., flag, pennant, or ascending triangle) if price holds above $92k. Confirmation requires a breakout with volume.
**Technical Indicators to Watch:**
1. **RSI (14):** Should stay above 50 (bullish momentum).
2. **Moving Averages:** Price above 50/200 EMA supports uptrend.
3. **Volume:** Increasing volume on breakout reinforces validity.
**Risk Management:**
- **Stop-Loss:** Below $92,000 (e.g., $90,500-91,000).
- **Risk-Reward:** ~1:2+ (92k→99k = +7k vs. 92k→90.5k = -1.5k).
**Conclusion:**
Valid setup if Bitcoin holds GETTEX:92K support. Target $99k first, then $107k. Monitor for rejection at support or breakout confirmation.
*(Always cross-validate with fundamentals like ETF inflows/halving dynamics.)*
Would you like a specific indicator analysis (e.g., MACD, Fibonacci)?

The decisive day of major data (BTCUSD)Yesterday, it was mentioned that the expectation of continuing to buy after a retracement of 96k was completely correct. Followers also made good profits.
BTCUSD bulls are still strong. The retracement is mainly long trading, which needs to be paid attention to at present. 96k/95k are both good buying opportunities.
TP98K-100K

BTC w/ Power Law FractalAs previously shown, this adds the fractal interval from Oct '23 through Mar '24. Pico top would arrive Sep-Oct around 200k. Hopefully this comes true and is a conservative estimation.

Bitcoin INSIDE SchemeFib channel config of uptrend fractal starting from 2020.
Testing QM principle of uncertainty of (upward and downward) spin of particle and relating it to the condition of the market where nobody can tell if the price goes up or down, thus we have similar setting of uncertainty with fib channels of upward and downward directions. Either way market goes, the price action will always react to the fib lines.
Hence, the levels where the fib lines cross produce set of probabilities. This will always be the backbone of my further works.
Scheme can be used to compare your targets and determine if they are justified by the laws of golden ratio.
Based on outcome of graph below:

BTCUSD Possible Move May 6th 2025🔻 BTC/USD – SHORT SIGNAL & ANALYSIS
📉 Signal:
Sell BTC/USD below 94,000 after a confirmed break and retest of the ascending trendline.
Target: 93,000 liquidity zone
Stop Loss: Above 94,400 (or structure high after retest)
Risk/Reward: Approx. 1:2+
📊 Analysis:
Price has been in a descending channel, followed by a corrective structure forming higher lows.
Currently testing a rising trendline, suggesting weakening bullish momentum.
Clean liquidity pool rests around 93,000, likely to be targeted if structure breaks.
Expected flow:
Break below 94,000 trendline
Retest the trendline as resistance
Continuation to 93,000 demand/imbalance area
🧠 Trade Idea Summary:
This setup aligns with bearish market structure and liquidity concepts. A breakdown from the trendline would confirm bearish intent, with 93,000 as the next logical draw on price.

BTC-M2 FractalFriends, I keep returning to the Oct '23-Mar '24 interval. I do not know why, but there was little ceiling resistance. If it were to echo starting April '25 x6 months (late Sep - early Oct) we'd see BTC achieve a normal cycle with a pico top around 200k. This Summer should be FUNNN!

BTCUSD – 5M Premium Zone Rejection | Short Setup Activated🧩 BTCUSD – 5-Minute Breakdown | May 4, 2025
The BoS has happened, but don’t let it fool you — price just entered the danger zone. This is where Smart Money loves to trap late longs and send price tumbling.
🧠 SMC Playbook:
🔨 BoS Identified: Minor bullish BoS after initial reaction from the previous low.
🟥 Supply Zone (Entry Area): 79%–100% retracement zone from the latest swing high to low.
🔄 Reversal Point: Entry just above the 79% zone (95,499–95,629).
🎯 Target: Weak Low = 95,200
🧼 Stop-Loss: Above 95,629 (structure invalidation)
📏 RR Ratio Potential: 1:3 to 1:4+
🔎 Narrative:
Price is engineered to grab liquidity before making the real move. The Strong High acts as protection — Smart Money is defending this area. Once the premium fills, we expect a clean breakdown back into the discount zone.
📊 Key Observations:
❌ Buyers are likely trapped.
📍OB tapped + Fibonacci 79–100% = High confluence.
💥 Expecting liquidity sweep → sharp sell-off.
⏰ Execution timeframe = M1/M5 confirmation (engulfing, CHoCH, etc.)
📣 How to Trade It:
Monitor price action inside red zone (79–100%).
Wait for lower timeframe confirmation (e.g. bearish engulfing, M1 CHoCH).
Short from ~95,500 with SL above 95,630.
TP at Weak Low → potential extension to 94,800 if momentum kicks in.
🧠 Chart Ninja Tip:
“Don’t chase price — trap it. Let price come to you and confirm. The premium zone is where trades go from good to god-tier.”
💬 Drop a 🧠 if you’re watching this level too.
📈 Save this chart for your next sniper entry.
🔁 Share it with your SMC crew and ride the liquidity wave!

BTC/USD Analysis – Strong Demand Zone Breakout or Reversal Chart Timeframe: 15 Min
Indicators Used: LuxAlgo Supply & Demand, Visible Range Volume Profile
Current Price: $95,554
Support Zone: $95,631 - Key demand zone (highlighted in orange)
Resistance Levels: $96,786 and $97,727
---
Analysis:
Bitcoin is currently sitting right at a high-volume demand zone ($95,631), which has acted as strong support recently. Price is testing this level aggressively.
Two possible scenarios are in play:
1. Bullish Reversal:
If bulls defend this zone, we could see a bounce back toward $96,786, and possibly a retest of the $97,727 supply zone. This area aligns with previous sell pressure and high volume, making it a solid take-profit zone for long scalpers.
2. Bearish Breakdown:
A clean break and candle close below the orange demand zone may signal further downside, with the next logical support not shown on this chart (could be referenced in a follow-up post). Look for high-volume confirmation on the breakdown.
---
Trade Idea:
Long Entry: On bullish confirmation (e.g., bullish engulfing or demand hold at $95,631)
Target 1: $96,786
Target 2: $97,727
Stop Loss: Below $95,400 (depending on risk tolerance)
Bias: Neutral – waiting for confirmation
Market Reaction: Watch how price behaves in the next 2-3 candles at this key zone.

BITCOIN Is Bullish! Buy!
Please, check our technical outlook for BITCOIN.
Time Frame: 2h
Current Trend: Bullish
Sentiment: Oversold (based on 7-period RSI)
Forecast: Bullish
The price is testing a key support 96,975.97.
Current market trend & oversold RSI makes me think that buyers will push the price. I will anticipate a bullish movement at least to 99,781.42 level.
P.S
Overbought describes a period of time where there has been a significant and consistent upward move in price over a period of time without much pullback.
Disclosure: I am part of Trade Nation's Influencer program and receive a monthly fee for using their TradingView charts in my analysis.
Like and subscribe and comment my ideas if you enjoy them!

Summary of the Bitcoin Market This WeekThis week, the Bitcoin market showed a trend of steady increase and broke through the key resistance level.👉👉👉
Technically, the MACD indicator on the daily chart shows a strong bullish signal, and the price has also held above the key moving average, confirming the short - to medium - term upward trend. Overall, market sentiment is relatively optimistic, and investors' expectations for it to break through the psychological barrier of $100,000 have increased. However, when Bitcoin approaches the $98,000 level, it may form a short - term resistance, and as the price gets closer to the $100,000 mark, the overly optimistic market sentiment also increases the risk of a pullback.
The better than expected performance of the US job market has alleviated recession concerns, boosted the sentiment of risky assets, and provided support for Bitcoin. Meanwhile, the signs of easing in US - China trade relations have had a positive impact on the global financial markets, including the cryptocurrency market.
This week, the Bitcoin market has performed strongly driven by various factors. Both on-chain data and market indicators have shown positive signals. However, during the process of price increase, it's also necessary to pay attention to the potential risk of a pullback.

TARGET SUCCESSFUL
This chart displays a successful bullish breakout on Bitcoin (BTC/USD) from the previous consolidation range.
Key Levels & Zones:
-Resistance Zone: Around 95,576, which was clearly broken with strong bullish momentum.
Support Level: Maintained around 93,592, where price previously bounced from.
Fair Value Gap (FVG): Efficiently filled, providing the base for the bullish rally.
Target Achieved: The price decisively hit and exceeded the projected target of 95.576, confirming the bullish setup.
Market Sentiment: Strong bullish bias with volume surge, indicating continued interest above resistance.
Conclusion: The breakout and target completion validate the strength of the structure and buyer control in this range. Further bullish continuation could be expected if momentum sustains.

BTCUSD Long Setup – Trading Within Ascending ChannelBitcoin is currently trading within a well-defined ascending channel on the 1-hour chart. Price recently bounced off the lower boundary of the channel and is showing signs of bullish continuation.
Entry: Around 94,400
Stop Loss: 94,250
Take Profit: 95,642
The price action shows a clear upward channel with consistently higher highs and higher lows. After the recent pullback, BTC respected the lower trendline support and formed a potential base for a new bullish leg.
Risk is well-contained below recent structure
As long as BTC remains inside the channel, upside potential remains valid
This is a simple trend-following setup with tight risk and clear upside structure.

Bitcoin (BTC/USD) Analysis – 1H
🏛 1. Current Market Structure
📉 Price is currently moving within a small ascending channel after rejecting the red zone (IFVG 1D), but this move might be a bear trap.
⚠️ A downside breakout is likely, aiming to sweep liquidity lower.
🌍 2. Bigger Picture Outlook
🔍 The market could drop toward the grey support zone (below $91,500) before a potential bullish recovery.
📅 Overall structure remains dependent on a key macro catalyst, particularly Jerome Powell's upcoming speech.
🔍 3. Key Technical Observations
🟥 IFVG 1D: Clean rejection from this zone, increasing selling pressure.
📉 Suspicious ascending channel: Often a corrective pattern before continuation downward.
🟩 FVG 1D below: A potential liquidity zone, likely to trigger a reaction if tested.
🎯 4. Short-Term Expectations
📉 Favored bearish scenario:
Channel breakdown
Liquidity sweep
Retest of the grey support area (~$91,000)
📈 Bullish reaction possible afterwards, depending on how price behaves at support and macro conditions.
🔥 5. Upcoming Catalysts
🕰 Powell’s speech on Wednesday: Highly anticipated by the market.
💸 A rate cut could support BTC, but short-term uncertainty keeps pressure on price.
🔎 Until then, expect high volatility as the market seeks clarity.
✅ Conclusion
👉 Current price action suggests a bear trap with a likely liquidity grab to the downside.
📍 Key levels to watch:
Grey support zone (~$91,000)
Green FVG 1D (~$89,000)
Market reaction post-FOMC
⏳ Until the FED decision, the market remains fragile and liquidity-driven.

BTC SHORT TERM FOLLOW UP BE SURE TO BUY AT 89-91k"Last alert for the dip — this is a follow-up to my initial analysis on the short-term period."

Bitcoin Confirms Breakout — Bullish Trend Gains StrengthStair-Stepping Uptrend:
Bitcoin has confirmed a breakout above the critical $88,000–$90,000 resistance zone, forming a classic pattern of higher lows and higher highs. This technical structure signals a decisive shift in market sentiment.
Momentum Builds:
The breakout marks a clear resurgence in bullish momentum after months of consolidation following January’s highs. It suggests that the market is regaining strength and preparing for a sustained move upward.
Key Support Level:
As long as Bitcoin holds above $92,000, the bullish structure remains valid. This level now acts as a critical threshold for traders to manage risk and assess continuation.
Outlook:
With the trend now clearly favoring the bulls, Bitcoin is well-positioned for further upside in the near term. Continued strength could open the door to retesting previous all-time highs and potentially reaching new ones.
#Bitcoin #BTC #Crypto #Breakout #TechnicalAnalysis #BullishTrend #CryptoMarket #SupportAndResistance #MarketUpdate #PriceAction

BITCOIN FALLING WEDGE BREAKOUT Bitcoin just popped out of a textbook bullish continuation pattern, 3+ touches on each trend line + Breakout candle confirmed. Pro traders now watch for confirmation to manage risk.
Will BTC follow through?
🚀If your bullish!!
📝If your watching closely!!

BTC updateAs seen here BTC broke 96K up.
But, the Level 96400 has not. 96400, like it was said in previous chart is very significant!
Let's is IF we still above (on closing basis) that Level!
Notice:
Total Crypto - the Levell of 3-3.03T has not been broken (yet).
Will keep you posted!

Bitcoin H4 | Falling toward a swing-low supportBitcoin (BTC/USD) is falling towards a swing-low support and could potentially bounce off this level to climb higher.
Buy entry is at 91,933.60 which is a swing-low support.
Stop loss is at 87,400.00 which is a level that lies underneath a pullback support and the 38.2% Fibonacci retracement.
Take profit is at 99,342.60 which is a swing-high resistance.
High Risk Investment Warning
Trading Forex/CFDs on margin carries a high level of risk and may not be suitable for all investors. Leverage can work against you.
Stratos Markets Limited (tradu.com):
CFDs are complex instruments and come with a high risk of losing money rapidly due to leverage. 63% of retail investor accounts lose money when trading CFDs with this provider. You should consider whether you understand how CFDs work and whether you can afford to take the high risk of losing your money.
Stratos Europe Ltd (tradu.com):
CFDs are complex instruments and come with a high risk of losing money rapidly due to leverage. 63% of retail investor accounts lose money when trading CFDs with this provider. You should consider whether you understand how CFDs work and whether you can afford to take the high risk of losing your money.
Stratos Global LLC (tradu.com):
Losses can exceed deposits.
Please be advised that the information presented on TradingView is provided to Tradu (‘Company’, ‘we’) by a third-party provider (‘TFA Global Pte Ltd’). Please be reminded that you are solely responsible for the trading decisions on your account. There is a very high degree of risk involved in trading. Any information and/or content is intended entirely for research, educational and informational purposes only and does not constitute investment or consultation advice or investment strategy. The information is not tailored to the investment needs of any specific person and therefore does not involve a consideration of any of the investment objectives, financial situation or needs of any viewer that may receive it. Kindly also note that past performance is not a reliable indicator of future results. Actual results may differ materially from those anticipated in forward-looking or past performance statements. We assume no liability as to the accuracy or completeness of any of the information and/or content provided herein and the Company cannot be held responsible for any omission, mistake nor for any loss or damage including without limitation to any loss of profit which may arise from reliance on any information supplied by TFA Global Pte Ltd.
The speaker(s) is neither an employee, agent nor representative of Tradu and is therefore acting independently. The opinions given are their own, constitute general market commentary, and do not constitute the opinion or advice of Tradu or any form of personal or investment advice. Tradu neither endorses nor guarantees offerings of third-party speakers, nor is Tradu responsible for the content, veracity or opinions of third-party speakers, presenters or participants.

Is growth over? What to expect next for Bitcoin ?In this idea I marked the important levels for this week and considered a few scenarios of price performance
Important support will be at 90k, the price may show a local rebound from the level before showing further decline within the correction
Write a comment with your coins & hit the like button and I will make an analysis for you
The author's opinion may differ from yours,
Consider your risks.
Wish you successful trades! MURA

Bitcoin short Bitcoin short from 97k.
A nice little retest is located at that region.
Trying to catch a nice short .
