Is BTCUSD heading Toward 74800 ?Recently BTCUSD broken Trendline on 4H,
Next We might see 84500-84000 levels, if price able to break that level then we might see 75000 level
Comment down your view
BULLUSD trade ideas


Potential Pullback and ContinuationBitcoin has entered a pullback phase within the current uptrend, and the continuation of the trend is expected following this correction

Are We Witnessing A WHALE Diving Expedition?Get ready to buckle up and prepare for an exhilarating ride, because the Bitcoin seas are getting choppy!
Whispers are circulating,
theories are bubbling, and everyone's glued to their screens as we potentially witness something HUGE:
Bitcoin whales might be prepping for a deep-sea dive, potentially pulling the price down from a hypothetical high of 96,000 to the depths of 66,000 and even $55,000...
and Whales might be taking their sweet, strategic time about it!

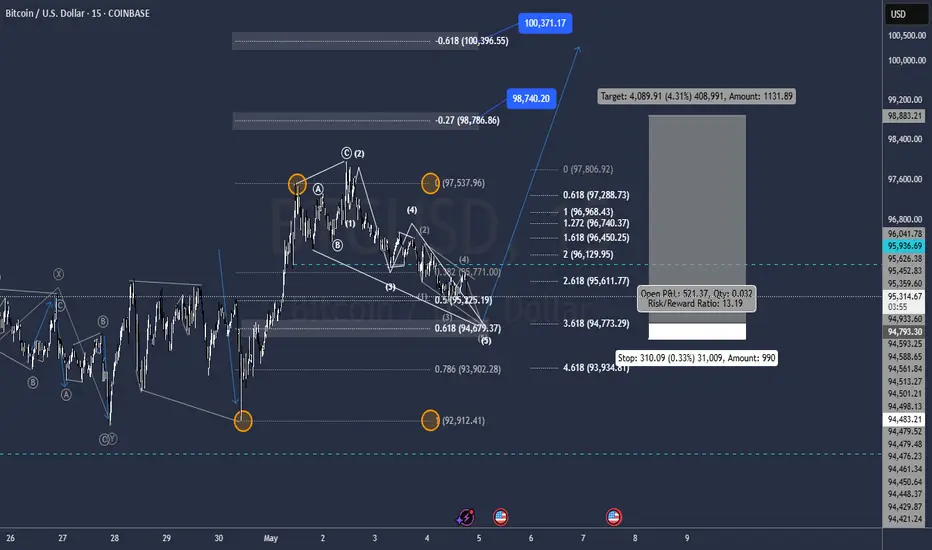
To be or not to be, that is the question..... BTC/USD Bitcoin Elliott Wave Projection – 4H Timeframe Analysis
This 4-hour BTC/USD chart applies Elliott Wave Theory to outline a potential bullish continuation scenario, balanced with a corrective alternative. The chart currently identifies a completed 5-wave impulse move from the recent bottom, followed by a likely ABC corrective structure forming.
Key Elements:
• Primary Impulse (Blue Waves 1-5): A five-wave bullish sequence appears to have played out from early April to early May, suggesting the completion of Wave (1) of a larger degree bullish cycle.
• Corrective Wave (ABC in Yellow): After the peak of Wave (5), an ABC correction is expected, retracing into the Fibonacci support zones. Highlighted levels include the 0.382 ($89,958), 0.5 ($87,286), and 0.618 ($84,713) retracement levels.
• Accumulation/Order Block Zones: Two key green demand zones are marked between $86,997 and $75,322, with heavy interest shown in the golden pocket region for potential re-entries (0.618-0.65 zone).
• Bullish Continuation Scenario: After the corrective ABC structure completes, a new five-wave impulsive rally is projected—this would form Wave (3) of a higher-degree cycle, with sub-waves (1)-(5) plotted in blue, potentially pushing BTC toward the $140,000 range.
• Bearish Alternative (Red Arrow): A red arrow suggests the alternate scenario—if price fails to hold the Fibonacci support or green demand zones, a deeper decline could ensue, invalidating the bullish wave count.
Technical Indicators:
• Moving Averages: The chart includes a 50-period EMA (red) and a longer-term MA (white), showing a bullish crossover.
• Order Block Detector (LuxAlgo): Supports the chart’s high-confluence buy zones.

"Bitcoin - Stop loss level $92381.77"In continuation with yesterday's update,
"#Bitcoin, there is a possibility that $94239.50 may act as support otherwise $92381.77 should work as a stop loss. If it breaks, then we may see the further downside levels as $90523.64, $88665.50, $86575.25 and $84485.00.",
Now, I have added the upside levels as well.
Mid-point: $94239.50
Stop loss: $92381.77
Upside: $97962.33, $99813.50, $101903.75 and $103994.00
Downside: $90523.64, $88665.50, $86575.25 and $84485.00
#BTCUSD
#BitcoinResistance
#CryptoAnalysis
#ChartAnalysis

Long trade
📘 Trade Journal Entry — BTCUSD (Buy Side)
🗓 Date: Sunday, 4th May 2025
⏰ Time: 9:45 AM
📍 Session: London to New York Overlap (AM)
🪙 Pair: BTC/USD
📈 Direction: Long (Buy Side)
🔹 Entry Details:
Entry Price: 95,393.59
Take Profit: 95,745.20 (+0.37%)
Stop Loss: 95,316.08 (−0.08%)
Risk-Reward Ratio: 4.54
🔹 Trade Context:
Entered during the high-volume overlap between London and New York sessions — a prime window for large institutional moves.

?BTC Intraday LongsTechnical analysis using ICT concepts.
A rally below the 12 am NY opening price to raid sell stops below previous day's Asian & London session.
CISD from a Bullish orderblock formed on Thursday NY am session.
Looking for Buy stops resting above Friday's highs.
* Note A 4hour BISI is below the reference range that could still be revisited.

Tue 6th May 2025 BTC/USD Daily Forex Chart Sell SetupGood morning fellow traders. On my Daily Forex charts using the High Probability & Divergence trading methods from my books, I have identified a new trade setup this morning. As usual, you can read my notes on the chart for my thoughts on this setup. The trade being a BTC/USD Sell. Enjoy the day all. Cheers. Jim

A buy setup for Bitcoin BTCUSD on a daily chartAfter clearing 94316 resistance, a short term trading opportunity in BTCUSD. High probability set up for first profit take level. Second PT is 1 to 1 RR.


BTC CONSOLIDATESBringing back the old chart to revisit levels we’ve had mapped for months.
Bitcoin is consolidating just below resistance after a massive breakout – currently hovering around $94K. The price is holding above the $91,271 level, which was previously a major zone of resistance and now appears to be acting as support. The 50-day moving average has turned upward and is accelerating, while the 200-day remains supportive below.
Each horizontal line on this chart represents an area of interest rather than precise support or resistance. Still, price action has respected these zones with near-perfect precision.
As long as BTC holds this $91K region, the structure remains bullish. A break below that would suggest a deeper retest, but for now, dips continue to be bought.

BTCUSDHello trader, this week the bitcoin possible price action.. the price is currently filled the 1hr fvg and it could go bullish but still have high risk since day candle is bearish... the next price it can reverse from is around 88k after filling daily fvg... and if dollar get stronger then price can continue to 74k... weekly candle is still bullish though however anything can happen if bullish liquidity drops.. chart is just based on Fvg and the MACD
good luck

New Bitcoin ATH Incoming? Key Bullish Signals & Decoupling AnalyBitcoin at the Precipice: Analyzing the Confluence of Bullish Signals, Decoupling Dynamics, and the Looming Question of a New All-Time High
The cryptocurrency market, and Bitcoin in particular, exists in a perpetual state of flux, analysis, and fervent speculation. In recent weeks and months, a compelling narrative has begun to coalesce, woven from disparate threads of technical indicators, on-chain data, market dynamics, and historical parallels. Bitcoin, after a period of consolidation and correction, appears to be sending signals that have historically preceded significant upward movements. Analysts are pointing to specific indicators flashing green, a potential local bottom seems confirmed, and intriguing shifts are occurring in mining difficulty and Bitcoin's relationship with the wider altcoin market. All this culminates in the tantalizing question echoing across trading desks and social media: Is a new Bitcoin All-Time High (ATH) incoming, perhaps even within the next year?
This article delves deep into the multifaceted factors fueling this speculation. We will dissect the analyst flags suggesting a major rally, examine the evidence for a confirmed local bottom, explore the significant decoupling of Bitcoin from altcoins, analyze the implications of the shifting mining difficulty, evaluate the compelling comparison to Gold's historical breakout, and assess the technical picture presented by indicators like the Stochastic RSI and Taker Buy/Sell ratio. By synthesizing these elements, we aim to provide a comprehensive overview of the forces currently shaping Bitcoin's trajectory and the arguments underpinning the bullish outlook for a potential new ATH, possibly targeting Q2 2025.
Part 1: Reading the Tea Leaves – Indicators Flagging a Potential Rally
Experienced market analysts often rely on a combination of technical and on-chain indicators to gauge market sentiment and predict future price movements. Recently, several reports have highlighted specific indicators whose current state mirrors conditions observed just before previous major Bitcoin bull runs. While the exact proprietary indicators used by every analyst vary, common themes emerge:
• On-Chain Metrics: These look at the activity happening directly on the Bitcoin blockchain. Key metrics often cited include:
o Supply Dynamics: Tracking the amount of Bitcoin held by long-term holders versus short-term speculators. An increase in long-term holding often suggests accumulation and reduced selling pressure. Metrics like "Supply Last Active 1+ Years Ago" reaching high levels can indicate strong conviction among holders.
o Network Activity: While not always a direct price predictor, sustained growth in active addresses or transaction counts can signal underlying adoption and utility growth.
o Profit/Loss Indicators: Metrics like Net Unrealized Profit/Loss (NUPL) or Spent Output Profit Ratio (SOPR) help gauge whether the market is overheated or potentially finding a bottom. A shift from capitulation (heavy losses) towards profitability can be a bullish sign.
• Technical Indicators: These are derived from price and volume data.
o Moving Averages: Crossovers of key moving averages (e.g., the 50-day moving average crossing above the 200-day moving average, known as a "Golden Cross") are classic bullish signals for many traders. The positioning of price relative to these averages is also crucial.
o Momentum Oscillators: Indicators like the Relative Strength Index (RSI) and the Moving Average Convergence Divergence (MACD) measure the speed and change of price movements. Emerging from oversold conditions or showing bullish divergences can signal strengthening momentum.
• Market Sentiment Indicators: While harder to quantify, tools analyzing social media sentiment, futures market positioning (funding rates, open interest), and options market data (put/call ratios) can provide clues about the prevailing mood among traders.
The core argument presented by analysts is that a confluence of these diverse indicators, many of which have strong historical track records in predicting Bitcoin rallies, are simultaneously aligning in a bullish formation. It's not just one signal, but a pattern across multiple datasets suggesting that the groundwork for a significant upward move is being laid. This historical resonance provides a powerful argument for those anticipating a break towards previous highs.
Part 2: The Confirmed Local Bottom – Building a Foundation for Growth?
Complementing the forward-looking indicators is the assertion that Bitcoin has successfully established a "local bottom." This implies that a recent period of price decline has concluded, and a new support level has been found from which price can potentially rebound. Confirmation of a bottom is often a multi-step process:
1. Price Action: A clear cessation of the downtrend, often marked by a specific low point that holds despite retests. This might involve candlestick patterns indicating reversal (like hammers or engulfing patterns) or the formation of a sideways consolidation range after a fall.
2. Volume: Capitulation volume (a spike in selling volume near the low) followed by declining volume during consolidation, and then potentially increasing volume on upward moves, can support the idea of a bottom.
3. Indicator Confirmation: Technical indicators like the RSI moving out of oversold territory (<30) or MACD showing a bullish crossover below the zero line often accompany bottom formations.
4. Holding Key Support: The price successfully defending a significant historical support level or a key Fibonacci retracement level adds weight to the bottoming argument.
The claim that "all indicators flash bullish" in conjunction with a confirmed local bottom suggests a powerful technical setup. It implies that the selling pressure that drove the price down has exhausted itself, buyers are stepping back in at these levels, and multiple technical measures are signaling renewed upward momentum. Establishing a firm bottom is crucial; without it, any rally attempt could be short-lived. This confirmed base provides psychological reassurance to bulls and a defined level for risk management (placing stop-losses below the confirmed low). The question then shifts from "Will it stop falling?" to "Where is the price headed next?"
Part 3: The Great Crypto Decoupling – Bitcoin Forges Its Own Path
One of the most significant market structure shifts observed over the past year is the growing divergence between Bitcoin and the broader altcoin market. Historically, Bitcoin often acted as the tide lifting all crypto boats; when Bitcoin rallied, altcoins typically followed, often with even greater percentage gains (and vice-versa). However, recent data points to a stark change:
• Record Market Cap Gap: The difference in total market capitalization between Bitcoin and the entire altcoin sector has reportedly reached its largest point ever. This signifies that capital inflows are disproportionately favoring Bitcoin.
• Performance Divergence: While Bitcoin has made significant strides, reclaiming substantial portions of its previous losses and challenging key resistance levels, many altcoins have lagged considerably. Some have even continued to trend downwards relative to both the US Dollar and Bitcoin itself.
• Shift from Tandem Movement: The lockstep correlation that characterized previous cycles appears broken, or at least significantly weakened. Bitcoin is charting a course influenced more by its own specific drivers than by the general sentiment across the entire crypto asset class.
•
Several factors likely contribute to this decoupling:
• Institutional Adoption & ETFs: The launch and success of spot Bitcoin ETFs in the US (and similar products elsewhere) have provided a regulated, accessible channel for institutional capital to flow directly into Bitcoin. This capital is often focused solely on Bitcoin as a digital store of value or portfolio diversifier, largely ignoring the more speculative altcoin market.
• Narrative Strength: Bitcoin's core narrative as "digital gold" – a decentralized, scarce, censorship-resistant store of value – has gained traction, particularly in environments of macroeconomic uncertainty or inflation concerns. This narrative is unique to Bitcoin and doesn't necessarily extend to most altcoins, which often have different value propositions (utility tokens, DeFi platforms, etc.).
• Regulatory Clarity (Relative): While regulatory landscapes are still evolving globally, Bitcoin generally enjoys a greater degree of regulatory clarity (often classified as a commodity in key jurisdictions like the US) compared to many altcoins, which face ongoing scrutiny regarding their potential classification as securities. This perceived lower regulatory risk can make Bitcoin more attractive to cautious investors.
• Flight to Quality: During periods of market uncertainty or following negative events within the broader crypto space (like exchange collapses or protocol exploits), investors may rotate capital from riskier altcoins into the perceived safety and established network effect of Bitcoin.
•
This decoupling has profound implications. For investors, it means diversification within the crypto space is becoming more complex; owning altcoins is no longer a guaranteed way to amplify Bitcoin's gains. For Bitcoin, it suggests a maturation of its asset class status, attracting capital based on its unique properties rather than just general crypto market sentiment. This potentially makes Bitcoin's price action more robust and less susceptible to negative developments in obscure corners of the altcoin market.
Part 4: Mining Difficulty Adjustment – A Breather for the Network's Backbone
The Bitcoin network's health and security rely on miners who dedicate vast computational power to validating transactions and adding new blocks to the blockchain. The "Difficulty" is a crucial network parameter that automatically adjusts roughly every two weeks (every 2016 blocks) to ensure that new blocks are found, on average, every 10 minutes, regardless of how much total mining power (hash rate) is connected to the network.
• How it Works: If blocks are being found too quickly (more hash rate online), the difficulty increases, making it harder to find the next block. If blocks are being found too slowly (hash rate has dropped), the difficulty decreases, making it easier.
• Recent Trend: The report notes that difficulty had increased in the four previous adjustments, indicating a sustained rise in the total hash rate competing on the network.
• Expected Drop: Now, on-chain data forecasts an almost 5% drop in difficulty for the upcoming adjustment. This implies that a noticeable amount of hash rate has recently come offline.
•
Why might hash rate decrease, leading to a difficulty drop?
• Profitability Squeeze: Mining profitability is determined by the price of Bitcoin, the miner's electricity costs, the efficiency of their mining hardware (ASICs), and the current network difficulty. If Bitcoin's price stagnates or drops while difficulty remains high (or energy costs rise), less efficient miners or those with higher operating costs may become unprofitable and shut down their rigs.
• Hardware Cycles: Older generation ASICs become obsolete as newer, more efficient models are released. A difficulty drop might reflect a temporary lull before newer hardware is fully deployed or older hardware being permanently retired.
• External Factors: Regional energy price fluctuations, regulatory changes affecting mining operations in certain areas, or even extreme weather events impacting large mining facilities can temporarily reduce the global hash rate.
What are the implications of a difficulty drop?
• A Break for Miners: For the remaining miners, a lower difficulty means they have a slightly higher chance of finding the next block with the same amount of hash power. This can improve their profitability, potentially reducing the need for them to sell mined Bitcoin immediately to cover operational expenses. Reduced selling pressure from miners is generally considered a positive market factor.
• Network Self-Regulation: It demonstrates the robustness of Bitcoin's design – the network automatically adjusts to maintain its target block time, ensuring consistent transaction processing regardless of fluctuations in mining participation.
• Not Necessarily Bearish: While a significant drop could signal miner capitulation in a deep bear market, a moderate drop after a period of sustained increases might simply be a healthy cooldown or consolidation phase in hash rate growth, allowing the ecosystem to adjust.
This expected difficulty drop, therefore, provides a welcome respite for miners, potentially easing selling pressure and showcasing the network's adaptive capabilities.
Part 5: Technical Signals and Historical Echoes – Stochastic RSI, Taker Ratio, and the Gold Fractal
Beyond the broader indicators and market dynamics, specific technical signals and historical chart patterns are adding fuel to the bullish fire:
• Bitcoin Stochastic RSI: The Stochastic RSI is a momentum indicator that uses RSI values (rather than price) within a stochastic oscillator formula. It ranges between 0 and 100 and is used to identify overbought and oversold conditions, but often more effectively in identifying strengthening momentum. A signal suggesting "brewing bullish momentum" likely means the Stochastic RSI is rising from oversold levels or showing a bullish crossover, indicating that underlying momentum (as measured by RSI) is accelerating upwards. Such signals often precede periods of strong price appreciation.
• Taker Buy/Sell Ratio (Binance): This ratio measures the aggression of buyers versus sellers executing market orders (takers) on a specific exchange (in this case, Binance, a major hub for crypto trading). A "sharp increase" in the Taker Buy Ratio (or Buy/Sell Ratio) signifies that buyers are aggressively hitting the ask price to acquire Bitcoin, willing to pay the market price rather than waiting for their limit orders to be filled. This indicates strong immediate demand and buying pressure, often interpreted as a bullish signal suggesting conviction among buyers.
• Bitcoin Mirroring Gold's Breakout Structure: This is a fascinating observation based on fractal analysis – the idea that chart patterns can repeat themselves across different time scales and different assets. The claim is that Bitcoin's current price structure (consolidation patterns, corrections, subsequent recovery) closely resembles the structure Gold exhibited before one of its major historical breakouts. If this fractal pattern holds true, it suggests Bitcoin might be in the final stages of consolidation before a significant upward move, mirroring Gold's past trajectory. This analysis leads to the specific, albeit highly speculative, prediction of a potential new ATH occurring in Q2 2025. While historical parallels are not guarantees, they provide a compelling narrative and roadmap for traders looking for historical context.
• Sandwiched Between Support & Resistance: This describes the immediate technical battleground. Bitcoin's price is currently caught in a range defined by a significant support level below (a price floor where buying interest has previously emerged) and a major resistance level above (a price ceiling where selling pressure has previously intensified). The outcome of this battle is critical. Can the bulls, bolstered by the positive indicators and dynamics discussed, muster enough strength to break decisively above resistance? Or will the bears successfully defend that level, potentially leading to another rejection or further consolidation? This price zone represents the current line in the sand.
Part 6: Synthesis and Outlook – Weighing the Evidence for a New ATH
Synthesizing these diverse factors paints a complex but potentially bullish picture for Bitcoin:
• The Bullish Case: Multiple historically reliable indicators are signaling conditions that preceded past rallies. A local bottom appears confirmed, providing a stable base. Bitcoin is increasingly decoupling from the riskier altcoin market, potentially attracting more focused institutional capital via ETFs. A looming drop in mining difficulty could ease selling pressure from miners. Specific technical indicators like the Stochastic RSI and Taker Buy/Sell Ratio point towards growing buying momentum and aggression. Furthermore, a compelling (though speculative) historical parallel with Gold's breakout structure offers a potential roadmap towards a new ATH, perhaps by Q2 2025.
• The Hurdles and Risks: Despite the bullish signals, significant resistance levels lie ahead, representing areas where sellers have previously overwhelmed buyers. Macroeconomic uncertainty (inflation, interest rates, geopolitical events) can always impact risk assets like Bitcoin. Regulatory developments, while potentially clarifying for Bitcoin, remain a source of potential volatility. The crypto market is inherently volatile, and unforeseen events ("black swans") can rapidly alter market sentiment. The Gold fractal is a historical observation, not a guarantee.
Conclusion:
Bitcoin currently stands at a fascinating juncture. The confluence of bullish indicators flagged by analysts, the apparent confirmation of a local bottom, the significant decoupling from altcoins driven partly by institutional flows, the potential easing of pressure on miners via a difficulty drop, and specific technical signals like the Stochastic RSI and Taker Buy Ratio collectively build a strong case for optimism. The comparison to Gold's historical breakout adds another layer of intrigue, offering a specific (though speculative) timeline for a potential new All-Time High.
However, optimism must be tempered with caution. Major resistance levels loom large, representing the immediate challenge for bulls. The broader macroeconomic and regulatory environments remain key variables. While the indicators suggest brewing momentum and historical patterns offer encouraging parallels, breaking through established resistance and embarking on a sustained rally towards a new ATH is never a certainty in the volatile world of cryptocurrency.
The coming weeks and months will be crucial in determining whether the bullish signals translate into decisive price action. Can the bulls overcome the resistance that currently sandwiches the price? Will the decoupling trend continue to funnel capital into Bitcoin? Will the mining landscape stabilize favorably? The answers to these questions will likely determine if the whispers of an incoming ATH, potentially mirroring Gold's path towards Q2 2025, become a roar or fade back into the market noise. The stage seems set, the indicators are aligning, but the final act is yet to be written.

BITCOIN INCOMING MOVES Hello Traders
As i can Bitcoin is trying to break 97K$ which seems hard i am expecting a drop rill design levels if not break 97K$ and then it shoot if market break and Close above 97K$ on weekly chart then it a possibility to break previous ATH and make a new ATH till desing levels Share ur thoughts with us we appriciate ur comments and support presonally i am selling from this zone with a very small SL 97300 and MY TPs showing inchart make a proper research before taking any trade
Stay Tuned for more updates ......

BUY BTCUSD ScalpI am buying BTCUSD 96000, lets try this for a short scalp. This is my personal bias, practice at your own. No any financial advise just for learning purpose.

BTC/USD - Rejection Incoming? Key Supply Zone Hit – Watch These Bitcoin just tagged a major supply zone around $96,600, showing early signs of exhaustion after a clean breakout above $95,192.
What’s on the Chart?
Supply Zone (Blue Box): Price has entered a previous rejection area.
Demand Zone (Orange Box): Strong bullish reaction earlier from $93,800 - $94,200.
Breakout Point: $95,192 acted as resistance turned support.
What Traders Are Watching:
Rejection Candles: If this 15-min candle closes as a wick or reversal pattern, we might see a short-term pullback.
Bearish Confirmation: Below $95,200 opens room back to the orange demand zone.
Continuation Scenario: Clean breakout above $96,700 could lead to explosive move toward $97,500+.
Potential Trade Idea (for reference):
Short Entry: $96,500–$96,600
Stop Loss: Above $96,800
Target: $95,200 / $94,000
This could be a great opportunity for short-term scalpers or traders using LuxAlgo zones as dynamic S&D references.
---
#BTCUSD #Bitcoin #CryptoTrading #LuxAlgo #SupplyAndDemand #PriceAction #Scalping #CryptoAnalysis #TradingStrategy

BREAKING NEWS - India launches missile attack on Pakistan
🚨MartyBoots here , I have been trading for 17 years and sharing my thoughts on btc here..
🚨
BTC is a geopolitical asset
BTCUSD at Key Supply Zone — Will Bears Take Over?Bitcoin is currently trading at $94,670, sitting just below a major supply zone on the 1-hour chart. Price has tested this region multiple times but failed to break higher — a potential sign of weakness setting in.
Key Technical Zones:
Supply Zone (Resistance): $94,500 - $95,250
Multiple rejections in this zone. Watch for bearish engulfing or lower highs forming.
First Support: $85,759
A key level where price previously consolidated before the last breakout.
Major Demand Zone: $75,800 - $76,000
Strong bullish reaction in the past. If price dumps, this is the most likely bounce zone.
What’s Happening?
Bulls are losing momentum at the top of the range.
LuxAlgo’s Visible Range confirms high-volume resistance above.
Possible scenario: Break below $85,759 could accelerate a drop to $76K.
My Outlook:
Leaning bearish unless BTC breaks above $95,250 with strength and volume. A rejection could provide a nice short opportunity down to $85K and possibly $76K.
---
Will BTC break out or is a correction incoming?
Comment your outlook and follow for more clean technical breakdowns!

Is it A Good Time To Buy Bitcoin?Is it a good time to buy Bitcoin based on its extension from the 200W moving average.


THE BITTY go down....to 91,000...just as I thought.
With an upward channel flagging a soon decline, it finally broke at the 95,000 mark to it predicted fail to remain in the channel walls. We should soon hit 91,500 as seen by the arrow and should bounce back up.

Bircoin correction should End @ 94.800Correction About to Complete Wave 5 for Expnding Flat Correction
Matching .618 Retracement and 3.618 wave 1 of C Expansion to the pip @ 94.800.
Targets @ 98.750/ 100.350 And Further