$ARKK is reversing higherAMEX:ARKK now needs a break above 45 for an extension higher after the long-term falling trend line break. Invalidation of the upside extension can only come if we see a break below 40
ARKK trade ideas

ARKK looking like a botommI might be late, but not too late.
ARKK has been flirting with the PoC from the top and forming some kind of complex inverse head and shoulders.
Innovation and growth have taken a hit in a big way over the last year and a half, but this is looking like an opp. to bid on innovative growth returning at some point.
I'm skeptical of Cathie's leadership in this etf, but the chart setup looks appealing.

Oh Cathy, My CathyI miss Robin Williams' brilliance.
200-500 daily so long as Cathy can hold above 39. Targets as marked. Stop say trailing 2.00.

ARK Innovation Support Area to Watch for BounceHi Guys! This is a Technical Analysis on ARK Innovations ETF (ARKK) on the 1 Week Timeframe.
Jumping right in:
Our current Price action is currently bouncing off a Confluence of SUPPORT Test
We tested this Confluence of Support area the prior 2 weeks.
The Confluence involves:
1. 50 SMA
2. Support Line of the Uptrend Channel
This would make an area to go LONG.
We are currently in the process of testing RESISTANCE from 21 EMA
Since this is one the 1 Week timeframe, we need to observe how this weeks candle interacts with the 21 EMA.
If we can close ABOVE, at the end of the week. That would be a good sign.
NOTE: If we can confirm SUPPORT on 21 EMA, this is a bullish sign. Since UPTRENDS are associated with being ABOVE the 21 EMA
It would hint at or strengthen the probability we move towards the Horizontal "Resistance Line" Above in Red.
This would also be an area to TAKE PROFIT.
BUT my main focus for ARKK would be to BREAK Above and CONFIRM Support over the MAJOR Resistance Line in Orange.
Once we do that, we have CHANGED our MAJOR TREND.
Though we have a long ways to go, keep in mind that when this happens, itll be a CRUCIAL AREA to watch.
Since we havent had 3 touch points, we could be rejected which could make it a short play also.
Now since i believe we must always be prepared. Lets look at the downside, if we can't maintain this current SUPPORT area.
My first downside target would be the line titled "Support Line#1
My 2nd downside target would be the line titled "Support Line#2
To find more evidence of whats to come, i look at the current indicators placed.
STOCH RSI, is currently BELOW the 20 level. A BULLISH CROSS, where Blue line is above Orange ABOVE the 20 elvel, would indicate Bullish momentum coming in. This would help push prices towards Resistance Line.
Notice also RSI, particularly the Black line. We were for a short time, below this line but currently attempting to move back ABOVE. If we can maintain SUPPORT on this, our trend would be intacted. Which would support UPTREND.
Finally the MACD, we need to watch this one closely. We have crossed BEARISH. We need to see a Bullish Cross and maintain staying ABOVE the 0 level. If we do this, i can eventually see ARKK move towards the "MAJOR Resistance line".
__________________________________________________________________________________
Thank you for taking the time to read my analysis. Hope it helped keep you informed. Please do support my ideas by boosting, following me and commenting. Thanks again.
Stay tuned for more updates on ARKK in the near future.
If you have any questions, do reach out. Thank you again.
DISCLAIMER: This is not financial advice, i am not a financial advisor. The thoughts expressed in the posts are my opinion and for educational purposes. Do not use my ideas for the basis of your trading strategy, make sure to work out your own strategy and when trading always spend majority of your time on risk management strategy

ARK - Cathie Wood flagship ETF rising again LONGARKK double topped about July 19 and July 31st then downtrend until Fri Aug 18th,
On this past trading day, the technology market moved higher lead by TSLA and NVDA.
ARK reversed and started the retracement of the trend down. I see ARK targeting
45 in the mid Fibonacci levels and potentially beyond that to 47.8 being the base level
of the double top. The stop loss is the pivot low on Friday as ARKK awaits a momentum
boosting cross over the mean anchored VWAP. The two TF RS indicator shows the lower TF in
green well over the 50 levels with the high TF black line lagging.
The ZL MACD shows more confirmation. ARKK looks good to enter now. I will zoom from the 2H
to the 30 minutes to find an optimal entry. I may take a large stock position and supplement it
with a single put option for insurance against downside potential. I seek a 12-14 ROI on the
stock trade and some multiples of that on a 2 to 3 week put option.

ARKK bounce may be coming. Follow up to:
It seems like so long ago, but in 2021 if you posted short analysis on things like BTC and PLTR people would legitimately mock you saying, "You must think you know better than Cathie Wood (And her team of analysts). In retrospect, they were not all that tough to beat.
But I think maybe the "Pain is in the price" now, as they say. I'm willing to take a pop long at this.

ARKK: Possible rebound between 45-46.5, Target=49.5ARKK is likely to rebound if stock's price holds above 45 mark. If price reaches 44, it might be an indication of more bearishness.
KEY LEVEL=45
TARGET=49.5
Possible bearish signal=44

The nearest target is $52.If we hold the level of 33, a short-term growth of $ 52 is possible. If we go higher, we can reach $70. Perhaps we are working out the Wyckoff method.

From Tulip Mania to Social media Mania..!Bubble investors often believe the hype and hot stories about future growth but ignore the valuation of the assets and ultimately overestimate their expected returns. Asset valuations and not hype determine investment returns regardless of economic development.
For example, there were many stories during the Technology Bubble regarding new technologies changing the economy. Many of those stories came true during the decade after the bubble, but the Technology sector was the worst performing S&P 500® sector
and provided negative absolute returns during the decade.
A bubble in financial markets is a period of rapid price increases in an asset, such as stocks, bonds, or real estate, that is not justified by the asset's underlying fundamentals. Bubbles typically go through five stages:
Displacement: This is the stage where investors become enamored with a new paradigm, such as an innovative new technology or interest rates that are historically low. This leads to a surge in demand for the asset, which drives up prices.
Boom: Prices rise rapidly in this stage, as more and more investors pile into the market, hoping to make a quick profit. This is often accompanied by a frenzy of speculation, as investors buy assets without even considering the underlying fundamentals.
Euphoria: In this stage, caution is thrown to the wind, as asset prices skyrocket. Investors are convinced that the bubble will never burst, and they are willing to pay any price for the asset.
Profit-taking: As the bubble nears its peak, some investors start to take profits. This selling pressure can lead to a slowdown in the rate of price appreciation, or even a small decline in prices.
Panic: This is the stage where the bubble bursts. Prices plummet as investors rush to sell the asset. This can lead to a severe market crash, with widespread losses for investors.
The stages of a bubble are not always clear-cut, and they can vary depending on the specific asset and the market conditions. However, understanding the five stages can help investors identify bubbles early on and avoid getting caught up in the frenzy.
Here are some of the warning signs that a bubble may be forming:
Prices are rising rapidly, far outpacing the underlying fundamentals of the asset.
There is a lot of media attention and hype surrounding the asset.
New investors are entering the market, even though they have little or no experience with the asset.
Borrowing to invest in the asset becomes common.
There is a widespread belief that the bubble will never burst.
If you see any of these warning signs, it is important to be cautious and avoid investing in the asset. Bubbles can be very destructive, and they can lead to significant losses for investors.

Palantir and Arkk Comparison 57% ProfitPalantir SPLTR & SARKK Comparison
These charts are so similar. Arkk looks like it is about to repeat Palantir's 57% move
- RSI positive divergence
- Head and Shoulder reversal bottom
- Price above 200 day MA & the POC
AMEX:ARKK appears ready to break away from the H & S.
Your stop should be placed just under the H & S baseline.
Are you in?

Long ARKK Monthly MACD crossing, About to be a green. Everyone hating on Cathy. This going to explode. Been DCAing but adding here.

$ARKK - The Growth Story will PUSH higherAMEX:ARKK moved nearly 8% higher since I shifted my focus towards small-cap potential in my initial post. Price is currently testing supply and approaching my target of $45. In anticipation of a potential market pullback next week, I may consider trimming my position. However, I'll continue to monitor the market closely and keep an eye on the gap fill above $46.41.

ARKK To Rise On TSLATesla will be lifting ARKK up on Friday but what other companies is ARKK made up of? Is this growth innovation ETF right for you? I am a huge fan and looking forward to what the future holds for ARKK and Cathie Woods can change the positions at any time to catch the best growth from the right companies at the right time. Holdings are: TSLA 11.81%| ROKU 7.95%| ZM 7.14%| PATH 6.55%| SQ 6.12%| COIN 5.58%| EXAS 4.83%| SHOP 4.62%| CRSP 4.09%| DNKG UW 4.06%| TWLO 3.85%| U 3.82%| TDOC 3.81%| NTLA 3.76%| RBLX 3.40%| BEAM 2.68%| PACB 2.57%| DNA 2.56%| HOOD 2.28%| PD 2.17%| STOCKS UNDER 2% NOT LISTED *Source ARK_INNOVATION_ETF_ARKK_HOLDINGS.pdf ark-funds.com
As a real estate investor utilizing the stock market to raise funds for real estate, ARKK is my number 2 pick in my TOP 10 Portfolio, a 10 stock portfolio that contains the top 10 best performing stocks I have witnessed in my lifetime.
View my Tesla analysis to see why Tesla will pull ARKK up this Friday. Beware Of Tesla Tidal Wave

$ARKK Still Working on Stage 1 BaseAMEX:ARKK – Maybe the best ETF to measure “Risk-On” in the market. I have been in and out of AMEX:ARKK a few times over the last 6 months. I thought it was going to start its stage 2 uptrend back in February. That was a false break-out. It is now back over its 40 Week MA, above all shorter-term Mas and has broken above an area of resistance (flat blue line). I really think this ETF has a strong possibility to rocket 50%, to 100% or more soon. In other words, I “want” to be bullish. BUT, after careful analysis, it looks like there could be some major supply until it gets over the 18-month AVWAP. I have an alert set at $45.00 which is still under AVWAP. But I want early notice and AVWAP should continue to drop in price over time. See notations on the chart for more details.
Bottomline for me, it’s a trade that needs to wait. And like I said, I want it to work. Only time will tell. Ideas, not investing / trading advice.
Thanks for looking. Constructive comments welcome
I did another post on this a few weeks back. I have the link to that at the bottom.

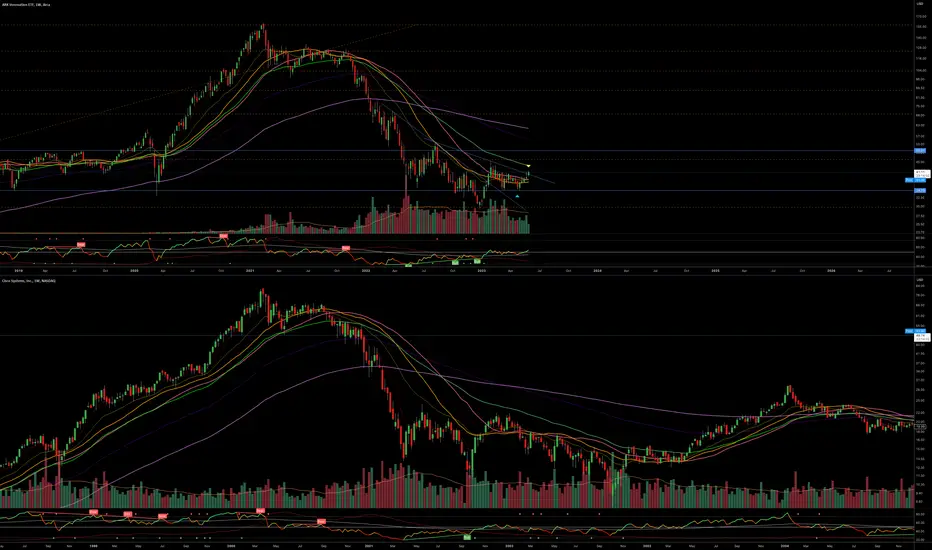
Bubble and Burst Fractals of ARKK 2022 and CSCO 2000Interesting observation!
The chart for AMEX:ARKK seems to exhibit a pattern similar to the bubble and burst pattern seen in $CSCO.
If history repeats itself, we might anticipate a potential bottom around the end of this year.
Keep a close eye on the trends!
#StockMarket #Investing
Back on an ARKKHello! If you are a follower and have been following my content I am happy to say that I am back! If you are new, welcome! I have been established as an options swing trader and became so successful that I bought a house. Now I am interested in real estate investing and have built a "Top 10 Picks" Portfolio with my top 10 picks that I will be spreading my money over in an attempt to save for a second property to soon rent out. This is a medium term goal of 2 years and I will be discussing my investment strategies, fundamental research on the "Top 10", and other general information about my top 10 picks. ARKK has been an ETF that I am highly interested in and was brought to my attention by YouTuber Andrei Jikh. He is a great investor/market analyst to follow and adds some humor to his videos. Back to ARKK! ARKK is an ETF that is actively managed by Cathie Wood. She does her own research and invest in companies that are high growth or have potential for high growth. Investments not meeting her growth standards are dumped and she is constantly searching the market for the best investments, With this there is a high expense ratio of 0.75 due to amount of work put in by the investment firm. Based on technical analysis it can be easily predicted that ARKK will rise tomorrow and retest a previous level of resistance at 41.30 a share. Based on the MACD, I believe ARKK has the potential to break through resistance. ARKK TOP 10 FACTS: Currently 40.37 a share, I am up 1.41% ( One day into the investment ) and this is in first place for performance in my portfolio. Follow to get random information pertaining to ARKK along with technical analysis, future price movement predictions, and more!

$ARKK Long Triggering Long on the H&S break at 39.70.
Stop below the recent low at 38.00.
1st Target 41.20 on the H&S count which co-incides with the recent high.

Who did provide the seed money for Ark's first 4 ETFs???What is the difference between average investors and professional investors?
There are many, but the most important ones are:
1- Data analysis
2-Systematic approach
3-Strategy
4- ...etc.
This list could be very long, but what made living legends like Warren Buffet, Jim Simons, and Micheal J Burry ...etc. is data analysis and their different approach to the data market provided to these legends.
There is one factor above all of this and that is Consistency in profit-making..!
Warren Buffet believes he is successful in the market because he moved 2 steps forward and part of one back. in the past 60years. Jim Simons, on the other hand, beats Warren buffet exceptional performance in the past 20 years..! Micheal J Burry the true master in detecting bubbles has never had more than -18% performance in a year and it happened just once!
Why Cathie Wood does not belong to the above league?
Now I would like to look at the performance of Cathie Wood in 2021, 2014-2020, and then, her performance before she founded Ark invest.
Digging her past performance provides valuable data..!
The Bright side: Ark invest outperformed all major indexes by far..!
The Golden ages of Ark invest: 2014-2020 Beating all major indexes by far.
The Dark side:
The coin flipped in 2021: Ark invest underperformed all major indexes by far..!
The most important questions here are :
A: What has happened to Ark?
B: Why they have negative performance while all major indexes are positive???
To answer this question we should go back in the past a little more:
Cathie Woods financial life before Ark invest and at the early stages of Ark invest provides important clues:
Two Red Flags:
In 2001, she joined AllianceBernstein as chief investment officer of global thematic strategies, where she worked for 12 years, managing $5 billion. She was criticized for performing worse than the overall market during the financial crisis of 2007-2008.
In 2014, after her idea for actively managed exchange-traded funds based on disruptive innovation was deemed too risky by AllianceBernstein, Wood left the company and founded Ark Invest.
Why did she name the investment management Ark?
A devout Christian, Wood found inspiration for her company while reading The One-Year Bible. She often came across passages describing the Ark of the Covenant – the chest said to have held the Ten Commandments – being taken by the Israelites into battle. On the daily devotional podcast Jesus Calling, Wood said her company was founded on faith and added: “As I began to get this idea of a firm going and realized that I was fighting this war, I knew I had to name my company ‘Ark’ for Ark of the Covenant.”
ARK's first four ETF funds were seeded with capital from Bill Hwang of Archegos Capital.
Who is Bill Hwang???
The Tiger of Wall Street is a Korean-American investor. Bill Hwang was once known as ‘the greatest trader you had never heard of’ – then he lost it all. Bill Hwang, the Wall Street investor who ‘lost’ US$20 billion in days.
Other than the catastrophe he created in 2021, he had other Red Flags in his past.
In 2013, Bill Hwang was determined to pick up the pieces of a once-promising hedge fund career that had collapsed. Trading losses during the financial crisis had humbled him and the U.S. criminal conviction of his firm for insider trading had knocked Hwang out of the hedge fund game completely. He closed his Tiger Asia hedge fund, which specialized in Asian internet and media stocks, and lost all his clients.
He would soon be banned from trading in his favorite market, Hong Kong, and the other Asian markets in which he specialized, Japan and Korea, did not hold the same opportunity.
So Hwang turned his attention to the U.S. stock market.
Washington, D.C., Dec. 12, 2012 —
The Securities and Exchange Commission today charged the manager of two New York-based hedge funds with conducting a pair of trading schemes involving Chinese bank stocks and making $16.7 million in illicit profits. He and his firms have agreed to pay $44 million to settle the SEC’s charges.
The SEC alleges that Sung Kook “Bill” Hwang, the founder and portfolio manager of Tiger Asia Management and Tiger Asia Partners, committed insider trading by short-selling three Chinese bank stocks based on confidential information they received in private placement offerings.
March 2021:
Bill Hwang stocks Crash: NASDAQ:VIAC NASDAQ:DISCA NASDAQ:BIDU NYSE:VIPS NYSE:TME
Interestingly, 4 days before it happened, I predicted it on March 16, 2021 :
VIAC:
TME:
The Grace & Mercy Foundation helps Hwang not paying Capital income tax:
The Grace & Mercy Foundation is almost entirely funded by Hwang, who serves as a director with his wife Becky and has given $591 million to the grant-making organization since its founding in 2006, according to IRS Form 990s filed through the end of 2018. More than $500 million of that amount came during the four most recent years of filings, from 2015 through 2018. The foundation’s net assets are listed in its latest filing at $470 million, after paying for operating expenses and gifts to nonprofit groups over the years.
Market Manipulators Work together:
While many people think I have a personal problem with Ark invest, I'm trying to shine the light on the missing part of this puzzle!
So far I found 4 out of many,
Cathie Wood
Elon Musk
Chamath Palihapitiya
Bill Hwang
...
Reference:
en.wikipedia.org
en.wikipedia.org
www.forbes.com
www.scmp.com
www.sec.gov

David Tepper, Cathie Wood, and the rise and fall of ARKKHere's a chart and idea about the AMEX:ARKK ETF founded by Cathie Wood. Like many, this was one of the most popular ETFs in existence back in 2020 and 2021. For the last 12 months it's been in free fall.
The innovation ETF! It invests in growing tech and emerging companies.
In the good times, this was the ETF to have. In the slow times, when capital is more expensive, when the economy is slowing a tad, this is not the ETF to have. The chart displays that perfectly.
However, at yesterday's 13f announcements, it turned out the famed hedge fund manager David Tepper, took a small $20 million stake in the ARKK ETF. This is just a fraction of his total billion dollar hedge fund, but what is the purpose of this.
To test the market?
Make some noise in the news?
Catch a bottom?
Exposure and hedging?
One interesting thing to observe on the chart is that the ETF is back to its 2018 and 2019 levels. Back then, it was bouncing off support. Today, the question is whether or not that support still exists or if support has become resistance.
They say never catch a falling knife.
This trading is not easy and I can't say I have done well on it myself.
But I do find it fascinating to watch in terms of market sentiment. I also plan on watching Tepper's position over the next 6-12 months.
Was it just a ploy of sorts? Will he add to his position? All of this seems worth watching and especially important for the next cycle, if it ever comes.
Note: the chart also shows a volume profile that specifically highlights the price levels that have attracted the most volume. You'll notice the red line across the chart shows that level. The price is right there now.


ARK ETF repeating Dow's Great Depression?The ARK Innovation ETF (ARKK) ever since (even before) its Peak on February 16 2021, has been printing a pattern similar to the one that Dow Jones (DJI) formed during the 1920s/30s Great Depression.
Right now it appears to have rebounded on Leg (f), which is the market bottom, and is pulling back to form Leg (h). According to Dow's blueprint, ARK should rebound aggressively above the 0.382 Fibonacci retracement level to Leg (i).
Do you think the worst is over for the tech driven ETF?
-------------------------------------------------------------------------------
** Please LIKE 👍, FOLLOW ✅, SHARE 🙌 and COMMENT ✍ if you enjoy this idea! Also share your ideas and charts in the comments section below! **
-------------------------------------------------------------------------------
💸💸💸💸💸💸
👇 👇 👇 👇 👇 👇

The Week Ahead: ARKK, KRE, GDXJ; CFLT, COIN, DASH EarningsWith broad market implied volatility having crushed out mightily over the past couple of weeks, I'm left scrounging around in the exchange-traded fund and/or (ugh) single name space for premium. There aren't a lot of underlyings with ideal IVR/IV metrics to play, but there are a few things that still have decent IV in them, even if it isn't toward the top of its 52-week range.
There isn't anything in the exchange-traded fund space as of Friday close with an IVR >50%, but there are a few with 30-day IV >35% (which is the combination of metrics I like to see). Here there are, ranked by 30-day with stuff <$20/share weekend weeded out:
ARKK 41
KRE 41
KWEB 39
GDXJ 37
USO 36
XOP 35
Pictured here is a fairly plain Jane delta neutral short strangle in ARKK in the June expiry with the short legs camped out around the 16 delta, paying 1.00 at the mid price with break evens at 30 and 43.
The KRE June 16th 37/48 short strangle (16 delta) is paying around 1.25.
The KWEB June 16th 28 short straddle is paying around 1.95. (Going 16 delta short strangle didn't end up paying much; the 26/30.5 was paying .55).
The GDXJ June 16th 35/46 short strangle (17 delta) is paying 1.04 at the mid.
The USO June 16th 60.76 short strangle (17 delta) is paying 1.65 at the mid.
The XOP June 16th 112/143 short strangle (17 delta) is paying 3.04 at the mid.
Broad Market
Ugh. Why even go here ... . Broad market exchange-traded funds, ranked by 30-day IV:
IWM 21.3%
QQQ 20.6%
EFA 16.2%
SPY 16.1%
DIA 14.3%
Bond Funds
My only observation here is to note that TLT premium is better than SPY's (as is EMB's).
EMB 20.9%
TLT 17.0%
HYG 9.5%
AGG 7.4%
And, of course, there are earnings ... . I've screened and ranked these by >50% 30-day IV, as well as for options liquidity and thrown out underlyings that are trading at <$20/share:
COIN 111.2 (Thursday after market close)
W 107
RUN 92.9
CFLT 80.9 (Wednesday after market close)
PPL 73.4 (Thursday before market open)
FOUR 72.0
DASH 70.2 (Thursday after market close)
The drawbacks to W, RUN, and FOUR involve strike to strike granularity, which is why I haven't bothered to look up their announcement days and times. W and RUN have 1 1/2 wides; FOUR, has 5-wides. Not having 1-wides can not only make setting up delta neutral a pain; it can making rolling out a pain if you have to do that to manage the trade, so I generally avoid underlyings with weak strike granularity for earnings plays that are generally just made to take advantage of the ensuing volatility contraction. I would consequently lean toward plays in COIN, CFLT, PPL, and DASH for volatility contraction plays, looking to get into
CFLT, Wednesday before market close (since it announces Wednesday after market close).
PPL, Wednesday before market close (since it announces Thursday before market open).
COIN, Thursday, before market close.
DASH, Thursday, before market close.
Preliminary Setups:
CFLT May 19th 22.5 Short Straddle, 3.60 credit, 18.90/26.10 break evens
PPL: May 19th 29 Short Straddle, 1.03 credit. (Well, that's ... weak sauce. It's possible that the platform is misreporting 30-day, so this will have to be checked during the NY session).
COIN: May 19th 45/67 Short Strangle, 3.29 credit. (A smidge pesky, since I'd want to set up my put side tent somewhere between the 45 and the 40 strike, where there aren't any strikes at the moment.)
DASH: May 19th 52/73 Short Strangle, 1.95 credit.
