FAS trade ideas


Rising Wedge Pattern in ETF's Market AMEX:FAS , shows a rising wedge pattern, which is break at the end to change the prior trend, finally after a pullback. The Parabolic SAR indicator support the trending change.


FAS-Banks passed stress tests..Increased dividendsMore cash available for stocks buyback. Just be careful. Only get in at formation of handle.


FAS Looking for a break of supportI have a number of financial stocks on short watch. They are very over extended. Looking for a break of support.

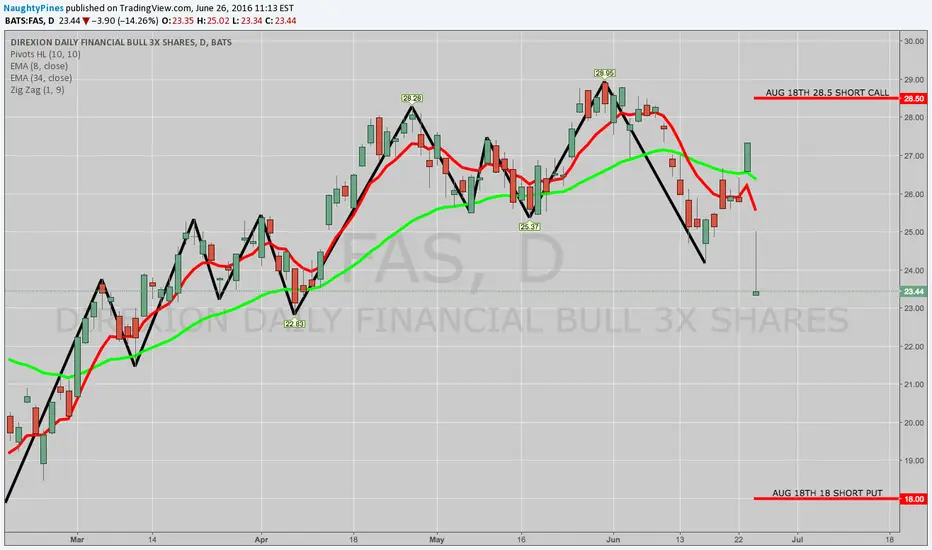
TRADE IDEA: FAS AUG 18TH 18/28.5 SHORT STRANGLETruth be told, I'm not a huge of fan of leveraged instruments, but when a $23 underlying has the potential to yield a $100 or more worth of credit, I'll briefly overlook the warts these instruments have as an "investment" tool ... .
Here are the metrics for the play:
Probability of Profit: 77%
P50: 81%
Max Profit: $127/contract at the mid (this is off hours pricing; we'll have to see whether that's possible at NY open)
Max Loss/Buying Power Effect: Undefined/$232/contract (estimated/off hours)
Break Evens: 16.73/29.77
Notes: I'll look to get a fill for anything north of $100/contract, given the price of the underlying. As usual, I'll look to take this off at 50% max profit.
$FAS Bears Eye 7.83; Put On Summer Power Shorts | #ETFSYNOPSIS :
1 - Major bearish strength coming into play
2 - Immediate major support resides at the 15.54 handle
3 - Limited reactive rally expected at 15.54
4 - Ultimate bearish target at 7.83
Best,
David Alcindor, CMT Affiliate #227974
- Alias: 4xForecaster (Twitter)

Financials Hello 2008 all overLoving the Head and shoulders
Saw a few of those around the 2008 meltdown time.
Traders lets make Billions on this correction! :)

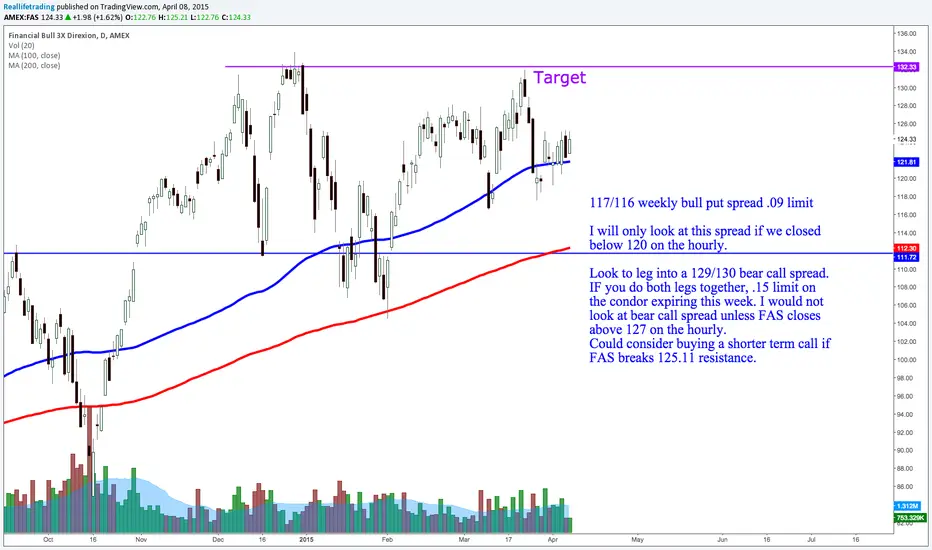
FAS weekly bull put spread / possible condor. 117/116 weekly bull put spread .09 limit
I will only look at this spread if we closed below 120 on the hourly.
Look to leg into a 129/130 bear call spread. IF you do both legs together, .15 limit on the condor expiring this week. I would not look at bear call spread unless FAS closes above 127 on the hourly.
Could consider buying a shorter term call if FAS breaks 125.11 resistance.

FAS weekly bull put spread 117/116 .10 limit bull put expiring this week.
Analysis on 2/11/5
I would not even look at spread unless we close below 119 on the hourly. Line in the sand to make a decision is a close below 118.16 on the hourly.

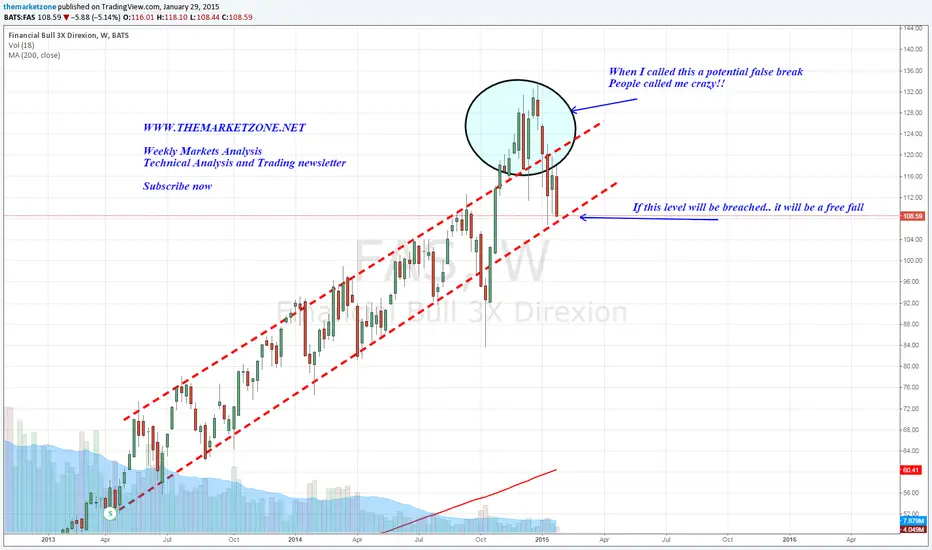
Major weekly false break - What's next$FAS is testing the bottom of a weekly channel. Critical support zone to watch but on the longer term, I'm bearish
AB=CD pattern just became bad news for the bullsThe AB=CD pattern mentioned in this week's Weekly Markets Analysis newsletter (marketzone.tumblr.com) just may became a serious warning signal for the financial bulls.
The lower border of the Trading channel we've been monitoring in the Market Zone for while, just got breached.
If this situation will stay till the end of the trading day, it is a great development to my bearish setup.

$FAS below 103 means bad news for financialsThe daily AB=CD pattern started working last week with a nice reversal in the PRZ.
The stock is trading inside a small descending Triangle and we see sellers pressure pushing the price lower and lower inside the tight range.
Break of the Triangle will probably lead to the support zone (structure and trend line).
It will be a buying opportunity for the bulls among you.. I'm more interested in what goes on below 103.
Multiple bearish signs in the weekly and the daily chart. Monitor closely.
Join the Market Zone and join the Elite Zone members for more trading ideas like this one.
www.themarketzone.net

Double ConfluenceDouble AB=CD + .786 retracement confluence. This could be a short to at least fill the last bigger gap.
