013A trade ideas

JD may add some shares on this dip. watching for nowhello everyone please leave a like and follow if you enjoy my ideas :) if you have any questions feel free to dm me here or comment down below. goodluck <3

JD.Com double bottomed and W pattern evidently clear!Seems like JD.com has now double bottomed and formed a clear W pattern. This is quite bullish and the next move should be UP! Potential technical target would be around $92

JD ShortProbably going to pair trade this with BILI calls so I don't get effed by pumptard strength.
Massive OI at 80c's for this week. MM's will try to force this down. See PDD and 130c OI.

$JD - H&S and bullish setupThe chart tells on it's own.
Classic setup; however, need to see if 80 resistance is broken.
T1: 80
T2: 87
T3: 95

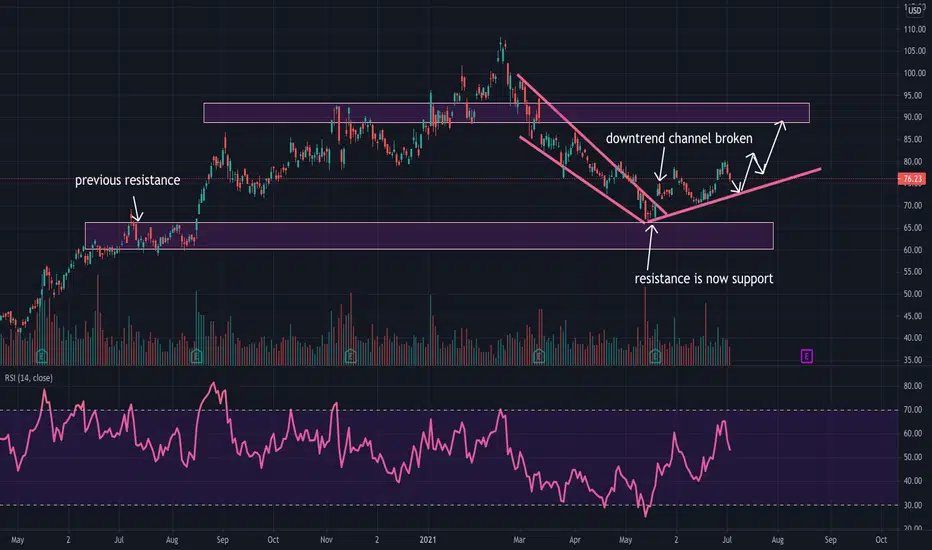
JD.com is a BUY nowThis is a pattern I have talked about in the past and it is a combination of a distribution pattern (in this case a Wolfe wave) and a reversal pattern within the accumulation phase (in this case a reversed head and shoulder). I bought this in my investments accounts and is a long term hold for me.

JDJD Long🚀📊
It is not financial advice. This is my opinion. Please check yourselves and invest in the symbols in which you think have a huge opportunity to reach the best results.
please leave us your opinion and reviews.🙏
Good Luck 👍


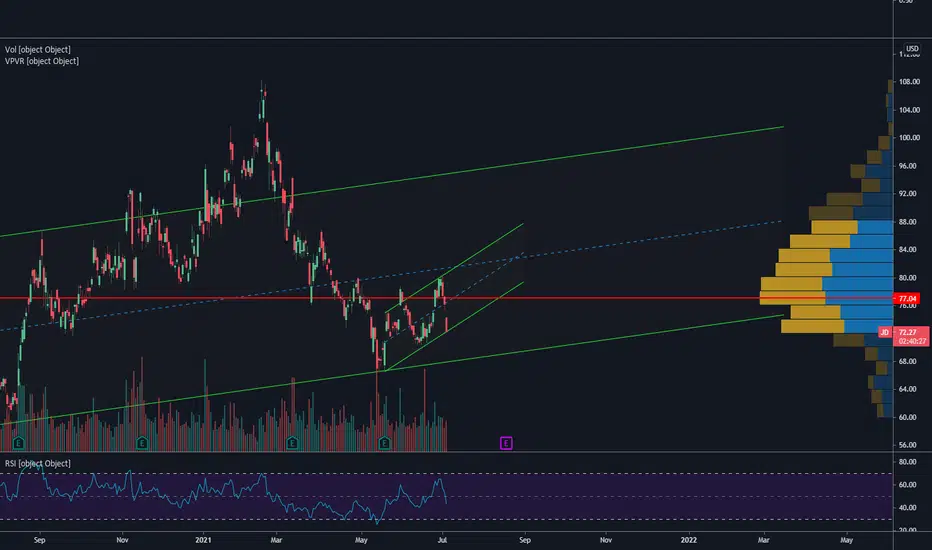
$JD - up to 100?Fib-retracement and break-out of the downtrend
Analysts bullish
Tensions over Chinese tech sector reducing
All indicate back to fair valuations


Chinese Tech Up Strongly - Take Profits On JD.com For 5.7%Yesterday I flagged JD.com and the prior day BABA and BIDU.
Chinese tech stocks having 2 good days.
JD up 5.7% from the flag. If you want to take some profits, you can do it here (~$78.11).
If you feel there's more upside, take 50% here and reduce more at higher levels.

Buyers Showing Interest In Chinese Tech - Also See JD.ComBoth our Baidu and Alibaba ideas has starting to gain some traction, while outside of this group, SNAP has also starting to move on the back of it's deal with Universal (now +$6 or 10% higher)
See JD.com - it's breaching it's downward trend and if it gets above 74.45 intraday, it could also get back 'in play' for a move up to ~$77.20, using a stop-loss of 72.30.

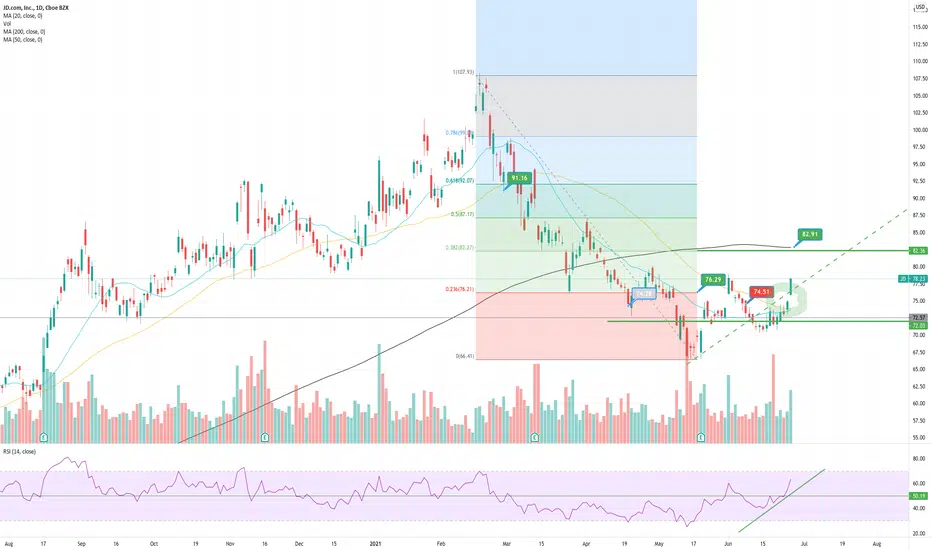
JD LongCup and Handle forming on the JD Daily. Currently starting to curl the bottom of the cup and is at a critical point of pushing past resistance at 74.00 and moving up into the back of the cup, or being pushed out. 74.00 is also the current 50sma which will provide additional support if it can push and hold above. RSI CCI and MACD all trending up. 78.80 and 83.40 will be the next tests.
This is not financial advice, only a pattern observation.

JD IH&S looking to be formingMore sweepers came in for weeklies yesterday for 72.5 strike. Still in the sept 77.5 strikes.
Levels posted here 74 then 76 then it can really move. Final target will be low 80s by mid July but some news could send this flying.

$JD - Inverse head and shoulder formation JD broke out of descending wedge and starting forming Inverse head and shoulder. The right shoulder is not complete yet.
Neck line - $79
Validation point - $80
Good case - $84
Best case - $90
———————————————————
How to read my charts?
- Matching color trend lines shows the pattern. Sometimes a chart can have multiple patterns. Each pattern will have matching color trend lines.
- The yellow horizontal lines shows support and resistance areas.
- Fib lines also shows support and resistance areas.
- The dotted white lines shows price projection for breakout or breakdown target.
Disclaimer: Do your own DD. Not an investment advice.


JD reversal? Possible formation of an inverse head and shoulders. Great fundamentals. Keep an eye on this one along w other Chinese names such as BABA they have been so beat down.

$JD Triple D----Double Doji on Daily After breaking the downtrend last month, JD was able to create a higher low and now doji'd the past two days. Time for it to pick a direction and we strike

$JD | Bullish Channel and Trendline Retest$JD just retested a trendline and price is consolidating within a channel. Watch for a breakout of the channel for a bounce to the upside.
*This is an unconfirmed setup*
