PAYC breaking out of channelPretty keen moment seeing PAYC break the downtrending channel it's been in. Regained its 50 day sma.
Could rise to 410 pretty quick if this isn't a headfake.
0PY trade ideas

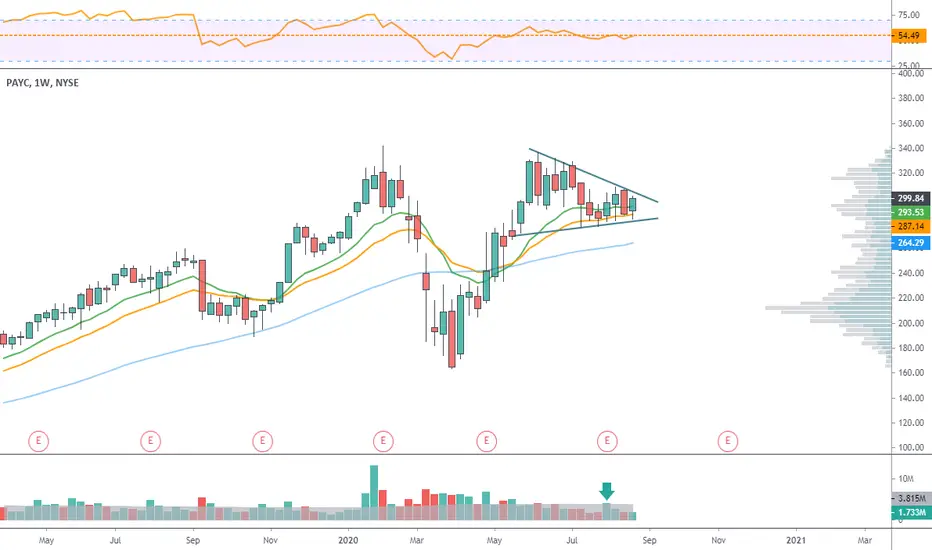
Crucial days ahead for PAYCAs can be seen, PAYC has been declining in a pretty wide channel, and broke down from it's March 2020 trendline (follow my other charts to see how effective this is) and now faces coming back up against it as resistance:
Bullish despite all this. They recovered their 200 day SMA, which was a true buy-the-dip moment. MACD looks good too.


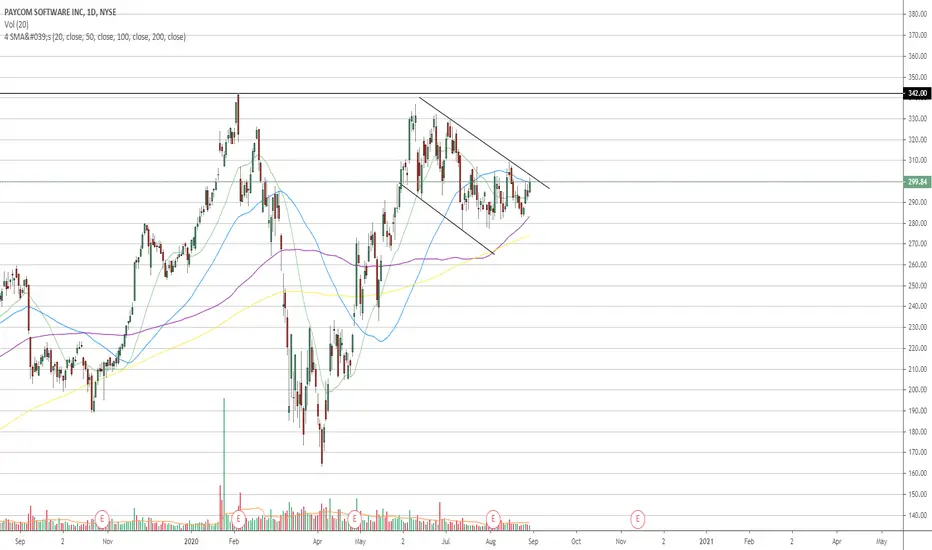
PAYC, Time To Buy?Hello fellow traders and investors, PAYC recently pulled back to the trendline that acts as a support and PAYC does a very good job of making a full recovery to the upper trendline.
Technicals:
The Macd indicates that it is oversold
The EMA's indicate that it is in a downtrend
When To Buy:
When the Macd crosses its EMA
When the EMA's crossover indicating an uptrend
When To Sell:
There are two options I am suggesting. The first option is to sell at the previous high which offers a little bit over a 17% ROI and the second option is to sell a the upper trendline which would offer around a 25% ROI.
Hope you enjoyed this quick analysis and many more to come.
If you enjoyed leave a like and follow, thanks

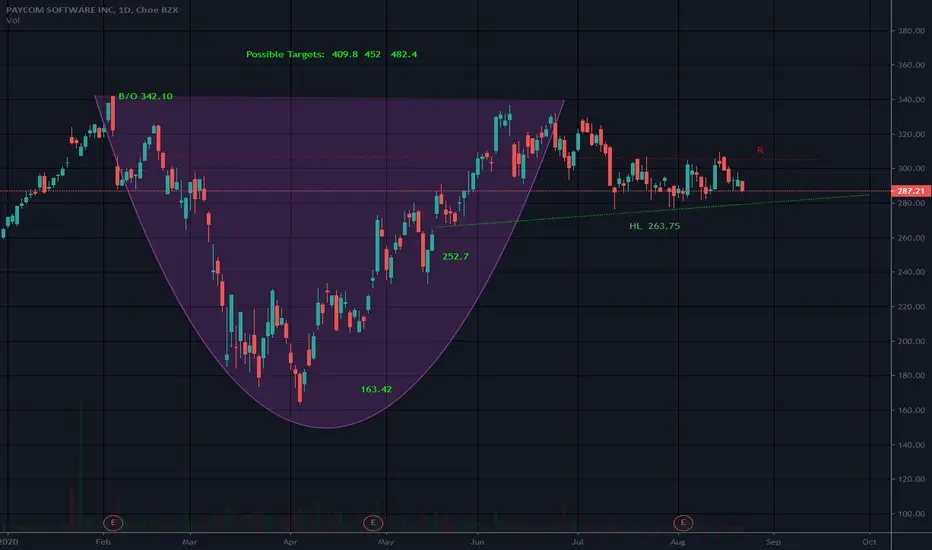
PAYC BUY OR LONG , TARGET $480+PAYC confirmed the " Cup and Handle " pattern at $350, I opened Long here.
PAYC buy : $350
PAYC target : $480
Stop loss : $330 or 6-7%.
Wish you a good deal!

PAYC - Potential Bullish Pivot What's going on traders? Hope you all had a Happy season. Today, we are looking at Paycom Software NYSE:PAYC and it looks as if it had a nice correction in price recently. The stock was trading at a recent high of $471.08 before dropping nearly 13% to 411.13. That area also lines up with previous resistance areas which could be acting as support now. Since then the stock has crossed above the lower Keltner channel (represented by the white dot on the chart) and might be resuming it's trend upward. We will continue to watch PAYC to see if it does move higher over the next few weeks.
REMEMBER: Reference to specific securities should not be construed as a recommendation to buy, sell or hold that security. Specific securities are mentioned for educational and informational purposes only. YouCanTrade is an online media publication service which provides investment educational content, ideas and demonstrations, and does not provide investment or trading advice, research or recommendations.

Cup and HandlePAYC finally hit long entry level
Then pulled back under it again
A little too much green leading up to break out level but no rising wedges noted
Tough time to be trading
Keeping an eye on this one though
Strong stock
Volatile as a volcano though so no telling what this will do tomorrow!
NV is high
Not a recommendation

$PAYC Cup & Handle$PAYC is forming a nice cup & handle which should make a nice move to the upside & take us above to new highs. I am looking for breakout above trend line as a trigger for the trade below.
Trade: BTO $PAYC 9/18 $320c avg $5.30


$PAYC Consolidation$PAYC v-shaped recovery, then nice long consolidation base. Strong software name that hasn't popped yet.
Cup and HandleKnown to be volatile. PAYC looks to be fighting hard resistance (R) at 311ish
Strong S (support) noted at 276ish
I would put my stop under mid cup on this one due to volatility level.
Not a recommendation
#PAYC LONG-TERM INVESTMENT IDEA From 200$ up To 520$ #PAYC LONG-TERM INVESTMENT IDEA From 200$ up To 520$

PAYC, Paycom Software IncI found this pattern at tickeron website with the following data:
Rectangle Top Bullish - Emerged on Aug 13, 2020
Current confidence to reach target price = 64%
Distance to target price = 3%
Breakout (Entry) price = 302.24USD
Target (Exit) price = 319.56USD
EMERGED ON Aug 13, 2020
PRICE = 301.88USD
CONFIDENCE TO SUCCEED = 63%
CONFIRMED ON Aug 14, 2020
PRICE = 309.33USD
CONFIDENCE TO SUCCEED = 63%
Description
The Rectangle Top pattern forms when the price of a security is stuck in a range bound motion. Two horizontal lines (top: 1, 3, 5) and (bottom: 2, 4) form the pattern as the security bounces up and down between support and resistance levels. Depending on who gives up first buyers or sellers the price can breakout in either direction.
This pattern is commonly associated with directionless markets. Usually the pattern performs better when there is a strong uptrend leading into the formation.
Trade idea
If the price breaks out from the top pattern boundary, day traders and swing traders should trade with an UP trend. Consider buying a security or a call option at the breakout price level. To identify an exit, compute the target price level by adding the pattern height (which is the distance between the horizontal line (from top to bottom) and add it from the breakout price.
To limit potential loss when price suddenly goes in the wrong direction, consider placing a stop order to sell at or below the breakout price.

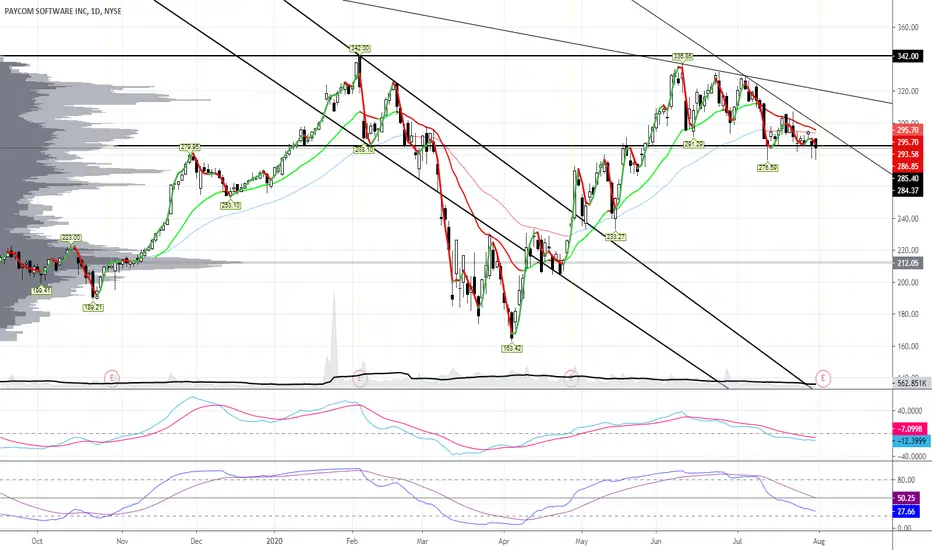
[$PAYC] - Confirmed downtrendDoesn't get much cleaner than this. $PAYC closed below its 13 & 30 SMA with an SMA cross on the 1D chart. Along with a triple top formation and a close below support. You cannot ask for a cleaner chart than this.
Target would be the 200 SMA line with is nested below a nice gap, around the ~263 area.

BUY to PAYCOM SOFTWAREHey people, PAYCOM SOFTWARE is in a downward push, possibility that buyers are just starting out, so we can witness a reversal. The equilibrium zone will break if we reach half of it.
Please LIKE & FOLLOW, thank you!

PAYCSystem T Performances: Annual Compound Profit 40%, Win Rate 55%, Risk/Reward Ratio 1:2, 20 Years of Backtesting Data, Over 100 Markets.
* Click Like and Follow to Support My Work!
---
Hi Traders,
I'd like to introduce the System T, a computerized trading system that analyzed and backtested the 20 years history data of over 100 markets.
This post is my sharing of how I think about systematic trading and the signals generated by the System T.
(This is my opinion only, NOT the financial advice.)
The System T is a comprehensive system which contains many components such as buy & sell signal generator, win & loss statistics, risk control & portfolio management to make sure trading is successful in the long run.
Basically, for the system to open a trade and manage risk, it only needs a buy signal & a stop-loss signal clearly on the chart.
Once the system finds a good trend, it will ride it as long as possible. The stop-loss will be adjusted accordingly to the new price movement.
(*) Remember to follow this trade idea and follow my profile to get updates about the stop-loss adjustment and sell signal based on the latest price and market conditions daily.
System T performances above will give you an idea of how it performs in the last 20 years.
Notice that this result was achieved only if I strictly followed the rule: "Only and Always Buy & Sell based on the System Signals".
Don't sell when there is no sell signal as we all want to follow the good trends til the end like everything in life does. \(^-^)/
Also, my system is extremely diversified through over 100 markets so that it only risks less than -1% of the total capital per trade.
Thank you and good luck!
---
DISCLAIMER:
I am NOT a financial advisor, and nothing I say is meant to be a recommendation to buy or sell any financial instrument.
My views are general in nature and I am not giving financial advice. You should not take my opinion as financial advice. This is my opinion only.
Do your own due diligence, and take 100% responsibility for your financial decisions.
Trading and investing are risky! Don't invest money you can't afford to lose, because many traders and investors lose money. There are no guarantees or certainties in trading.
- Content is for education purposes only, not investment advice.
- Trading involves a high degree of risk.
- We’re not investment or trading advisers.
- Nothing we say is a recommendation to buy or sell anything.
- There are no guarantees or certainties in trading.
- Many traders lose money. Don’t trade with money you can’t afford to lose.


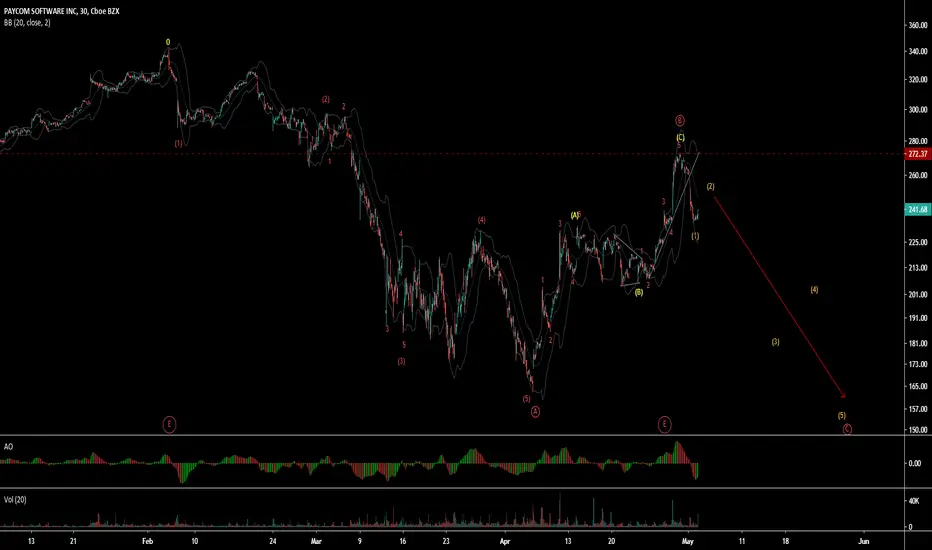
Paycom Software Inc (PAYC - US) - ABC wave patternPaycom Software Inc (PAYC - US) has completed B wave and fallen down in 1st wave. It is now in 2nd wave correction which will be end soon and start 3rd wave down of C.
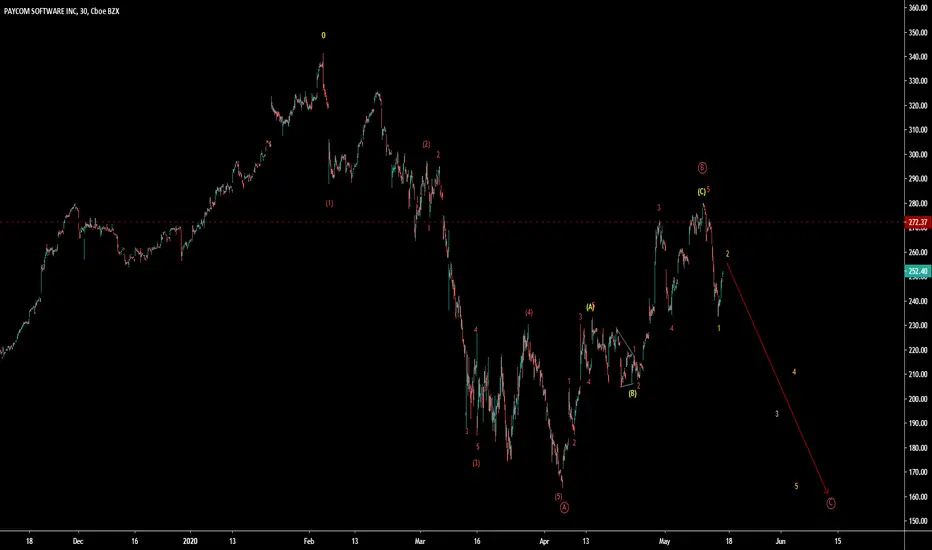
Paycom Software Inc (PAYC - US) ABC wave patternPaycom Software Inc (PAYC - US) is moving down in ABC wave pattern. B wave is zigzag having internal b wave as triangle, which may be result in sharp reversal. It is already made wave 1 down of wave C major.
PAYC - again the MAGIC TRENDLINE + hidden PINBARHi traders,
I do not have many LONG markets in my watchlist for the upcoming week. After such a big drop, 70% of markets are in the Short Watchlist.
Truth be told since stock markets are mostly grown, I don't like Short trades very much. BUT!
The analysis showed me that in big declines they save money and smooth the equity curve. And that is the main thing. No one knows if we will go down in the SPY market or not.
So even if I don't like to take them, I have to do that and follow the plan. And that's why I'll show you some markets from my Short Watchlist tomorrow.
From an educational point of view, I am talking about "Hidden PinBar" in the NYSE:PAYC market.
Good trading,
Jakub
FINEIGHT
