SHOP to 69SHOP daily chart could find channel support. With a break of the channel, gap fill around 48 is in play. Potential profit target of $69 in both scenarios.
307 trade ideas

SHOP to 75As you can see on the chart's bottom, when green line goes below 0, the following movement is a strong long one.
If we look up to this pattern on different timeframes, we could see the same.
The indicator's name is konkorde. But this indicator is not enogh to analyze.
You can use a oscilator as slow stochastic to have more information
Timeframe is 150min because I think is a middle point betweeen short term and medium term trading.

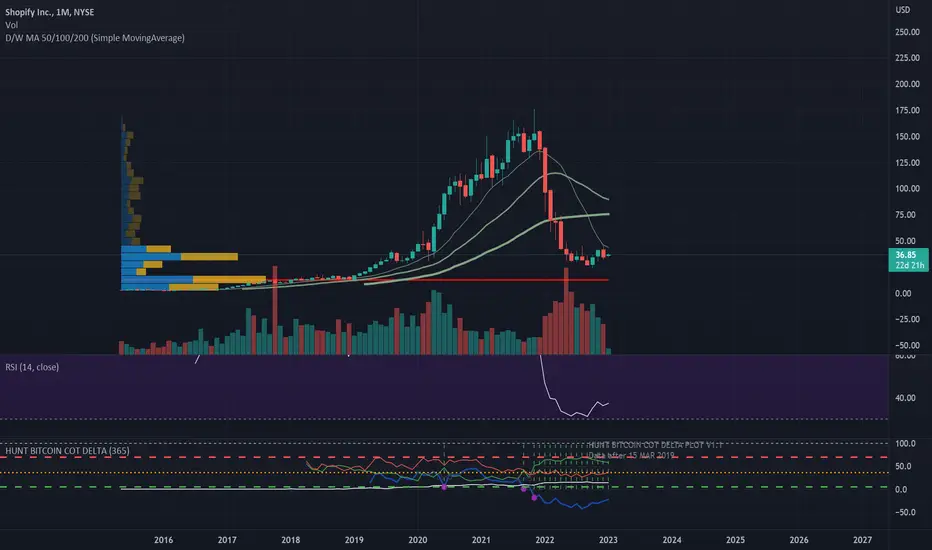
Bull momentum of Shopify has been completely releasedBull momentum of Shopify has been completely released
This chart shows the weekly candle chart of Shopify stocks over the past two years. The top to bottom golden section at the end of 2021 is superimposed in the figure. As shown in the figure, since the completion of the form at the end of October 2022, it has risen by 4 small bands, and theoretically, the bull momentum has been completely released! This week, Shopify's stock has made a significant pullback, returning to below the 2.382 position in the golden section of the chart! In the future, it is likely that there will be a longer period of bull rest!


$SHOP - SHORT TERM BIAS SHIFTS BEARISHNYSE:SHOP
www.tradingview.com
Shopify has been on the rise following the general market, it is up almost 200% from the low it formed in October, 2022. The stock is approaching the Macro supply zone formed by the 2022 downtrend. Currently, the stock seems overextended on the short term and a micro reversal is expected.
Here are the points supporting this analysis:
1. Price created the Overdrive Pattern AKA The Three Indians pattern
2. We are still at a point where investor sentiment doesn't mirror Macro-economical sentiment
3. Price got rejected from the premium quartile (0.75 level) of the Weekly trend
4. Technical Oscillators are overextended and showing exhaustion. RSI is showing a triple Divergence and the 14 EMA is pierced. MACD BEAR crossover is commencing.
5. Decreasing Volume while Price is increasing on the Weekly chart (Volume Divergence) (look at the MA of the volume and trend of the price since the low in OCTOBER 2022 was formed)
6. July's Monthly candle is showing indecisiveness with decreasing volume when compared to June's Candle
7. Downgrade of the US debt credit rating to "AA"
8. ISM Manufacturing Index is down for the month of August
Here are the point invalidating this analysis:
1. The Monthly sentiment is Bullish
2. Earnings beat Wallstreet estimates
3. The weakness of the last 3 bearish candles on the Weekly chart
Overall, I am expecting the price to keep increasing on the Macro level. However, short term bias is shifted to a bearish outlook following the idea of counter trending and speculating Macro trends on Micro levels. Shorting the stock from here would put your stoploss at a risky position, a bullish pullback on the intraday charts is favorable for a possible entry. Take profits at the supports mentioned below and model your risk. If you are a bag holder, holding this stock is favorable at the time and adding at $40.61 is a good price.
Support levels:
$60.46 (inner low)
$55.34 (external low)
$40.61 (Macro Demand Zone)
Resistance levels:
$68.63 (recent high)
$74.23 (lower barrier of the supply zone)
$78.00 (upper barrier of the supply zone)
What yall think? Share your analysis


SHOP Shopify Options Ahead of EarningsIf you haven`t sold SHOP here:
or considered this buy area:
Then analyzing the options chain and the chart patterns of CAT Caterpillar prior to the earnings report this week,
I would consider purchasing the 67usd strike price Calls with
an expiration date of 2023-8-11,
for a premium of approximately $3.50.
If these options prove to be profitable prior to the earnings release, I would sell at least half of them.
Looking forward to read your opinion about it.


$SHOP Stock Shows Promising Breakout with Upside Potential
Introduction
Shopify Inc. ( NYSE:SHOP ) has been garnering significant attention in the stock market as it breaks out of multiple weeks of consolidation. This Canadian e-commerce giant has witnessed remarkable growth over the years, and recent technical analysis suggests that there is substantial upside potential for the stock. In this article, we will explore the factors behind Shopify's breakout, examine the potential for further gains, and discuss a potential entry point for long positions.
Shopify's Breakout from Consolidation
After several weeks of trading within a tight range, Shopify's stock finally managed to break out above its consolidation pattern. This breakout indicates a significant shift in the stock's price direction, and technical traders have been quick to take notice. The breakout is a signal of potential upward momentum, with the stock showing strong bullish sentiments.
The Upside Potential
With the breakout from consolidation, Shopify's stock now has ample room for further gains. As the company continues to innovate and expand its e-commerce platform, it is attracting more businesses and consumers to its ecosystem. The ongoing shift towards e-commerce and the rise of online businesses have provided a tailwind for Shopify's growth, and this trend is expected to continue in the foreseeable future.
Furthermore, Shopify's financial performance has been impressive, with consistently robust revenue growth. The company's strong quarterly results have reassured investors of its long-term sustainability, which has contributed to the positive sentiment surrounding the stock. As Shopify expands its international presence and introduces new features and services, it is likely to attract more merchants and drive further growth.
Waiting for a Long Opportunity
While Shopify's breakout presents a compelling opportunity for traders and investors, it is crucial to exercise patience and wait for an optimal entry point. The ideal scenario for long positions would be a retest of the weekly breakout, around the $67.3 level. This level would act as a support level, providing a more attractive risk-to-reward ratio for long positions.
By waiting for a retest, traders can confirm that the breakout is genuine and that the stock has the potential to continue its upward trajectory. Timing is crucial in the stock market, and entering a position at the right moment can significantly impact potential gains.
Conclusion
Shopify Inc. ( NYSE:SHOP ) has captured the attention of the market with its breakout from weeks of consolidation. The stock's impressive upside potential is driven by the company's continuous growth in the e-commerce sector and its strong financial performance. As the online business landscape continues to expand, Shopify is well-positioned to capitalize on this trend.
For traders and investors considering a long position in Shopify, it is essential to wait for an opportune moment. A retest of the weekly breakout around the $67.3 level provides a compelling entry point with a favorable risk-to-reward ratio.
As always, it is crucial to conduct thorough research and consider market conditions before making any investment decisions. While Shopify's breakout presents an enticing opportunity, prudent risk management and disciplined trading strategies should guide all investment activities.
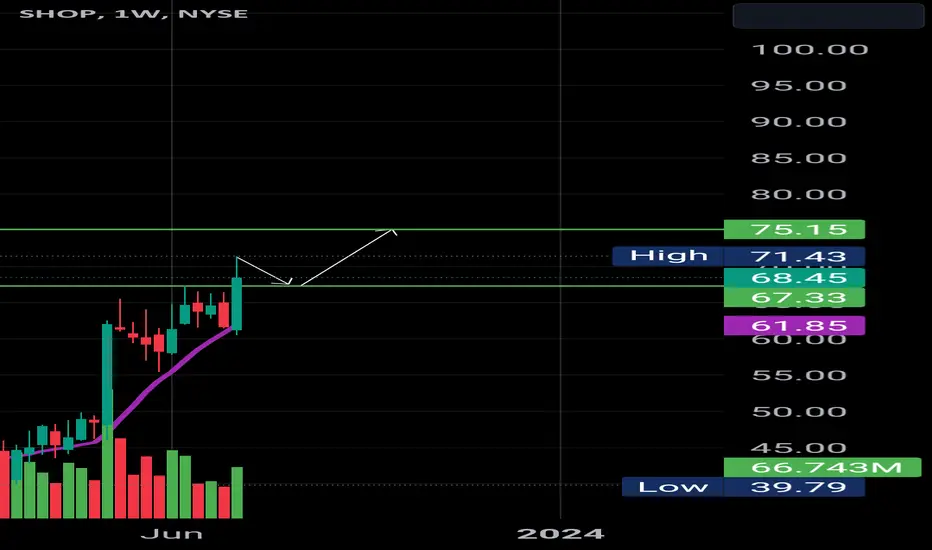
Breakout Trade in SHOPShopify is emerging from a beautiful Stage 2 base.
SHOP is up more than 100% since the start of a year – a clear sign this is a market leader.
Notice how volume is higher on the rallies up and lower when the stock pulls back. This is a subtle clue that buyers are in control and the smart money is building a position.
The breakout on Thursday came on 2X its average daily volume and the stock closed at the high of the candle – both good signs of a legitimate move.
I want to see SHOP stay above the breakout level or, at a minimum, above its 21-day moving average (blue line on chart).

loving this SHOP setup☕❤shop must break 67/local trend resistance before next leg higher comes 👇
I am seeing many bullish signs at the moment though, look at perfect 50SMA bounces and how it acted in the past when that happened...
RSI is not so overbought and also holding well above a very strong trend support... so even if we dip then push higher may still follow after.
currently in consolidation before the breakout, like we have seen in many other names recently.
Boost and follow for more.. thanks 💛


Breakout trade in SHOPShopify needs no introduction. If you bought something online from anywhere other than Amazon, the sale probably ran through Shopify.
The stock is up 175% since October and proving to be a market leader.
The recent action shows shallowing retracements on declining volume – a textbook breakout pattern or "VCP Pattern" as described by Mark Minervini
I would consider buying on a move above $66.60 with a stop loss at $61.00 to risk roughly 8% on the trade.


Just use your imagination. What have other stocks done after??Looks pretty darn bottom to me. I stare at charts for 6 years and things just stand out like a sore thumb.
I wont even put price targets, cause they will be mocked. New all time highs I would imagine though.
Somehow this company will integrate with coinbase, I am almost certain of it.

Watchlist 2023-06-16 $ENVX $CRWD $MU $SHOP $CMAAMEX:SPY hitting 14 month highs on Thursday, rallying this Friday the morning, likely lead by NVDA's price target and weighing upgrade by MS. Changing their price target from $450 to $500l. Chips stocks gapping up
For further confirmation of a trend day, watch for:
USI:ADD pinned near +\-2000
USI:VOLD ratio over +/- 3
USI:TICK cumulating past 0 wicking to +/-900
NASDAQ:ENVX - Enovix hits Q2 milestone early, producing 18K battery cells. Gapping up 1.75 ATRs ABOVE the yearly cup and handle res at 15.25. HOWEVER, RVOL at time is only 0.4 so we will need to see the vol pick up in the morning, Typical first 5 min bar is ~100K , so a 200K bar which be a good indication that RVOL has arrived.
Support 14.72
Resistance 19.29
Inflection 15.25
Lots of other BO's setting up this morning.
NASDAQ:CRWD - Mizuho Adjusts Price Target on CrowdStrike to $180 From $175, Maintains Buy Rating. Support trade off 161.40 if we see buyers stepping up. Need to has multiple touches of the key level and retest in the range for confirmation. If there is a weak bounce after the initial test, that is a signal to either reduce position or get out.
NASDAQ:MU - rallying off NVDA's news that morgan Stanley increases their price target again from $450 to $500, while saying AMD will be a lagger. If MU can find a bid, there is plenty of room to 74.
NASDAQ:AMD - if chip stocks sell off today, looking for find a place to short ADM as it is the onlly chip not rallying this AM.
NYSE:SHOP = buy over 67
NYSE:CMA - RVOL over 2, over 44.25 is a long
Comment what you are watching!

$SHOP has a good plan to take more capitalization in a monthNYSE:SHOP
$SHOP picture looks like it is ready to start pushing off the low board of the channel and make a moving for the 40% nearest time repeating a jump withing the funnel.
Lets observe in some weeks.
$SHOP::$41->$58::40%::20 days (Mar, 10 buy).
Does not constitute a recommendation.
#investing #stocks #furoreggs #forecast
