ASML Long term investment ideaLooking at history and the philosophy that we are witnessing the technological gold rush with the advancement of AI and next generation NVIDIA chips. The idea that during a gold rush, the ones who got the wealthiest were those that sold pickaxes. Looking into this supply chain, the bottleneck is clear, this is an industry that takes time to build and scale. Arizona fab to years and billions of taxpayer dollars to get done, and it still took years.
With ASML being the only company supplies the lithography machines that take months to build and ship, they are school bus size light canon printers that need specialized teams to run and operate. Doesn't seem that any competitor in on the horizon, but with quantum technology also developing exponentially, their dominance in the chip market could strengthen past that of TSMC in my opinion. Their codependency on one another is being overlooked in markets, in my opinion.
ASMF trade ideas

ASML will shine compared to the S&P500 (SPX)The top in 2020 is now the new low. It looks like the bottom has been reached and ASML/SPX is going up! The RSI is also looking good!

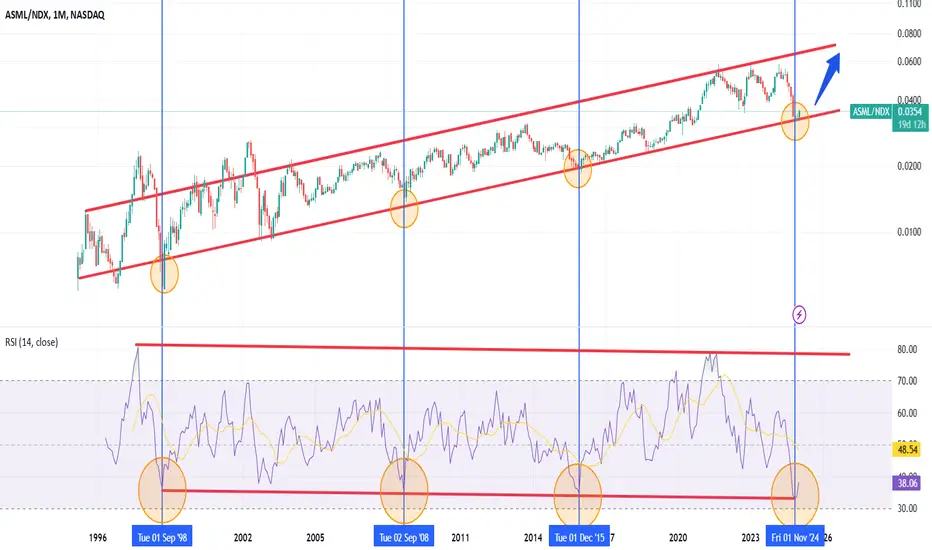
Investing in ASML or Nasdaq 100? ASML looks better now!Chart speaks for itself. I think ASML will rise compared to Nasdaq 100.
Halftime Update: ASML is looking good for a Continuation PushASML recently broke out to $780 after closing around $715 on January 3rd, 2024. Looking for a potential entry around $762.97 with a stop around the $756.31 Levels and that $780 Price Target.
Connect with us by visiting our website in the signature below to access more Resources & Tools to improve your investments at @MyMIWallet #MyMIWallet

ASML Swing Trade - ShortFor my first trade of the year, I will take a stab at ASML.
The share has failed to break through an established resistance (red line), and MACD and price action suggest a bearish move. My profit target is 608, close to the next support I identified (green line). My stop will be just over the resistance line, resulting in a 2R target for this trade.
Happy New Year, fellow traders! Let's go!


679 gap fill could test the earlier support mid 650 as wellMoving averages are still bearish, oscillators are still working overtime in bear territory, and the bottom isn't entirely confirmed. Still, it does seem to be shifting toward a reversal at some point. For now, waiting on confirmation that 679 is the first target; if it breaks, 650 would be to retest the low, but I don't believe that would break, but the first thing is first and our target.


ASML Bullish OutlookShort-Term Drivers:
Stock Performance: Shares have risen 13.89%, from $655 on November 21 to $746, signaling strong bullish momentum.
Analyst Confidence: 'Moderate Buy' ratings with a $943.83 price target (32% upside); BNP Paribas targets $858.
Options Activity: Elevated call options volume reflects growing investor confidence.
Long-Term Drivers:
Growth Projections: Revenue forecast of €44-€60 billion by 2030, driven by AI-driven chip demand.
AI Expansion: AI-related chips expected to dominate 40% of the chip market, boosting demand for ASML's cutting-edge tools.
Technological Leadership: Dominance in EUV lithography systems ensures a critical role in next-gen chip manufacturing.
Technical Analysis:
ASML bounced strongly from a key support level at $655 on November 21, rallying 13.89% to $746. This rebound confirms the long-term uptrend and highlights growing bullish momentum. Additionally, the Relative Strength Index (RSI) has started reversing to the upside, signaling further potential for price appreciation.
Potential Price Targets:
TP1: $870 (Aligns with short-term analyst targets and reflects immediate upside potential).
TP2: $1,110 (Breaks into higher resistance zones with extended bullish momentum).
TP3: $1,300 (Long-term target supported by sustained growth and market dominance).
Why ASML is the Right Pick Now:
ASML's unique position as the sole supplier of EUV lithography machines, its strong innovation pipeline, and robust financials make it a standout choice. With bullish momentum, supported by technical and fundamental factors, the current price of $746 presents a strategic entry point with clear upside potential to key targets.
Disclaimer:
This analysis is for informational purposes only and should not be considered financial advice. Always conduct your own research and consult a financial advisor before making investment decisions.

ASML is finally about to MOVE! 65% UPSIDE🚨 H5 TRADE SETUP 🚨
Giving this one away for free and asking nothing in return! Lets get into the setup!
NASDAQ:ASML 🏭
As you can see on chart below we have a multitude of things to talk about! Lets talk about what we have currently and what we need for this to be a trade worth entering.
-Beginning of this year we had a multi-year cup&handle breakout that never got to it's realized measured move of $1,124 before we had a pullback the measured time for this breakout is Jan2026 so basically 2025 we should realize that measured move. With the pullback we had we over compensated and broke through the support turning it back to resistance in which we now need to breakout over again and flip it back into support before heading higher.
-We have now created a new charting pattern, a falling wedge pattern in which we have just broken out of this week if we hold into EOW. This has a measured move up to $1,182 with a mid-year timeframe of Aug2025.
-We have a massive AVP Volume Shelf with a subsequent GAP to fill up to $883. Price held at this massive shelf and it should be used as a launch mechanism to send us back to ATHs.
-We held right at the Anchored VWAP Lower band as well from our bottom in 2022.
Now that we know what we have out of the H5 setup let's talk about what we need in order to enter this trade and make some gains!
-We need the H5 indicator to flip GREEN (Which it is very close to doing and could by EOW! Also, we want the H5 to cross through the yellow smoothing line as well.
-We need our Wr% to break up above at least -40, preferably -20.
-Finally, we want to see a break above $747
This is a long write up but I wanted to be thorough and fully explain the gameplan friends. This is still not a trade yet but it is a H5 setup that is getting close to a GREEN LIGHT!
🔜🎯$883
🎯$1,124 ⏲️Aug2025
🎯$1,182 ⏲️Feb2026
Not Financial Advice

ASML Holding | ASML | Long at $680.00NASDAQ:ASML Holding, a developer and servicer of advanced semiconductor equipment systems for chipmakers, dipped backed into my overall, long-term selected simple moving average (SMA). From here, stocks typically bounce or drop, but given the AI boom is far from "over", I anticipate another bounce to eventually close the gap near $1,060. It may show some minor weakness to close the gap in the low $600s and get the bears excited. But, unless the economy further shows major weakness in the semiconductor space, NASDAQ:ASML is in my personal "buy zone" at $680.
Target #1 = $730.00
Target #2 = $915.00
Target #3 = $1,060.00

ASML RISING: Weekly MACD cross up, daily EMA 34/20 cross up.After a clear double bottom AND ASML being the MOST OVERSOLD EVER in the history of this stock, we have a nice +/- 10% upside opportunity on the swing up, with very attractive risk reward ratio (depending on where you anchor your stops but I leave that to you).
Daily chart has showed us a lot of bullish divergence over the past weeks and it's clear traders have been loading up on cheap ASML shares while this unique opportunity presented itself and this has slowly exhausted the sellers over the past month, making it ripe for a jump.
ASML is ready for a major run up. What I like about this setup is that even if I am wrong about the mid-long term of this move. I capitalize on the short term momentum of the move with minimal exposure to risk.
This stock is volatile and I take that into consideration when trading it.
I am no expert and none of this is advice, just sharing how I see things, trade at your own risk.
Wish you good luck and good fortune!

ASML range bound in from 620 to 670. ASML has biggest volume at range 645 to 665. I posit that until ASML can break 675 we won't see the next level. Given the news that Biden won't levy strict tarrifs on TSMC, this is positive for ASML as well and I think in December we will see ASMl go above 700. Let's wait for the reversal confirmation though.

Going Long on ASMLOversold on monthly chart. Seeing buy opportunity here. Fib 0.618 and MA50 supporting the sp resulting a 2 months bounce here.

ASML BullishASML's technical outlook is bullish, with the first target at $750.
1.The price is supported by the 200-day moving average.
2.It is breaking out of a converging triangle pattern formed during the pullback.
3.A double bottom has formed on the daily chart.
TP:750/850/1000

$ASML to $1300 by the end of 2025- Whenever NASDAQ:ASML weekly chart touches 200 SMA, it tends to retrace up to 100% from that low.
- This company has huge moat and beaten down because of tariff fears.

A company like no other is in saleI expect a bullish momentum to about 860 Before mid januari.
After that we need to see what the economy does. Either up or further down.

Top 6 Stocks to Watch Right Now!Top 6 Stocks to Watch Right Now! 📈
Curious about the best stocks to add to your watchlist?
Dive into our latest video where we break down six must-watch stocks: NYSE:DIS , NASDAQ:ADBE , NASDAQ:WDAY , NASDAQ:DKNG , NASDAQ:TALK , and $ASML.
Discover why these picks should be on your radar as we explore them using my H5 Trading Strategy and in-depth technical analysis. Let’s dive in! 👇

ASML Pull Back FishingI really like the chart here. On the monthly/weekly charts you can see where ASML has pulled back before to the red DMA, the Fibbo retracement also hits at the $648 level where it bounced, and previous S/R looks to be in this area. It bounced from there and is now going up again. Longer term B&H.

easy play on ASMLI’ve been closely monitoring the monthly chart of ASML Holding (Euronext) and have identified a compelling setup that aligns with my long-term strategy. Previously, I shared an idea on TradingView with an ambitious $1200 price target, based on the stock’s strong long-term uptrend and solid fundamentals. However, upon further analysis, I’ve identified an internal trendline, which provides additional clarity and reinforces my bullish outlook. Interestingly, a similar internal trendline has been observed in other stocks like Super Micro Computer, further validating this structure.
Technical Analysis:
Primary Uptrend:
ASML is in a well-established long-term uptrend, confirmed by the primary ascending trendline connecting historical lows since 2012. This line showcases the structural strength of the stock and consistent investor confidence.
Internal Trendline Confirmation:
The recently identified internal trendline connects intermediate lows formed during price retracements, indicating a temporary slowdown in growth while maintaining an overall bullish structure.
This internal trendline has previously acted as dynamic support, suggesting it may serve as a critical reference point for future price action.
Key Price Levels:
The current price (631.5 EUR) sits near a confluence zone between horizontal support and the internal trendline. This presents a strong entry point for a long position with an attractive risk/reward ratio.
Significant support has been identified around the 600 EUR level, reinforcing my confidence in a potential price rebound.
Long-Term Price Target:
My long-term price target remains at $1200, which I believe is achievable as the stock continues to respect its bullish trend. This target aligns with ASML’s historical growth trajectory and the robust potential of the tech sector.
Entry Timing:
The recent bounce off the internal trendline and the +1.66% daily gain signal positive accumulation and increased buying interest. I plan to go long now, taking advantage of the dynamic support, with a stop loss set just below 590 EUR to manage risk effectively.
ASML Holding offers a compelling investment opportunity, supported by a solid technical structure and clear bullish potential. The internal trendline, combined with horizontal support and the broader long-term uptrend, strengthens my confidence in entering a long position. With a $1200 target and a well-defined risk management plan, I believe this is the right time to position for the next leg up in this stock.

asml head n shoulders bottom in actlook the chart, as i said 15 days ago , in a comment on asml, is forming an head n shoulders bottom reversal, in 1d chart, driving the AI power for ASML that has a total supreme monopoly in chip, for the next generation of advanced AI drive CHIPS.

ASML: A Key Player in Semiconductors- attractive risk/rewardASML Holding is a critically important company in the semiconductor industry because its components are used in the production of most semiconductors globally. Their unique technology gives them a strong position in the market.
Looking at the price action, the stock was trading around $700 back in April 2021 when the company had $5.25 billion in revenue and an EPS of $3.86. Fast forward to October 2024, revenue increased to $8.14 billion (a 55% increase), and EPS grew to $5.75 (a 49% increase).
Despite this significant growth, the stock is down over 35% from its highs of $1,100 set this July.
To me, this presents an excellent risk-reward opportunity, and I’m in at $688.

ASML Wedge BreakoutFor the market to continue its upward trajectory,
the semiconductor sector needs to show strength,
with ASML playing a critical role it needs to go higher,
After a period of consolidation, ASML forming a wedge breakout pattern,
Worth a try.
