NHY 20 min chart median lines & levels for entry and exitNHY - NORSK HYDRO - 20 min
Some median levels for the down side and some upper levels for longer term. POssible entry levels for short and mid term. Currently NHY is in a down trend but a reversal may be soon ahead as it reaches levels under 60, may we see levels under 57 before reversal
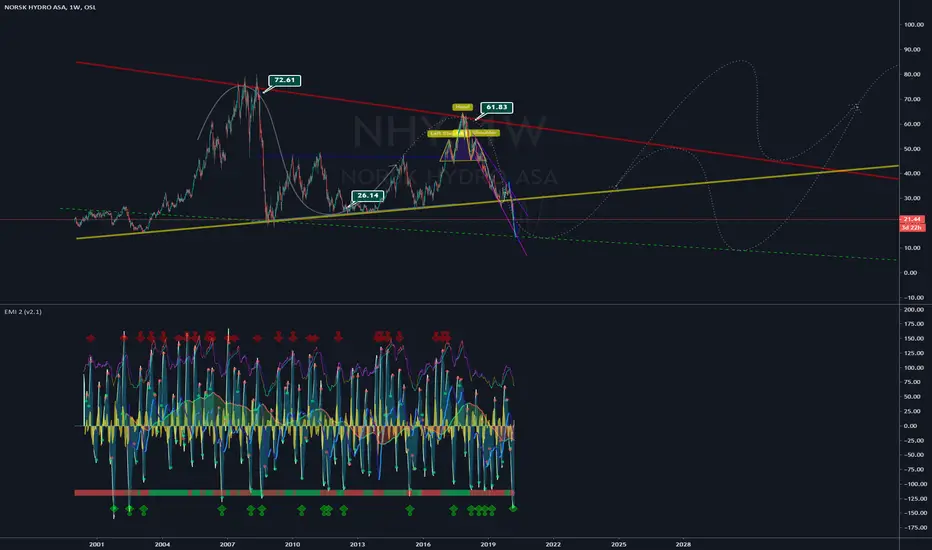
NOH1 trade ideas


Nhy - possible upside levelsWill we see a reversal of nhy soon ? Low levels at 55-53 - upper for 95-100.

Sell ideaAs you see on the chart we have:
- a squeeze;
- Bullish channel situation: After the breakout with force the support line we will have a big probability of a downtrend.

NHYDY Breaking Out?NHYDY has been in this upward channel for a while, could continue to bounce around inside of it (making for some very good trades when it hits support) or could also be posed for a breakout. Volume picking up, previous resistence was broken and retested. Plus the macro: aluminim price has been going up, EU sanctions against Russian aluminum (one of the world's largest producers), strength of the Norweigan economy vs the eurozone. Previous earnings were solid, next earnings on 03 May could be bullish enough to break the resistence. Worth watching.

NHYDY Breaking Out?NHYDY has been in this upward channel for a while, could continue to bounce around inside of it (making for some very good trades when it hits support) or could also be posed for a breakout. Volume picking up, previous resistence was broken and retested, plus aluminim price has been going up this week. Worth watching.


caution. Resistance at this level. Time to take profitcaution. Resistance at this level. Time to take profit

Targeting a run up to earningsNhy has a bullish structure, is neutral and shifting momentum to the upside. Trying to get an entry at 70.40 and targeting 74 for an easy target and 76 if it breaks ath


Norsk Hydro $NHYDY could brake up.$NHYDY looks like is about to break the wedge and extend to $20 area.
Please use your own research and always use SL or hedge your bets.

ASA - OSL Incepition day 23-3-2020Greetings fellow traders,
As time goes by, the markets evolve...
If your way of TA is strong, then the path will lead its way...
More visible, more probable:
Dashed lines; Possible forming patterns
Solid lines; Confirmed patterns / Support or Resistance
Dotted lines; Possible price-action trajectories / wave trend
Lighten colors = Support | Darken colors = Resistance
Current Pattern Formation Level:
Alpha pattern: Symmetrical Triangle -> Bullish Pennant
Beta pattern: Descending Broadening Wedge
Possible Echo Pattern: Descending Broadening Wedge
Today's Note:
Pretty much the same story as NAS. This one is a bit peculiar though. My point is, and it's a strange one. The price actually must come down a little bit, confirming a lower low. With result that this chart creates a bull pattern. Instead of a bearish one, if it does find support on the current region. Nonetheless, it does make sense? When you look at the big picture.
Genuinely curious whether this going to play out as I'm forecasting today.
To be concluded...
Bullish Butterfly Setup Bullish Butterfly Setup on Norsk Hydro with a second retest of the potential reversal zone

Can tecnical pattern push the stock back even with bad sentimentTO ME technically there is a lot off positive long term signs here. My challenge will be WHEN, at what price exactly to enter long. What do you guys think? should i enter at 26 and say good is good? or do you guys think i should try to hitt at a lower level? whe have seen eraligher that the right shoulder might be a little lower, but weeve allso seen it higher for this stock. And what do you think if one buys at 26 and it crosses down throught 25. Is that a sign for a quick temporary sell? Tell me in the coment section bellow!
Fundamental analysis will probably play a big role annyhow. This is not a complete analysis. BUT the technical patterns are verry bright clare to the eye. The stock tends to never trend below theese levels we are now closing in at, at 26-24. Ive waitet since about november to see the stock at theese levels and im now getting verry happy that the stock is moving exactly following the pattern i drew upp in november. With head and choulders on the 4h and day chart.
The tecnical aspects that counts for a medium time frame rend uppwards is:
- first of all the history repeating itself with the head and sholders.
- History repeating itself with head en shoulders - at theese same VERRY STRONG support levels at 25-26 (Look at volume profile also).
- RSI bellow critical lavels with the first shoulder in the pattern. Here annyway, i am not shure if we now will se a crossing of critical levels again. My thought for now ist that i will not put to much weight om the RSI pussition between now-and possibly lower levels. It is low allready, so if we would see 26 price levels with the non-crossing RSI i would personally still see it as a cualified time to buy. Mabye look intraday to se if i can hit som lower level spike down under 26..
- Last B was 15 feb 2016, before that 07 may 2012, before that 02 may 2009. SO.. in thought of the time we see some pattern here. now its 10 feb 2020. So we would look to buy in the time between now and end of may, 4 years after last price at theese levels.
Against:
- One should not underestimate the possibility of in mowing down the support at 25, with allso day bars or intraday bars spiking well below these lewels down to for example 22,5. Around time for by i would follow news that might come out that can push it further down than the 25 levels. If i have bought at 26, and it pushes down to 25 i will sitt. Crossing down at 25 i will probably sell and wait for clearer signs of my tecnical (positive) factors to show themselves. Allso see some positive days with increasing wolume to get confirmation that we ar not going away from the historical trend or setteling bellow the heavy supports down there.
TO ME technically there is a lot off positive long term signs here. My challenge will be WHEN, at what price exactly to enter long. What do you guys think? should i enter at 26 and say good is good? or do you guys think i should try to hitt at a lower level? whe have seen eraligher that the right shoulder might be a little lower, but weeve allso seen it higher for this stock. And what do you think if one buys at 26 and it crosses down throught 25. Is that a sign for a quick temporary sell? Tell me in the coment section bellow!

NHY attractive entry at 33s, S/R flipAfter the breakout, NHY now seems to be testing previous resistance levels as support at low 33s.
Bounced off MA50 and MA200, Golden Cross with same inputs.
Looks like its finally going to leave this inverse H&S pattern, and accelerate upwards.


NHY fallen below support, bad news from BrazilDeclining RSI, Negative MACD, Price below SMA200 and support has been broken.

Enter short on third test of trendlineNHY trending down on the 4H chart and has tested the trendline twice. Short opportunity will be at the next test of the trendline. MA 40 will be my trailing stop.
